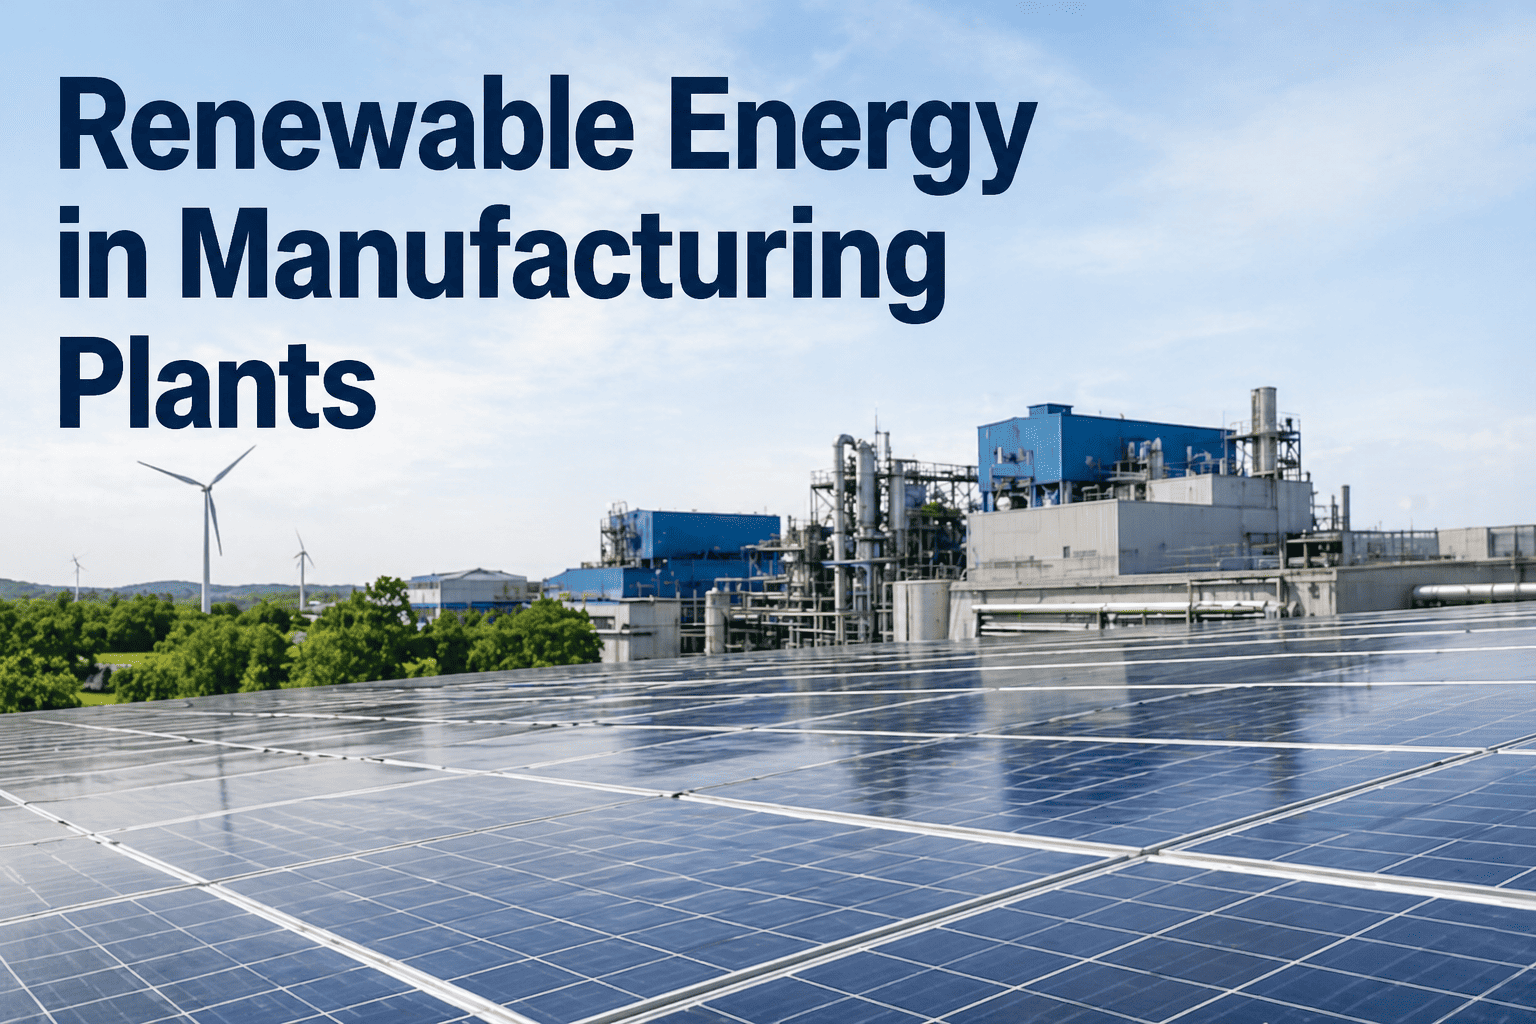
Renewable energy adoption in manufacturing plants is no longer a sustainability initiative—it's an operational necessity. Industrial facilities face escalating energy costs, fluctuating grid pricing, and increasing pressure to demonstrate carbon reduction across supply chains. On-site solar and wind systems directly address these challenges: reducing energy expenses by 30-40%, improving operational independence, and delivering measurable ROI within 5-7 years.
Renewable Energy
Renewable Energy in Manufacturing Plants: Solar, Wind & Hybrid Systems
8–10 min read
38%
average energy cost reduction within first 3 years of on-site solar installation
$2.1M
average 10-year net savings from 500kW solar rooftop array on mid-size manufacturing facility
6–7 yrs
payback period for industrial solar with current federal tax incentives and depreciation
12–18 mo
typical deployment timeline from site assessment to full generation capacity
The Manufacturing Plant Energy Challenge
Manufacturing plants consume 20-30% of industrial energy while operating under compounding cost pressures. Grid electricity prices have risen 18-24% over the past four years. Peak demand charges during production shifts represent 40-60% of monthly energy bills. Equipment efficiency improvements alone—without generation changes—reach diminishing returns beyond 15% savings.
On-site renewable generation shifts this dynamic. Solar arrays generate peak output during high-demand hours on manufacturing floors. Wind systems provide off-peak generation, balancing daily production cycles. Hybrid solar-battery systems decouple production timing from grid availability, enabling the plant to operate on favorable energy economics regardless of external utility rates.
Three Renewable Energy Models for Manufacturing
Each model addresses different facility constraints, balance sheets, and long-term energy strategies. The optimal choice depends on available capital, rooftop or ground space, regional solar/wind resources, and operational energy profiles.
Best For
100–500kW capacity, existing roof structures, 5–8 years operational timeline
Output Profile
Peak generation: 8 AM – 4 PM
Seasonal variation: 25–30% between winter/summer
Roof utilization: Zero additional land required
Economics
Installed cost: $2.00–$2.40/watt
Payback period: 6–7 years with depreciation
O&M cost: $0.15–$0.25/kWh annually
35–40%
of annual energy demand covered by rooftop array
Best For
250kW–2MW capacity, open terrain, 10+ year ROI horizons
Output Profile
Generation: 24/7 capacity factor 25–35%
Peak output: Night hours, high-wind seasons
Zoning: Requires minimum setback distances
Economics
Installed cost: $1.30–$2.00/watt
Payback period: 8–12 years with tax credit
O&M cost: $0.02–$0.05/kWh annually
45–65%
of annual energy demand for 500kW turbine in Class 3 wind zone
Best For
200kW solar + 100kWh battery, peak shaving, grid independence
Output Profile
Solar: 8 AM – 4 PM peak generation
Battery: Captures excess, releases at peak demand 4 PM – 8 PM
Grid offset: 50–70% annual energy offset
Economics
Installed cost: $3.50–$4.20/watt (including storage)
Payback period: 7–9 years post-incentives
Peak demand reduction: 60–80%
$180K–$240K
annual savings from avoided peak demand charges on 200kW system
Calculate Your Facility's Renewable Energy ROI
Every manufacturing plant has a unique energy profile. We analyze your historical consumption, roof/ground space, local solar irradiance, and applicable incentives to model exact returns. Book a consultation to review your specific ROI scenario.
Energy Generation vs. Facility Demand: Timing Alignment
The critical distinction between on-site generation and grid purchasing is temporal alignment. Manufacturing plants operate on fixed production schedules. Solar generation peaks during 8 AM–4 PM window. Peak demand charges occur during production hours—4 PM–8 PM on most utility rates. The timing mismatch between solar generation and manufacturing demand is solved through three strategies:
Move high-energy processes—compressor runs, material heating, batch production—into 10 AM–3 PM window. Manufacturing schedules flexible enough to capture full solar output without storage requirements.
Offset: 25–35% of annual consumption
2
Battery Storage (4–8 Hour Shift)
Solar generation stored in batteries during low-demand midday hours. Discharge occurs 4 PM–8 PM when demand charges peak. Eliminates rescheduling constraints while maximizing peak demand reduction.
Peak demand reduction: 60–80%
3
Wind + Solar Hybrid (Off-Peak Coverage)
Wind turbines provide night-time and evening generation. Solar covers morning/afternoon. Hybrid approach covers full 24-hour demand with minimal storage. Most effective in Class 3+ wind zones.
Annual offset: 60–75%
Installation, Permitting & Deployment Timeline
Federal incentives and state renewable energy mandates have streamlined permitting in most regions. However, engineering design and equipment procurement create the longest lead times.
Month 1
Site Assessment & Design
Rooftop survey, soil analysis, wind resource assessment, electrical load profiling, shading analysis. Engineering design complete; component specs finalized.
Month 2–3
Permitting & Procurement
Building permits, electrical interconnection applications, PPA review. Solar panels and inverters ordered (8–12 week lead times). Battery systems (if applicable) procured.
Month 4–5
Equipment Delivery & Staging
All components received. Pre-installation inspections. Utility interconnection agreement signed. Delivery coordination with minimal production disruption.
Month 6–7
Installation & Commissioning
Roof/ground mounting, electrical integration, inverter/battery installation, system testing. Utility inspection and final grid interconnection. Generation begins.
Month 8–12
Performance Optimization & Tax Filing
Monitor generation data, optimize battery dispatch schedules, capture ITC and MACRS depreciation benefits on tax returns. Baseline established for performance guarantees.
Federal Tax Incentives & Financing Models
The Investment Tax Credit (ITC) currently provides 30% of system costs as a federal tax credit through 2032, stepping down to 22% in 2033. Manufacturing facilities qualify for accelerated depreciation (MACRS) allowing 80% of system value to be depreciated over 5 years for tax purposes—effectively doubling the ITC benefit in net present value terms.
Capital Purchase (30% ITC + MACRS)
Upfront cost: $2.0M for 500kW system
Tax benefit Year 1: $600K (30% ITC)
Annual MACRS deduction: $320K (5 years)
Net installed cost after tax: $1.17M
Effective payback: 4.5–5 years
Equipment Financing (Loan)
7-year loan, 4.5% interest: $308K annually
Tax benefits: $600K (ITC) + $320K/yr (MACRS)
Year 1 net cost: Loan ($308K) minus tax benefits ($920K)
Cash-flow positive Year 1 after incentives
Effective payback: 5–6 years
Power Purchase Agreement (PPA)
30-year contract: $0.05–$0.08/kWh generation
$0 upfront capital required
Grid electricity offset: 35–45% annual consumption
Annual savings Year 1: $75K–$140K
Effective payback: N/A (no capital invested)
Renewable Energy Performance: 5-Year Case Study
Mid-size electronics manufacturing facility, 450kW rooftop solar + 100kWh battery storage, deployed across 18 months.
| Metric |
Year 1 |
Year 3 |
Year 5 (Cumulative) |
| Solar generation |
650 MWh annually, 38% of facility consumption |
648 MWh (0.3% degradation typical) |
3,230 MWh cumulative generation |
| Energy cost savings |
$118K from avoided grid purchases at $0.182/kWh avg |
$145K (grid rates increased to $0.224/kWh) |
$598K cumulative energy savings |
| Peak demand reduction |
Battery discharged 250 times, peak reduced 62% |
Peak reduction maintained 61%, demand charges down $84K |
5-year demand charge avoidance: $385K |
| Tax benefits realized |
$600K ITC claimed. MACRS deduction: $320K Year 1 |
Cumulative tax benefits: $1.28M |
Total tax benefits: $1.45M |
| Net cost realized |
System cost $900K after ITC. Net cash Year 1: $118K savings |
Cumulative cash savings: $298K |
5-year ROI: 84% of initial capital recovered |
| Carbon offset |
650 MWh × 0.92 lbs CO2/kWh = 299 metric tons CO2 avoided |
Cumulative offset: 895 metric tons CO2 |
5-year equivalent: 1,486 metric tons CO2 avoided |
Renewable Energy Integration With Manufacturing Systems
On-site generation connects to manufacturing operations through three integration points: facility electrical panel (main connection), equipment-level optimization (variable frequency drives on HVAC/compressed air), and real-time energy management systems that coordinate generation, storage, and grid purchasing decisions.
1
Solar Generation & Inverter
450kW rooftop array converts DC to AC power. Hybrid inverter manages power flow: direct facility use, battery charging, or grid export based on real-time demand and battery state.
→
2
Battery Energy Management
100kWh battery charged during low-demand hours (9 AM–2 PM). Discharge scheduled for peak demand window (4 PM–8 PM). Maintains 10–20% reserve for emergency support.
→
3
Facility Electrical Distribution
Renewable generation prioritized over grid draw. Excess generation automatically exported to utility grid (with net metering credit). Grid provides supplemental power when generation + storage insufficient.
→
4
Energy Management Dashboard
Real-time monitoring shows generation vs. consumption. Alerts trigger load-shifting recommendations. Historical data enables demand forecasting and battery dispatch optimization monthly.
Regional Renewable Resource Assessment
Solar irradiance and wind resources vary significantly by geography. Manufacturing facilities in high-resource regions achieve faster ROI. Strategic placement of turbines and rooftop arrays maximizes generation given local climate patterns.
| Region |
Solar Resource |
Wind Class |
Recommended System |
| US Southwest (AZ, NM, NV) |
5.5–6.5 kWh/m²/day |
Class 2 (fair) |
Solar primary, 35–50% offset achievable |
| US Midwest (IA, IL, MI) |
4.0–4.5 kWh/m²/day |
Class 3–4 (good-excellent) |
Hybrid solar+wind, 60–75% offset achievable |
| Pacific Northwest (OR, WA) |
3.5–4.0 kWh/m²/day |
Class 3 (good) |
Wind primary with solar supplement, 50–65% offset |
| Southeastern US (GA, SC, NC) |
4.5–5.0 kWh/m²/day |
Class 2 (fair) |
Rooftop solar + battery storage, 40–50% offset |
| California Coastal |
5.0–5.5 kWh/m²/day |
Class 2–3 (fair-good) |
Solar with battery peaking, 50–65% offset |
Frequently Asked Questions: Renewable Energy for Manufacturing
QWhat is the minimum rooftop space required for a 500kW solar array?
A 500kW system requires 3,000–3,500 m² (32,000–38,000 sq ft) of unshaded roof space. Modern high-efficiency panels (400–450W) occupy approximately 6–7 m² per panel. Most manufacturing facilities with 100,000+ sq ft footprints have sufficient roof area.
Book a demo to review your facility's solar potential.
QHow do power purchase agreements (PPAs) protect my manufacturing operation from grid volatility?
A 30-year PPA locks in electricity generation at a fixed rate ($0.05–$0.08/kWh). Your facility purchases this renewable energy directly, avoiding grid price escalation. If grid electricity rises to $0.25/kWh, your PPA-sourced power remains fixed, creating a long-term hedge against utility rate increases.
QCan on-site generation continue if the utility grid fails?
Solar arrays alone cannot operate in grid-down scenarios (safety requirement: inverter shuts down without grid reference). Battery-backed systems with "microgrid" capability maintain operation during outages, automatically isolating from the grid and supplying battery-stored energy to critical equipment. This requires additional controls but enables 4–8 hour backup autonomy depending on battery size.
QWhat maintenance do rooftop solar panels require on manufacturing facilities?
Annual maintenance includes panel cleaning (2–4 times yearly in dusty/industrial zones), inverter software updates, and electrical connection inspections. Total O&M cost typically $0.15–$0.25 per kWh generated annually. Manufacturing facilities benefit from existing maintenance teams—most solar O&M can integrate with existing building management schedules.
Book a consultation for maintenance planning.
QHow does battery storage affect the payback period of a solar system?
Battery systems add $1.50–$2.00 per watt to total system cost but reduce demand charges by 60–80%. For a facility with $150K annual demand charges, a 100kWh battery ($200K installed) pays back in 2–3 years through demand reduction alone. Without demand charge pressure, batteries extend overall payback by 1–2 years but unlock grid independence capabilities.
QWhat happens to the renewable energy incentives if a manufacturing facility is acquired or relocates?
Tax credits (ITC) transfer with asset ownership under most circumstances. Power purchase agreements and long-term generation contracts typically transfer to the new operator with utility approval. Federal tax depreciation benefits (MACRS) reset for the new owner, allowing accelerated deductions again. Consult with a tax advisor on your specific acquisition structure.
Deploy On-Site Renewable Energy for Your Manufacturing Plant
Reduce energy costs by 30–40%, eliminate peak demand charges, and lock in long-term pricing protection. We design custom solar, wind, and hybrid systems based on your facility's energy profile, available space, and financial objectives. Book a 30-minute consultation to model your renewable energy ROI.