Compressed air is the most underestimated energy cost in modern manufacturing — invisible on utility bills, untracked by most facilities, and quietly responsible for up to 30% of total plant energy waste. This article explores how compressed air system analytics transforms that hidden cost into a measurable, manageable and dramatically reducible line item for plant engineers and energy managers across U.S. manufacturing.
Compressed Air System Analytics: Eliminating the #1 Hidden Energy Waste in Plants
Most plant managers don't realize it, but compressed air is the single most expensive utility on your factory floor — and the most wasted. On average, 30% of compressed air generated in industrial facilities never reaches its intended destination, lost instead to leaks, pressure drops, and inefficient compressor cycling. For a mid-size plant spending $200,000 annually on compressed air, that's $60,000 quietly disappearing every year. This article breaks down how compressed air system analytics changes that equation — turning invisible waste into measurable savings, and reactive maintenance into proactive efficiency. If your facility is still running compressors on fixed schedules without real-time visibility, book a demo with iFactory's energy team to see what you're leaving on the table.
Why Compressed Air Waste Is So Hard to See — And So Expensive to Ignore
Unlike electricity or natural gas, compressed air waste doesn't show up as a line item on a utility bill. There's no meter telling you how much air leaked from a cracked fitting at Station 7 last Tuesday night. That invisibility is exactly why the U.S. Department of Energy estimates compressed air inefficiency costs American manufacturers over $3.2 billion annually — waste that persists not because engineers don't care, but because they literally cannot see it without the right instrumentation.
The problem compounds across three distinct layers: generation losses (compressors running at suboptimal loads), distribution losses (leaks and pressure drops), and end-use losses (oversized regulators and open blow-offs). Each layer interacts with the others, meaning fixing only one rarely delivers the expected savings.
- Leaks go undetected for months or years
- Compressors run on fixed schedules regardless of demand
- Pressure setpoints never optimized after commissioning
- Annual audit finds 8–15 leaks; the rest persist
- No visibility into which zones waste the most air
- Compressor failures are reactive and unplanned
- Leak events detected within hours via pressure decay
- Demand-based compressor staging cuts unloaded run time
- Pressure band optimization reduces energy 1% per 2 PSI
- Continuous monitoring finds 40–120 leaks per cycle
- Zone-level sub-metering isolates top 20% of waste
- Predictive alerts prevent 35–50% of unplanned failures
Which Machine Learning Models Work Best for Crude Oil Price Forecasting
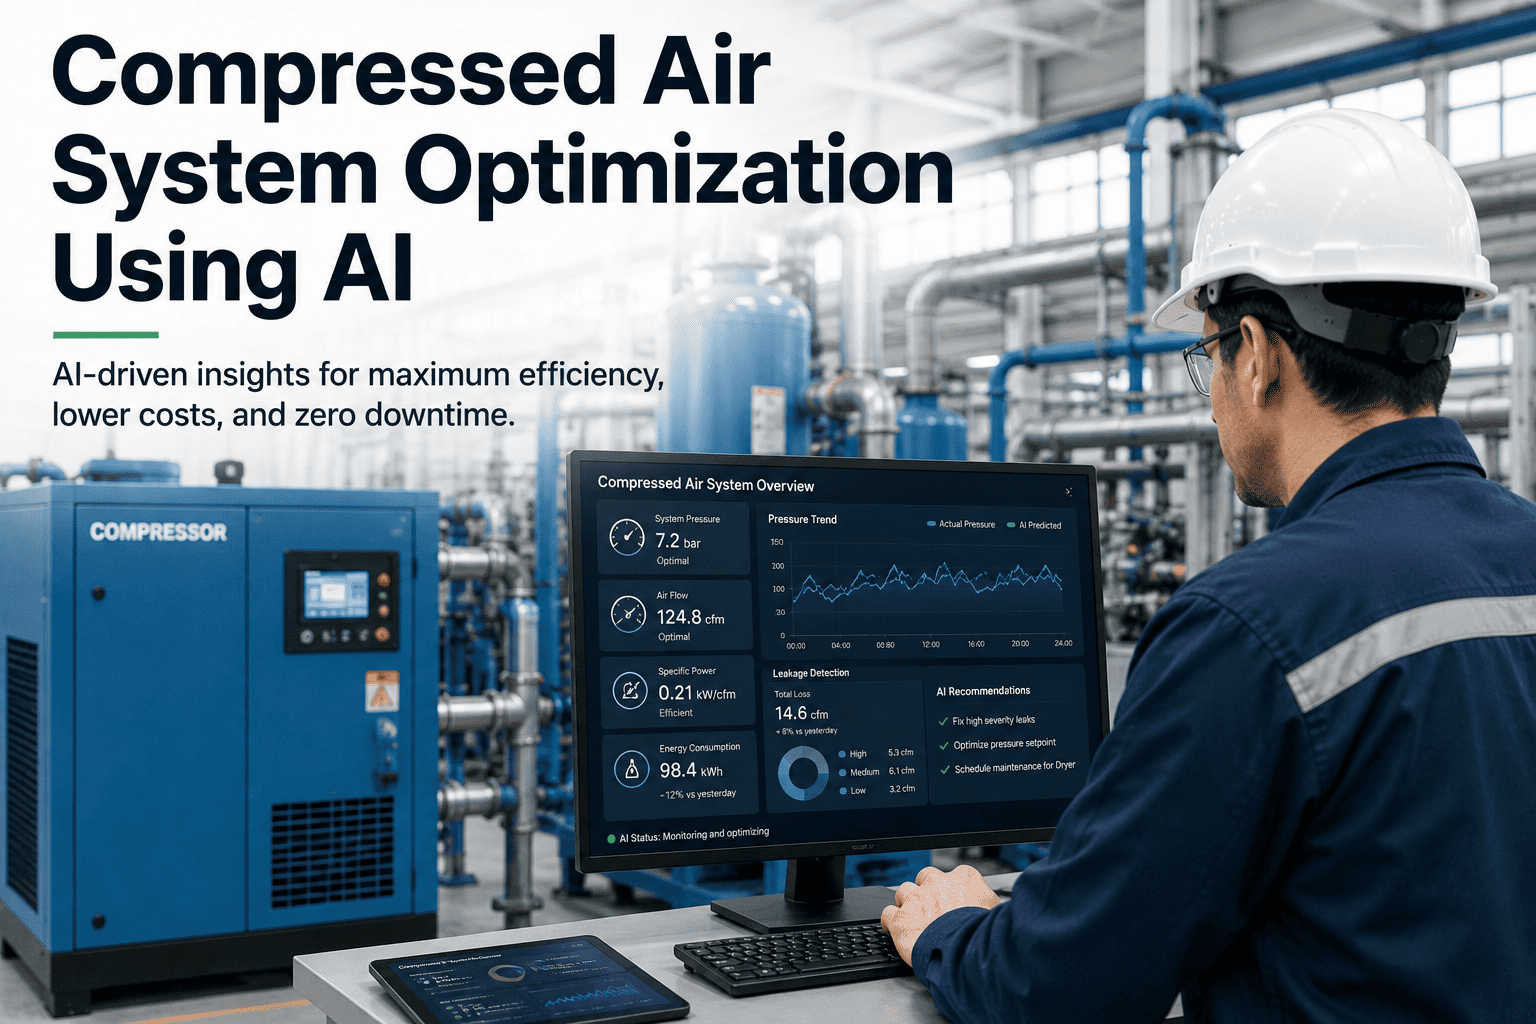
Compressed air analytics platforms instrument your compressor room and distribution network with flow meters, pressure transducers, power meters, and temperature sensors — then apply machine learning models to identify waste patterns, anomalies, and optimization opportunities no human operator reviewing hourly averages would ever catch. The output isn't raw sensor data — it's actionable intelligence.
For facilities considering this transition, book a demo to see iFactory's compressed air dashboard before committing to hardware investments.
Leak Detection & Quantification
Best for: Distribution system efficiency
Pressure decay analysis during planned off-shift windows estimates total leak volume in CFM and assigns a dollar-cost to each identified leak zone, ranked by repair ROI priority. Finds leaks too small for auditors to catch manually.
Compressor Load Optimization
Best for: Multi-compressor rooms
Demand-forecasting models recommend optimal compressor staging sequences, eliminating unnecessary unloaded running time — typically the largest single energy waste in multi-compressor rooms.
Pressure Band Management
Best for: System-wide efficiency
Analytics identifies excessive pressure setpoints that generate artificial demand. Every 2 PSI reduction in header pressure reduces energy consumption by approximately 1% — analytics makes this reduction safe and measurable.
Predictive Maintenance Alerts
Best for: Asset reliability & uptime
Vibration, temperature, and current draw baselines enable early detection of bearing wear, valve degradation, and separator failures — before they cause unplanned downtime or efficiency losses.
Analytics vs. Manual Audits: Forecast Accuracy & ROI Comparison
The traditional approach to compressed air efficiency is an annual audit: a consultant walks the plant with an ultrasonic leak detector and produces a report two weeks later. Analytics-driven continuous monitoring finds everything else, all the time. The comparison below reflects documented outcomes from manufacturing facilities that switched from periodic audit programs to continuous analytics platforms.
| Metric | Annual Manual Audit | Continuous Analytics | Improvement |
|---|---|---|---|
| Leak detection frequency | Once per year | Continuous (real-time) | 365x more frequent |
| Leaks identified per cycle | 8–15 major leaks | 40–120 leaks (all sizes) | 5–8x more leaks found |
| Leak-to-work-order time | 2–8 weeks | Same shift (automated) | 95% faster response |
| Energy savings achieved | 8–12% of compressor energy | 20–35% of compressor energy | 2–3x greater savings |
| Compressor downtime events | Baseline (reactive) | 35–50% fewer events | Predictive prevention |
| Annual cost savings | $15,000–$40,000 | $60,000–$180,000 | 3–5x ROI vs. audit cost |
For facilities with multiple compressors and long distribution headers, book a demo and request a compressed air savings estimate tailored to your annual energy spend.
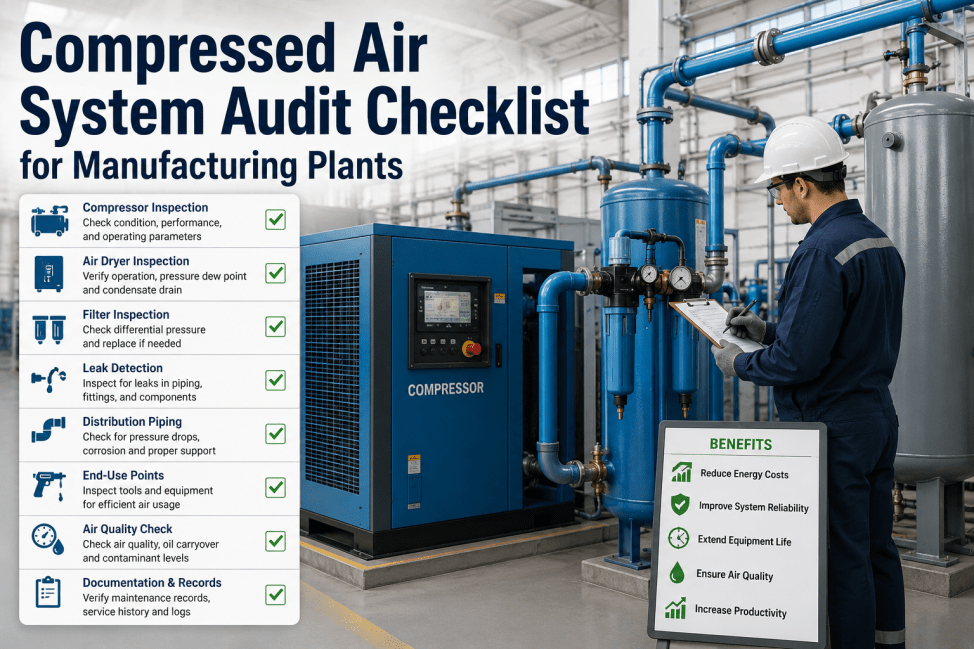
The Compressed Air Analytics Readiness Checklist for Plant Engineers
Before deploying analytics, a structured assessment of your current compressed air infrastructure ensures you're instrumenting the right points and establishing the baselines needed for meaningful comparison. The checklist below covers the minimum data collection and infrastructure requirements for a production-grade analytics deployment.
Quantified Business Impact: What Better Compressed Air Management Is Worth
The financial value of improved compressed air management compounds across every decision that depends on system efficiency — maintenance scheduling, capital project timing, ESG reporting, and operational budgeting. The following metrics represent documented outcomes from manufacturing facilities that have deployed analytics-integrated monitoring platforms.
Average reduction in compressed air energy costs vs. periodic audit-only programs.
Reduction in air leak losses for plants running 90-day analytics-guided reduction programs.
Typical ROI timeline for plants with annual compressed air energy spend above $100,000.
Average life extension when predictive alerts prevent load cycling stress and bearing wear.
Expert Review: What Industry Specialists Say About Compressed Air Analytics
Compressed air is often called the fourth utility in manufacturing — but unlike electricity, gas, and water, it has no utility provider sending a detailed breakdown of where it went. Continuous analytics finally closes that accountability gap. The facilities seeing the largest savings are those that treated their compressed air system as a monitored asset rather than background infrastructure.
The ROI on compressed air analytics typically lands between 8 and 14 months for plants spending over $100,000 per year. What surprises most plant managers isn't the magnitude of savings — it's how quickly the system pinpoints problems they had no idea existed. One client found a 47 CFM leak running to decommissioned equipment that had been leaking for four years.
The operational integration gap remains the biggest barrier for plant engineers. Many companies have built decent compressed air monitoring but cannot push the outputs into their maintenance scheduling systems automatically. The alert sits in a dashboard while operational decisions are made on intuition. Closing that loop is where the real business value is captured.
The integration gap experts identify — analytics value compounding through maintenance workflow integration — is the core design principle behind iFactory's platform. To understand how this maps to your compressor assets and CMMS, book a demo with our energy analytics specialists.
Compressed Air Analytics: Where U.S. Manufacturing Plants Are Heading
Compressed air analytics has moved from specialist niche to operational necessity for manufacturers competing on margins in high-energy-cost environments. The performance advantages — 20–42% energy reductions, real-time leak quantification, predictive compressor maintenance — are sufficiently documented that the question for most organizations is not whether to deploy analytics, but how to integrate it effectively into existing maintenance and operational workflows.
The next frontier is tighter operational integration. Analytics dashboards disconnected from the CMMS and scheduling systems where decisions are actually made deliver a fraction of their potential value. The plants building durable competitive advantages are those connecting compressed air intelligence directly into operational execution — in real time, not through manual export cycles.
If your organization is ready to move from annual audits to real-time intelligence integrated with your operational planning systems, book a demo with iFactory's energy AI team and receive a deployment roadmap built for your specific plant environment.
Compressed Air System Analytics — Practitioner FAQs
How much does it cost to instrument a compressed air system for analytics?
Hardware costs vary by facility size and existing instrumentation. A single-compressor plant typically requires $8,000–$18,000 in sensors, gateways, and installation. Multi-compressor facilities with zone sub-metering range from $25,000–$75,000. iFactory's platform licensing runs $300–$800 per month depending on the number of compressors. Given average savings of $60,000–$180,000 annually for mid-size plants, payback periods of 8–14 months are typical.
Can compressed air analytics work with older compressors that don't have digital interfaces?
Yes. The vast majority of deployments are retrofit installations on compressors that predate modern digital controls. External current transformers, pressure transducers, and vibration sensors attach non-invasively to existing equipment through IoT gateways — no changes to compressor controls required. Even compressors from the 1990s can be fully instrumented within a day of sensor installation.
How does analytics-based leak detection compare to ultrasonic leak detection surveys?
They are complementary, not competitive. Analytics detects the existence, zone, and estimated volume of leaks through pressure decay and flow imbalance analysis. Ultrasonic surveys pinpoint the exact fitting or valve. Best-practice facilities use analytics for continuous detection and trigger targeted ultrasonic surveys when analytics identifies a new leak event in a specific zone.
Does iFactory's platform integrate with SAP PM or other CMMS systems for work order generation?
iFactory integrates with SAP PM, IBM Maximo, Infor EAM, UpKeep, and other leading CMMS platforms via REST API. When an analytics alert fires — a new leak event, compressor degradation, or dew point exceedance — the platform can automatically create a work order in your CMMS with fault description, cost estimate, and priority pre-populated. To understand the integration pathway for your CMMS, book a demo with our integration team.
How long does it take to see measurable energy savings after deploying compressed air analytics?
Most plants see the first measurable savings within 30–60 days — from compressor setpoint optimizations and initial leak repairs analytics identifies immediately. The more substantial 20–30% energy reductions typically require a 90-day focused improvement program. Facilities that actively respond to alerts consistently outperform those that deploy the platform and revisit findings quarterly.