Picture this: your conveyor belt grinds to a halt mid-shift, downstream operations cascade into chaos, and within minutes you're staring at a five-figure production loss — all because a $200 motor bearing failed without warning. For U.S. manufacturers running high-throughput plants, conveyor and material handling systems are no longer just mechanical infrastructure. They are data-rich assets that, when properly monitored, can predict their own failures days or even weeks in advance.
Stop Reacting to Conveyor Failures — Start Predicting Them
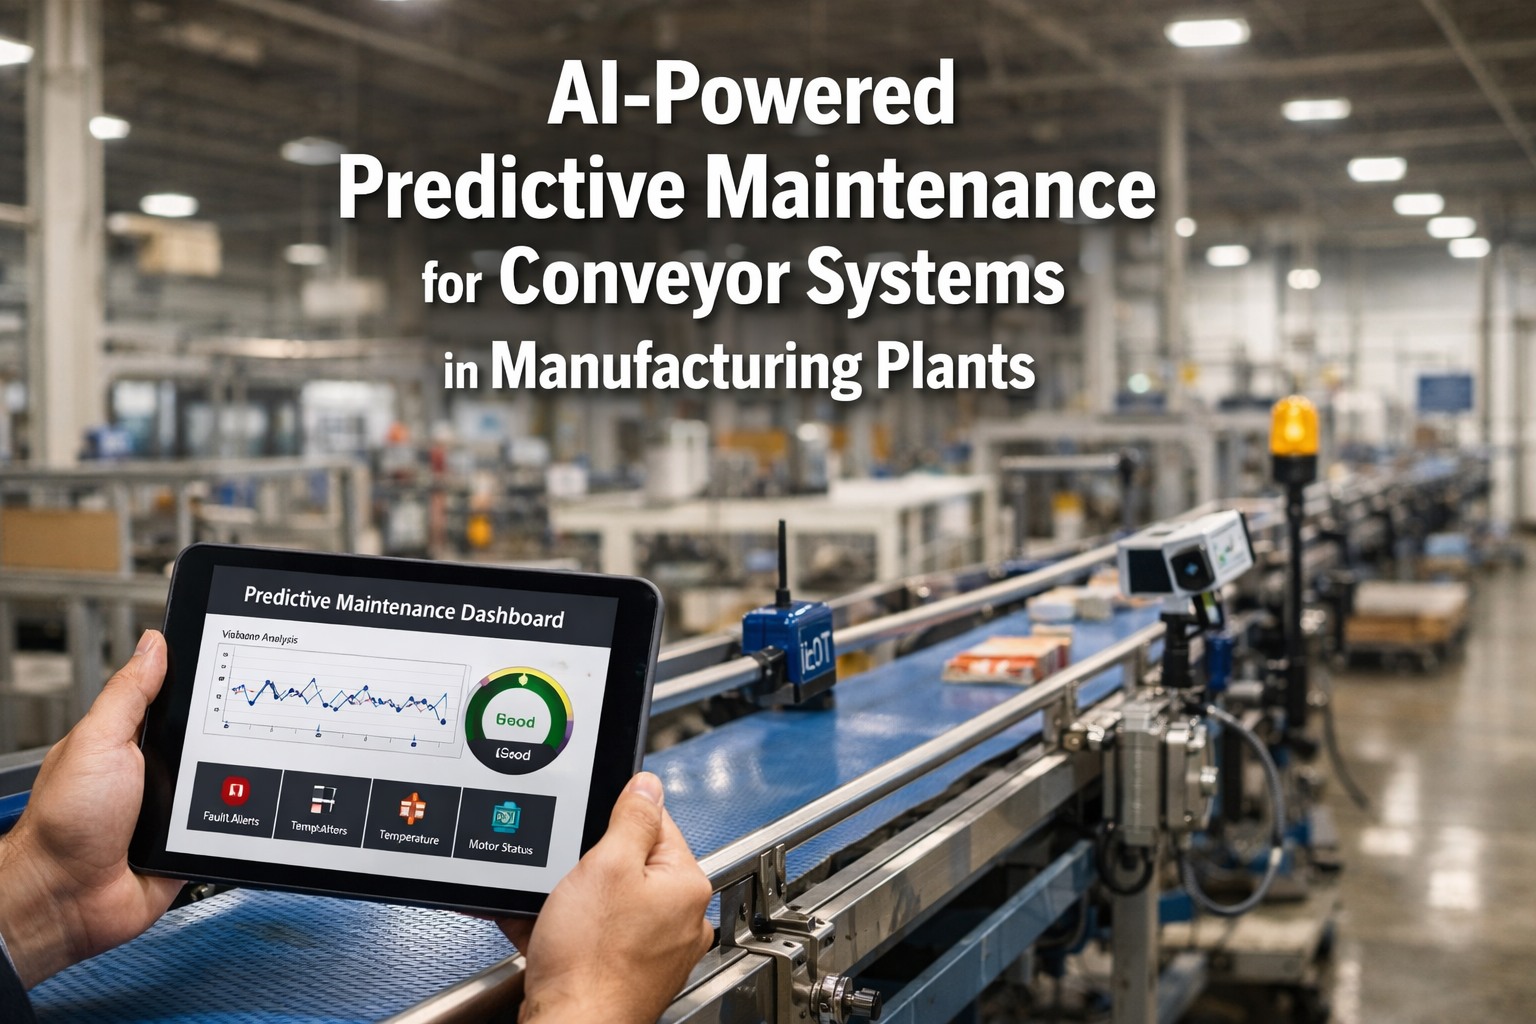
iFactory's conveyor analytics platform monitors belt tracking, motor health, and throughput patterns in real time — giving maintenance teams the lead time they need to prevent unplanned downtime.
Why Conveyor Downtime Quietly Drains Manufacturing Margins
In most manufacturing plants, conveyor systems move 100% of the work-in-progress between operations. When a conveyor stops, every downstream process stops with it. Yet conveyor maintenance is often treated as a low-priority discipline — reactive, calendar-based, and disconnected from real operating conditions.
The U.S. Department of Energy estimates unplanned downtime costs manufacturers between $50,000 and $250,000 per hour depending on industry. Conveyor failures account for a disproportionate share because they are upstream of nearly every value-adding activity in the plant. A bearing failure on a single belt drive can halt an entire assembly line. Visibility is the only real defense — book a 30-minute demo to see how iFactory provides it.
The Four Failure Modes Every Conveyor Analytics Program Must Address
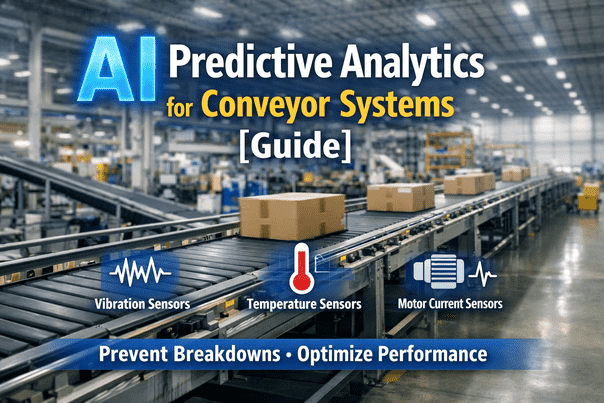
Conveyor systems fail in predictable ways. Each failure mode produces distinct signatures in vibration, temperature, current draw, and motion data — signatures that modern analytics platforms can detect long before catastrophic failure occurs.
Belt Mistracking
Lateral drift caused by uneven loading, idler misalignment, or pulley wear. Detected through edge-position sensors and vision-based tracking — addressable before edge damage occurs.
Motor and Drive Degradation
Bearing wear, winding insulation breakdown, and gearbox fatigue. Captured via vibration spectral analysis and motor current signature monitoring with 5–15 day advance warning windows.
Idler and Roller Failure
Frozen bearings, shell wear, and shaft breakage. Identified through acoustic monitoring and thermal imaging — single seized idler can damage belts costing $40K+ to replace.
Belt Wear and Tensioning
Surface abrasion, splice degradation, and tension loss. Monitored through load cell trending, belt-thickness sensors, and throughput correlation against motor torque baselines.
Building the Conveyor Analytics Technology Stack
A working conveyor analytics program is not a single tool — it is a layered stack of sensors, edge processing, analytics models, and operator workflows. Each layer addresses a specific question, and the value compounds when they are integrated. See iFactory's integrated conveyor stack in a live demo.
Sensor Layer
Vibration accelerometers on drive bearings, current transformers on motor inputs, thermal cameras on critical idlers, load cells on tensioning systems, and edge-tracking sensors on belt edges. Wireless mesh or wired industrial protocols deliver the raw signal data.
Edge Processing Layer
Local gateways perform FFT analysis on vibration data, calculate motor current signature features, and run lightweight anomaly detection. Only meaningful events and aggregated trends are sent upstream — preserving bandwidth and meeting OT network constraints.
Analytics and Modeling Layer
Time-series databases store historical performance baselines. Machine learning models detect deviations from known-good operating conditions, classify failure modes, and estimate remaining useful life based on degradation trajectories specific to each conveyor asset.
Workflow and Action Layer
Detected anomalies generate work orders automatically through CMMS integration. Maintenance technicians receive contextual alerts with the suspected failure mode, recommended parts, and historical failure data — closing the loop from detection to action.
Reactive vs Preventive vs Predictive Conveyor Maintenance
Most U.S. manufacturing plants operate somewhere between reactive and calendar-based preventive maintenance for conveyor systems. The shift to true predictive maintenance requires more than new sensors — it requires a different operational mindset. Here is how the three approaches compare on the metrics that matter most. Discover where your plant fits — book a free maintenance maturity assessment.
| Dimension | Reactive | Preventive (Calendar) | Predictive (Analytics) |
|---|---|---|---|
| Trigger | Equipment failure | Fixed time interval | Condition-based threshold |
| Unplanned Downtime | High | Moderate | Low |
| Parts Cost | Emergency premium | Replaced before EOL | Replaced at optimal point |
| Labor Efficiency | Overtime emergency calls | Scheduled but often unnecessary | Scheduled and justified |
| Safety Risk | High | Moderate | Low |
| Annual Cost Impact | Highest total cost | 30–40% reduction vs reactive | 50–70% reduction vs reactive |
90-Day Implementation Roadmap for Conveyor Analytics
Conveyor analytics deployments fail most often when teams try to instrument every asset simultaneously. The proven path starts narrow, demonstrates ROI on a critical conveyor, then scales. Here is the 90-day timeline that works in U.S. manufacturing environments.
Identify the Critical Conveyor and Baseline Performance
- Rank conveyors by downtime impact, failure frequency, and replacement parts cost
- Select one high-impact conveyor as the pilot asset for instrumentation
- Document historical failure modes from CMMS work order data over the past 24 months
- Establish baseline KPIs: MTBF, MTTR, parts cost per operating hour, throughput variance
Deploy Sensors and Establish Data Pipeline
- Install vibration accelerometers on drive motor bearings and gearbox housings
- Add current monitoring on motor inputs and thermal sensors on critical idlers
- Configure edge gateway and connect to iFactory analytics platform
- Begin collecting 14–30 days of baseline data under normal operating conditions
Activate Analytics and Validate ROI
- Enable anomaly detection models with operator-tuned alert thresholds
- Integrate detected anomalies with CMMS for automated work order generation
- Train maintenance team on alert interpretation and response workflows
- Measure first 30 days of operational impact and prepare scale-out business case
Want to compress this timeline? Book a demo to see iFactory's accelerated deployment.
Expert Review: What Plant Engineers Wish They Knew Earlier
The biggest mistake I see plants make is instrumenting their newest conveyors first because the integration is easier. That's backwards. Your oldest, most failure-prone conveyors are where the ROI lives. The second mistake is treating conveyor analytics as a sensor project rather than a workflow project. You can have the best vibration data in the world, but if your CMMS doesn't auto-generate the work order and your technician doesn't know what part to bring, the data is worthless.
What actually works is starting with one critical conveyor, proving you can predict a failure that would have cost six figures, and then using that case to fund expansion. I've seen plants justify their entire predictive maintenance budget on a single avoided belt replacement. iFactory makes this easier than most — worth a 30-minute demo.
iFactory Conveyor Analytics — Built for Plant Reality
iFactory's conveyor and material handling analytics module is engineered for U.S. manufacturing plants that need fast time-to-value without ripping out existing PLC and SCADA infrastructure. Every capability is built around operational reality on the floor.
- Continuous vibration and motor current analysis across all instrumented conveyors
- Belt tracking visualization with edge-position trend history and alerting
- Thermal imaging integration for idler and bearing temperature surveillance
- Machine learning models trained on conveyor-specific failure signatures
- Remaining useful life estimation for motors, bearings, and belt segments
- Severity-ranked alerts with operational impact context, not generic scores
- Auto-generated work orders linked directly to the detected anomaly
- Parts requirement prediction based on diagnosed failure mode
- Technician mobile dispatch with sensor history and recommended actions
- Throughput, availability, and OEE dashboards filtered by conveyor asset
- Energy consumption tracking correlated with load and operating conditions
- Multi-site benchmarking for enterprise material handling networks
Turn Your Conveyor Network From Cost Center to Competitive Advantage
See how iFactory's conveyor analytics platform delivers measurable downtime reduction within the first 90 days — with a deployment path that respects your operational constraints and existing infrastructure.
The Bottom Line for U.S. Manufacturers
Conveyor and material handling systems sit at the heart of every high-throughput manufacturing operation, yet they remain among the most under-instrumented asset classes in the plant. That gap is both the problem and the opportunity. Plants that move from reactive and calendar-based maintenance to condition-based analytics consistently report 40 to 70 percent reductions in conveyor-related downtime within the first year.
The technology stack is mature, the sensor costs have fallen by 80 percent over the past decade, and integration patterns with existing CMMS and ERP systems are well-established. The remaining barrier is not technical — it is organizational. Plants that succeed treat conveyor analytics as a workflow transformation, not a sensor procurement.
Start narrow with one critical conveyor. Prove the ROI. Scale from there. The compounding benefits — lower parts costs, fewer overtime emergency calls, higher OEE, safer working conditions — make this one of the most justifiable investments on the plant floor today. Get started with a 30-minute iFactory demo today.
Conveyor and Material Handling Analytics — Frequently Asked Questions
What sensors are essential for a basic conveyor analytics deployment?
The minimum viable sensor set includes vibration accelerometers on drive motor bearings and gearbox housings, motor current transformers for current signature analysis, thermal sensors on critical idlers, and edge-position sensors for belt tracking. For most conveyors, this combination captures over 85 percent of common failure modes. More advanced deployments add acoustic emission sensors for early bearing detection and load cells for tension monitoring on long belt runs.
How quickly can a plant expect ROI from conveyor analytics implementation?
Most U.S. manufacturing plants see measurable ROI within 90 to 180 days of deployment on a critical conveyor. The single avoided unplanned shutdown typically pays for the full sensor and platform investment. Plants with high-value throughput — automotive, food and beverage, pharmaceutical packaging — often achieve payback in under 60 days due to the high opportunity cost of conveyor-driven line stoppages.
Do conveyor analytics platforms require ripping out existing PLC and SCADA infrastructure?
No. Modern conveyor analytics platforms are designed to run alongside existing PLC and SCADA systems, typically using passive network taps, dedicated sensor networks, and read-only integration with control system historians. The iFactory platform specifically uses non-intrusive deployment methods that do not require modifications to existing PLC programs or SCADA configurations, allowing implementation without production interruption.
How does conveyor analytics integrate with our existing CMMS?
Standard integration patterns include REST API connections, OPC UA data exchange, and pre-built connectors for major CMMS platforms. When an anomaly is detected, the analytics platform automatically generates a work order in the CMMS with the suspected failure mode, recommended parts, sensor history, and severity classification. This eliminates the manual translation step where most predictive insights traditionally get lost between the analytics tool and the maintenance workflow.
What is the typical sensor and platform cost for instrumenting one conveyor system?
For a typical 200-foot conveyor with a single drive motor, the sensor and edge gateway cost ranges from $4,000 to $12,000 depending on monitoring depth. Platform subscription costs typically range from $50 to $200 per asset per month for the analytics, dashboards, and CMMS integration. Compared to the average unplanned downtime cost of over $20,000 per hour in discrete manufacturing, the investment is typically recovered with a single avoided incident.