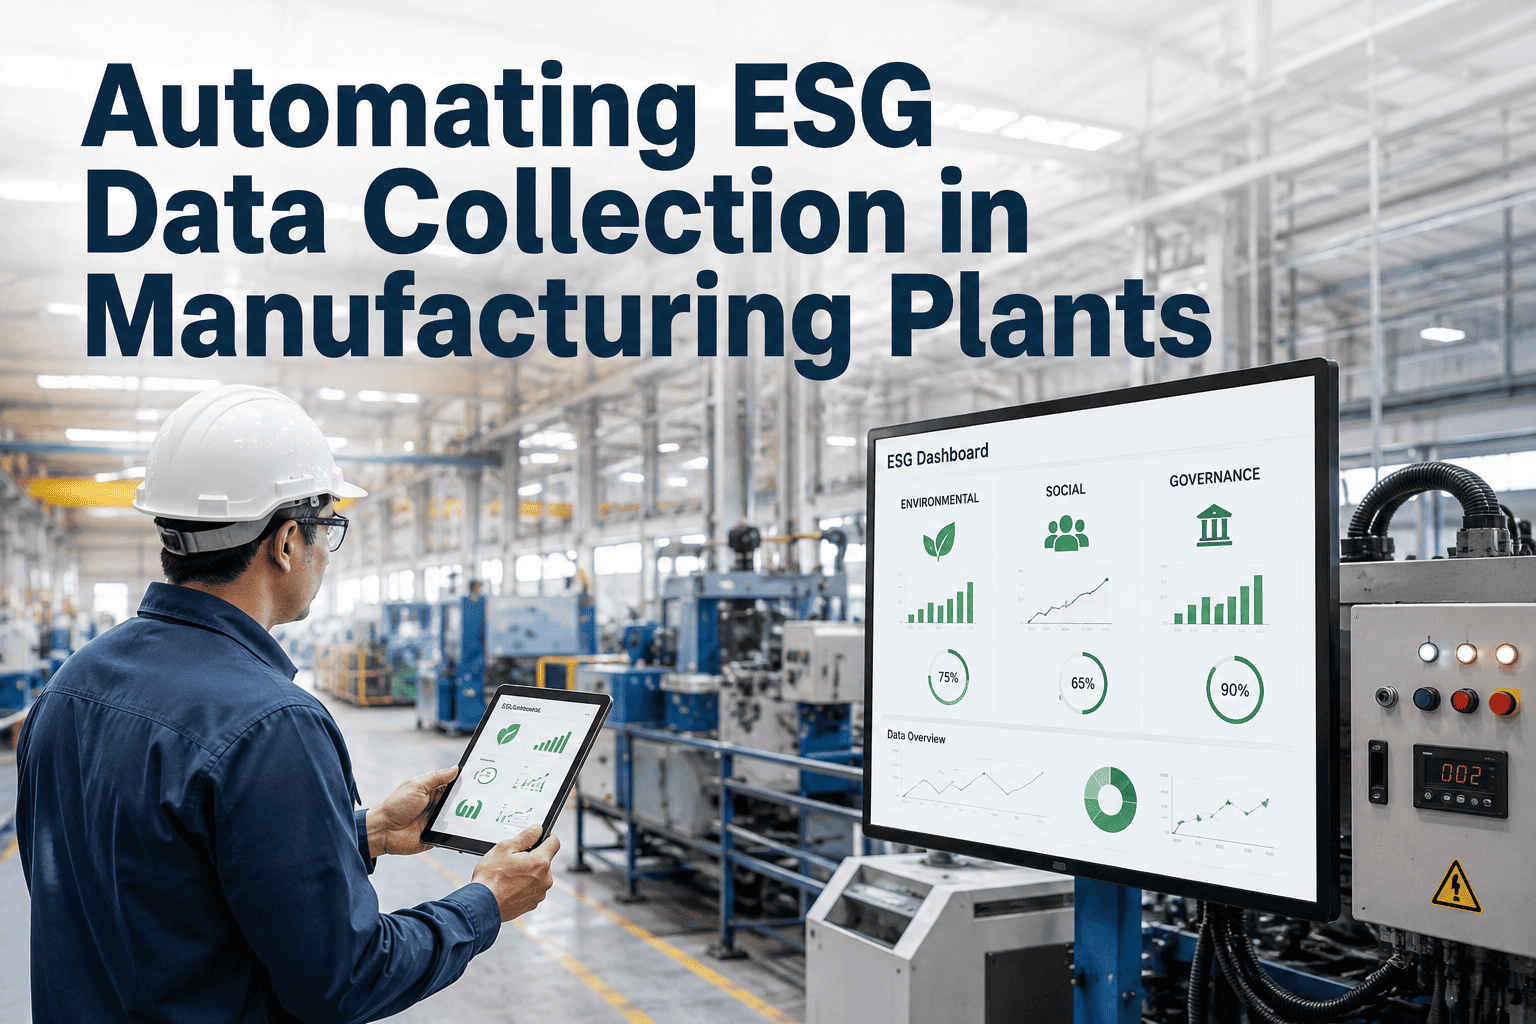
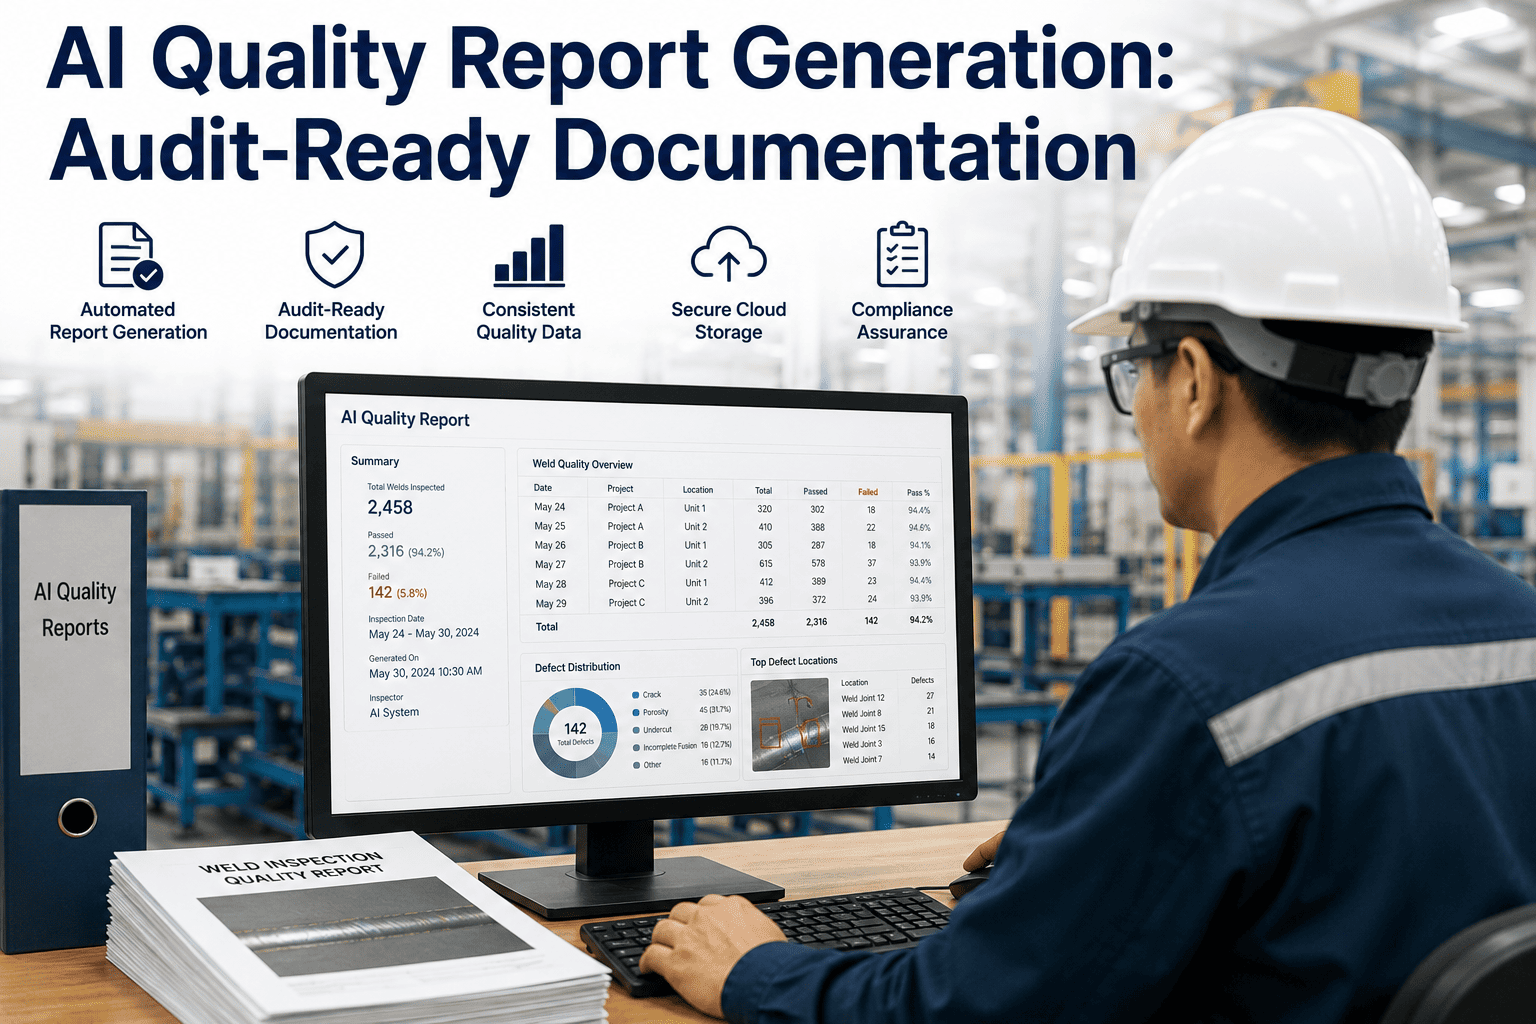
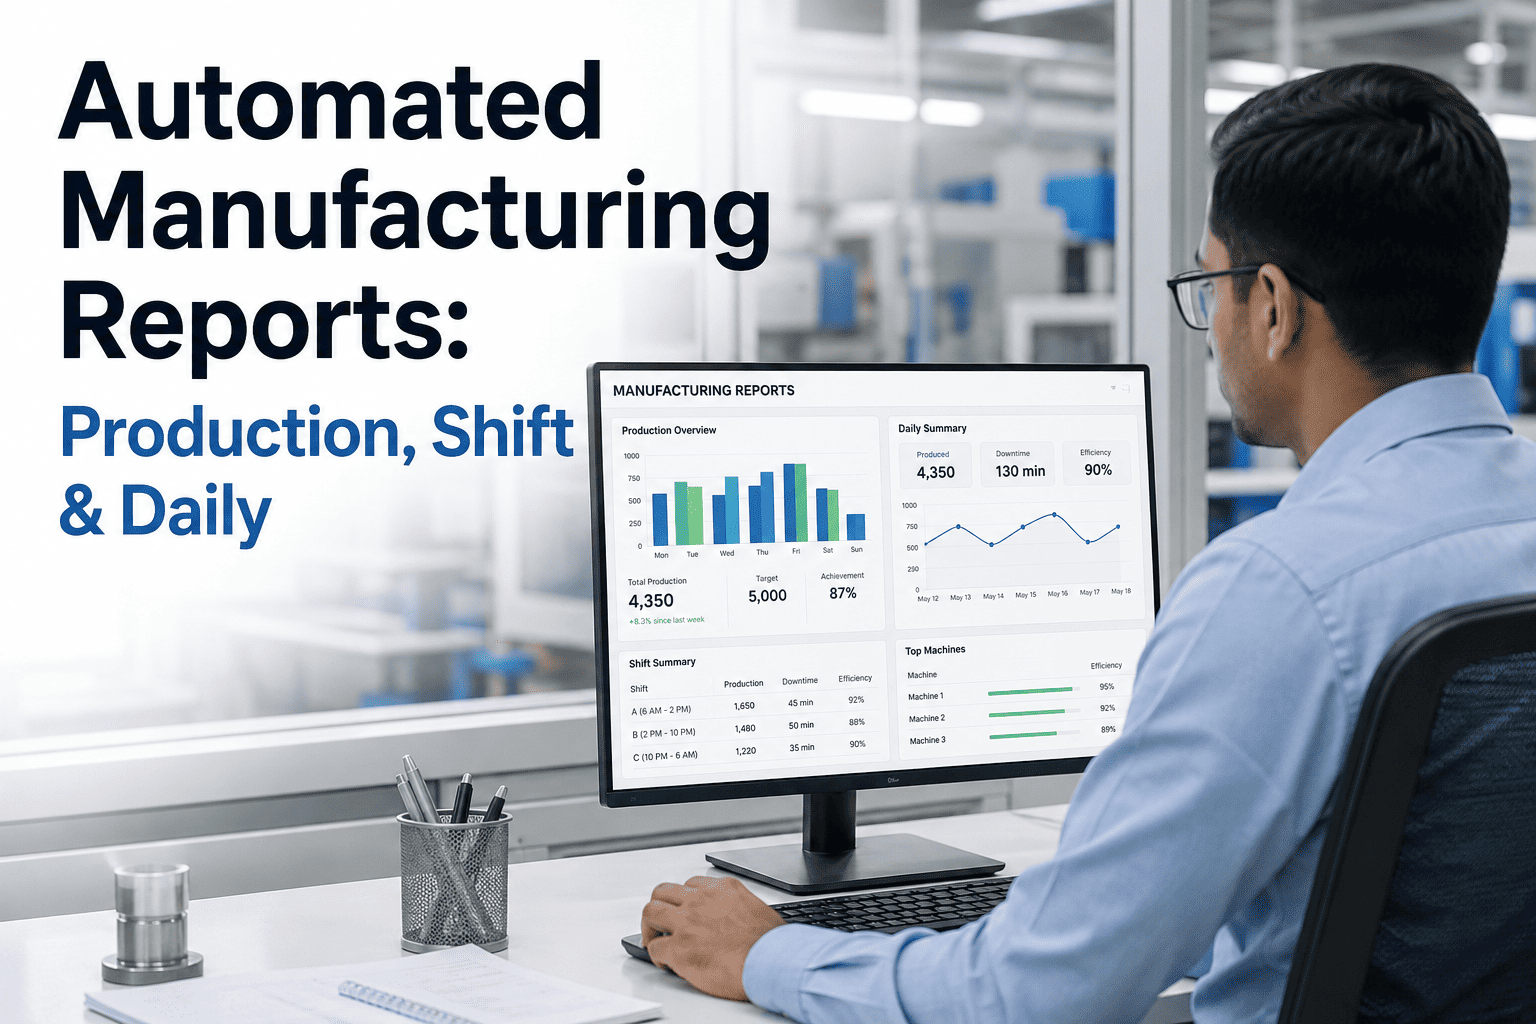
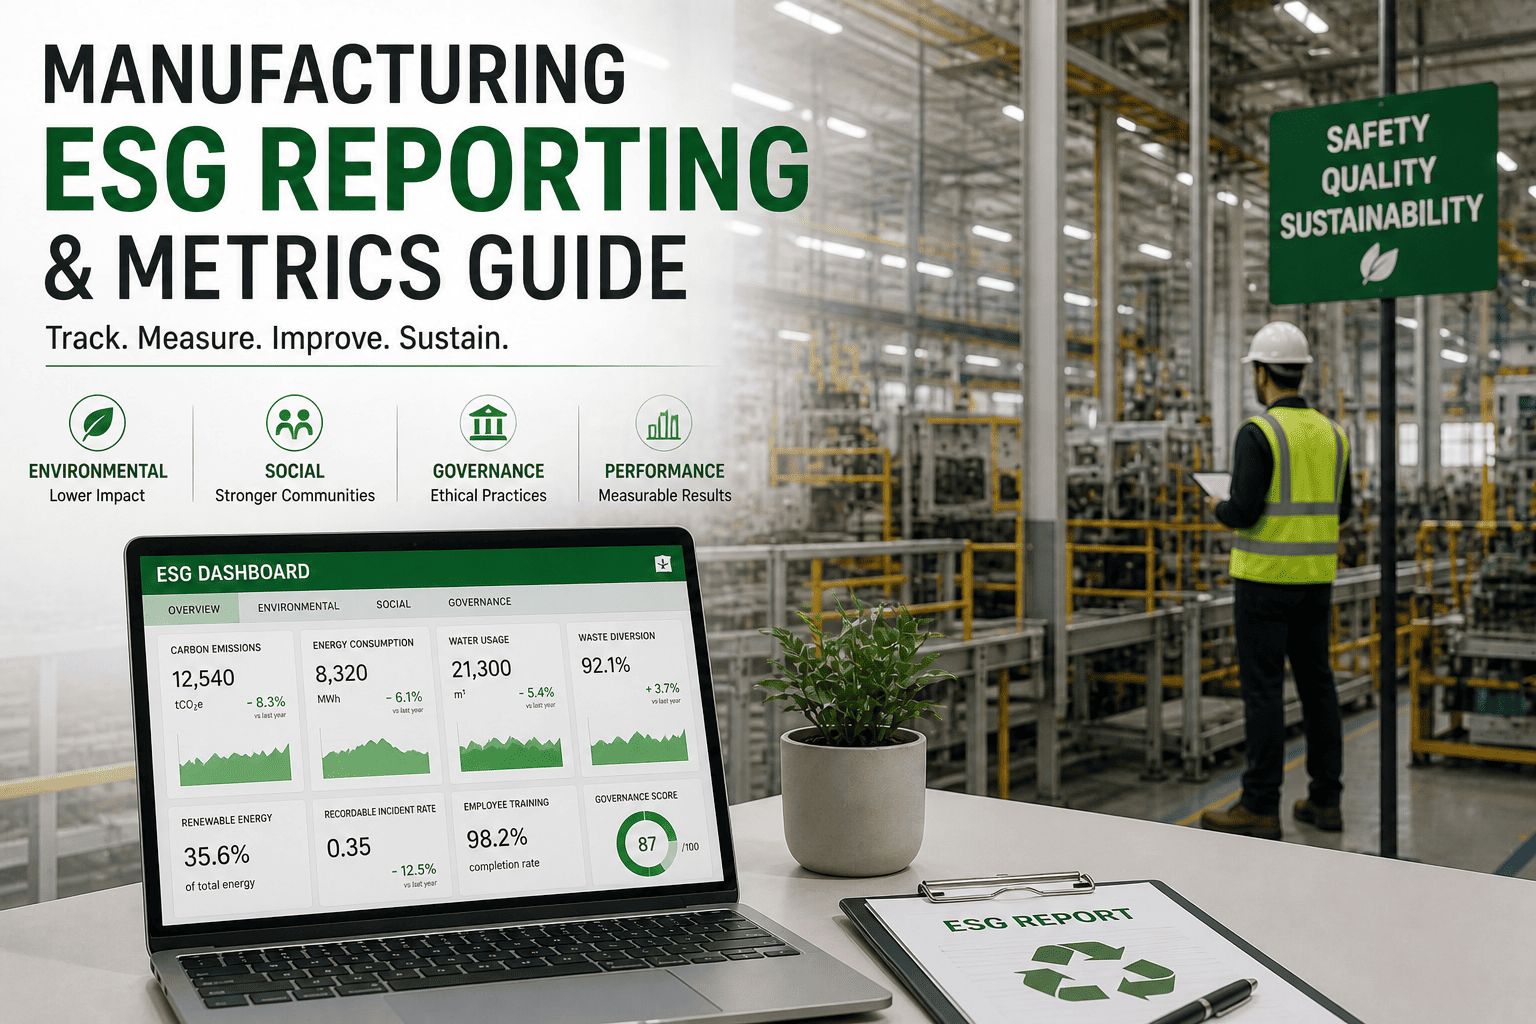
Every ESG report starts the same way in most manufacturing organizations: a sustainability manager opens a spreadsheet, emails plant managers for last quarter's energy and waste numbers, and waits. Energy data lives in one system, water usage in another, safety incidents in a third, and supplier emissions data arrives as a PDF attachment weeks after it was requested. By the time all of it is copied, reformatted, and reconciled into a single workbook, the reporting window has often shrunk to a scramble against the filing deadline. Frameworks like CSRD, GRI, and CDP keep adding data points while the underlying collection process stays exactly as manual as it was five years ago. iFactory's AI platform connects directly to the systems that already hold this data and assembles an audit-ready record continuously, and you can book a demo to see your own plant data flowing into a structured ESG pipeline.
SUSTAINABILITY & ESG · AI DATA AUTOMATION · AUDIT-READY REPORTING
Most Executives Call ESG Data Quality Their Single Biggest Reporting Challenge
Surveys of sustainability and finance leaders point to the same root cause behind nearly every ESG reporting delay: information scattered across spreadsheets, energy meters, HR systems, and supplier emails that nobody has ever connected into one place. The frameworks keep adding data points every reporting cycle while the underlying collection process stays exactly as manual as it was five years ago.
SCATTERED ACROSS THE PLANT
Spreadsheets
Energy Meters
HR System
Supplier Emails
Safety Logs
Water Meters
Procurement ERP
Paper Logs
ONE CONNECTED PIPELINE
Every source above feeds a single intake layer
AI validates values and standardizes formats
Data maps automatically to CSRD, GRI, and CDP fields
An audit-ready record updates continuously
THE HIDDEN COST
What Manual ESG Collection Actually Costs a Sustainability Team
None of these costs show up on a single invoice, which is exactly why they persist year after year. They show up instead as long nights before a filing deadline, numbers that do not match between departments, and a sustainability team that spends more time chasing data than acting on it.
Data Silos
Emissions, energy, HR, and supply chain data sit in disconnected systems across departments and plants, so nobody has one place to see the full picture at once, and every cross-department comparison starts with a fresh round of emails.
Version Control Chaos
A workbook shared across multiple contributors invites duplicate entries, overwritten formulas, and conflicting versions with no reliable record of which one is current, so the final report often gets reconstructed from memory at deadline time.
Reporting Cycle Delays
Fragmented data across spreadsheets and point solutions is a leading reason full ESG reporting cycles stretch across several months in many organizations, leaving little time for the sustainability team to actually act on what the data shows.
Cannot Scale With Growth
A process built around manual spreadsheet consolidation that works for one plant breaks down completely once a company is reporting across dozens of sites and business units with different local systems and formats.
DATA SOURCES
Where ESG Data Actually Lives on Your Plant Floor
Before any of this data can be reported, it has to be found. In most manufacturing organizations it is already being generated and captured somewhere; the problem is that it was never connected into a system built for ESG disclosure.
Energy and Utility Meters
Electricity, gas, and steam consumption by building, line, or piece of equipment, typically already metered but reported manually once a quarter from a printed or exported summary.
Waste and Water Logs
Discharge volumes, waste stream weights, and recycling rates tracked on paper logs or disconnected spreadsheets at the plant level, often in units that differ from site to site.
HR and Safety Records
Workforce diversity, training hours, and incident rates that feed social disclosures but usually live inside a separate HR platform the sustainability team cannot query directly.
Supplier Emissions Data
Scope 3 figures that arrive as PDF attachments, survey responses, or supplier portal exports on inconsistent schedules, each formatted a little differently from the last.
Procurement and Logistics
Material sourcing, freight distances, and packaging data held inside ERP and logistics systems that were never built for sustainability reporting in the first place.
Maintenance and Emissions Equipment
Flare, leak detection, and refrigerant records that connect directly to Scope 1 disclosures but rarely reach the sustainability team automatically without a dedicated request.
HOW IT WORKS
Five Steps From Raw Plant Data to an Audit-Ready Report
This is a genuine sequence: each step depends on the one before it, and the platform runs all five continuously rather than as a quarterly scramble.
01
Connect Existing Systems
Meters, ERP, HR platforms, and supplier portals are connected once through standard integrations, with no new manual entry process to maintain and no rip-and-replace of systems already in use.
02
AI Extracts and Validates
Values are pulled from structured systems and unstructured documents alike, then checked against expected ranges and historical trends to catch entry errors before they ever reach a report.
03
Data Maps to Frameworks
Validated values are mapped to the specific data points required by CSRD, GRI, CDP, or whichever framework your disclosure requires, without a separate manual re-entry effort for each one.
04
Gaps Get Flagged Automatically
Missing data points, stale values, and outlier readings are surfaced to the responsible data owner well before the filing deadline instead of surfacing during a last-minute review.
05
Audit Trail Builds Continuously
Every value carries a record of its source, timestamp, and any correction made along the way, giving third-party assurance reviewers exactly the traceability they need without extra preparation work.
Your ESG Data Already Exists. It Just Needs One Place to Live.
iFactory's AI platform connects the systems already generating your energy, waste, safety, and supply chain data into a single audit-ready pipeline, so your next filing starts from a clean dataset instead of a blank spreadsheet.
HEAD TO HEAD
Manual Spreadsheet Reporting vs an AI-Automated ESG Pipeline
The comparison below covers the operational dimensions that determine how long a reporting cycle takes and how confident a team can be in the resulting numbers.
WHAT THE RESEARCH SHOWS
The Numbers Behind the Manual ESG Reporting Problem
These figures come from recent enterprise sustainability and finance surveys and describe the scale of the data quality problem that AI-driven collection is built to solve.
76%
Of Executives Cite Data Quality as Their Top Challenge
Recent enterprise ESG surveys place data quality above every other reporting obstacle, ahead of framework complexity, staffing constraints, and budget limitations combined.
60%
Of Finance Leaders Struggle With Fragmented ESG Data
Data spread across disconnected systems remains one of the most commonly cited operational barriers to timely, accurate ESG disclosure across industries.
3-6
Months a Typical Reporting Cycle Takes
Fragmented data across spreadsheets and point solutions is a leading reason full ESG reporting cycles run this long in many organizations before a filing is ready.
50%+
Of Companies Cite Data Quality Under CSRD or ISSB
Over half of companies that have begun reporting under CSRD or ISSB name data quality as their primary compliance challenge, ahead of every other cited obstacle.
FREQUENTLY ASKED QUESTIONS
Questions Sustainability Managers Ask About AI-Driven ESG Data
Does this replace our sustainability reporting software, or work alongside it?
iFactory's platform focuses on the data collection and validation layer that feeds whatever reporting software or template your team already uses. Instead of re-entering figures into a separate reporting tool by hand, you export a clean, mapped, audit-ready dataset directly into your existing reporting process.
Book a demo to see how it fits alongside your current reporting stack.
How does the platform handle Scope 3 data that comes from suppliers?
Supplier emissions data is ingested from portals, spreadsheets, and PDF responses through the same intake layer as internal plant data, then validated against expected ranges before it enters the structured repository alongside everything else. Suppliers who are not yet ready to provide detailed data are flagged automatically so your team can prioritize outreach where it matters most.
Contact our support team to discuss your current supplier data collection process.
Can the system support multiple frameworks like CSRD, GRI, and CDP at the same time?
Yes, data is collected once into a common structured model and then mapped to the specific data points required by each framework, so reporting against CSRD, GRI, and CDP simultaneously does not require a separate collection effort for each individual standard.
Book a demo to see multi-framework mapping applied to your current data.
How does this help during third-party assurance review?
Every value in the platform carries a record of its original source, the timestamp it was captured, and any subsequent correction, which is exactly the traceability an assurance reviewer needs to verify a disclosure without your team reconstructing the trail manually.
Contact our support team to walk through an assurance-ready audit trail example.
How long does implementation take for a multi-plant manufacturing company?
Timelines depend on how many source systems need to be connected and how many sites are in scope, but most manufacturing customers see their first plant's data flowing into the structured pipeline within the initial weeks of onboarding, with additional sites added on a rolling schedule after that.
Book a demo to get an implementation estimate for your site count.
Stop Rebuilding Your ESG Report From Scratch Every Filing Cycle
iFactory's AI platform keeps an audit-ready ESG dataset current year-round, so your team spends its time on sustainability strategy instead of chasing spreadsheets. Book a demo to see your plant data connected into one pipeline.