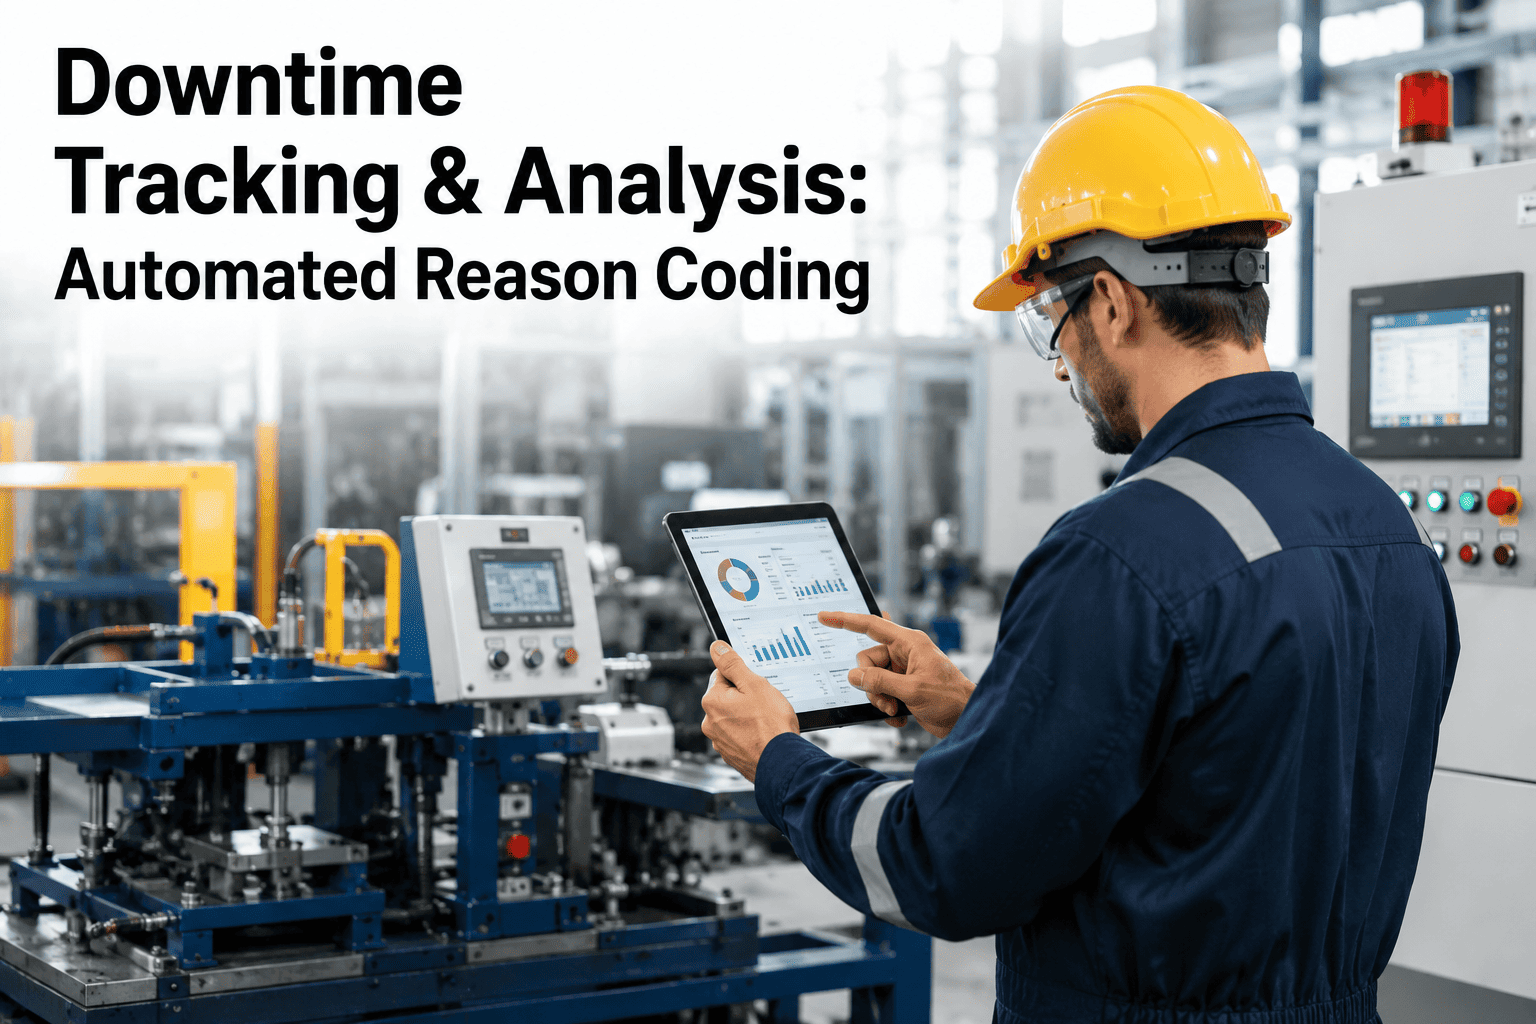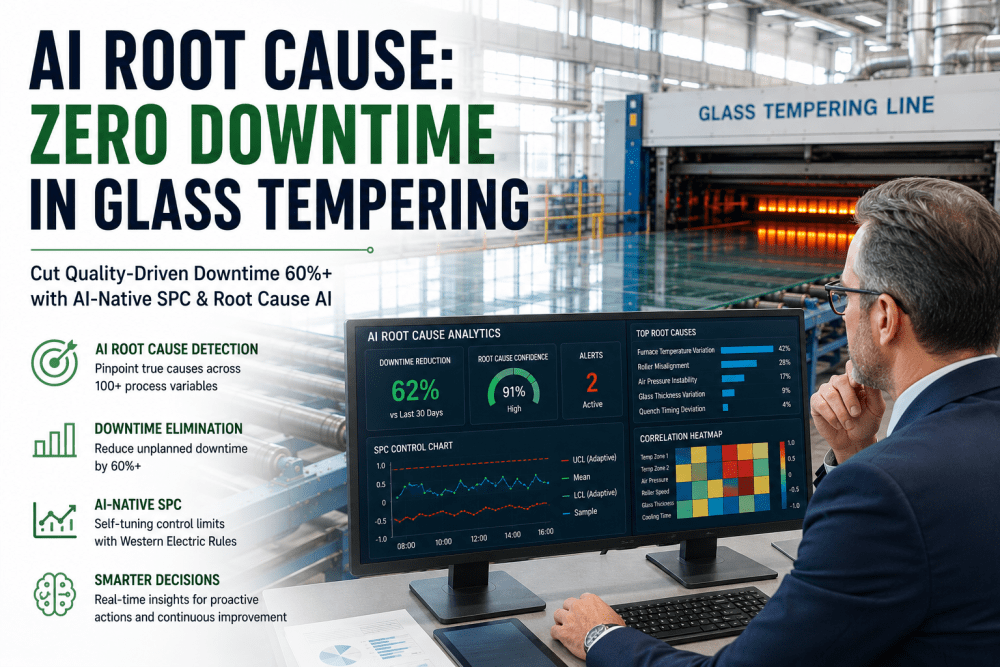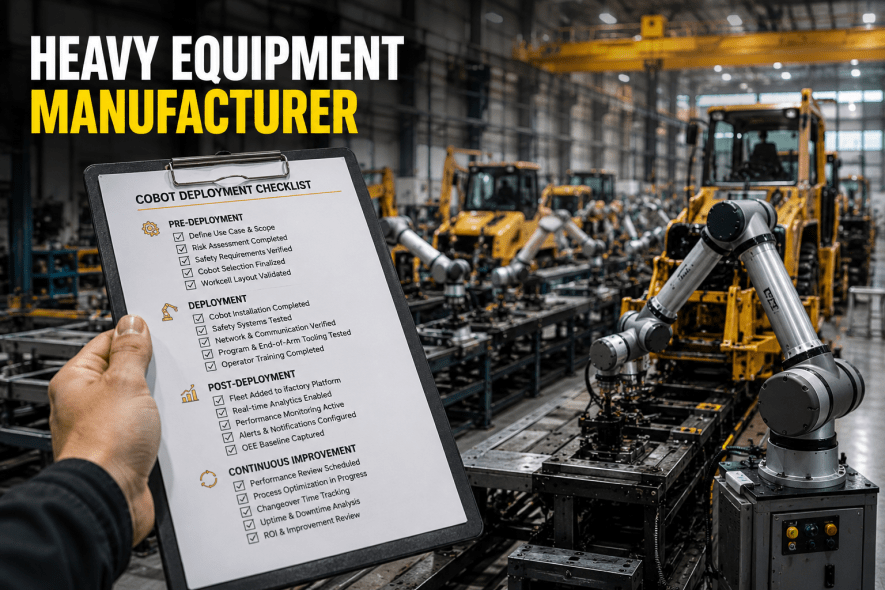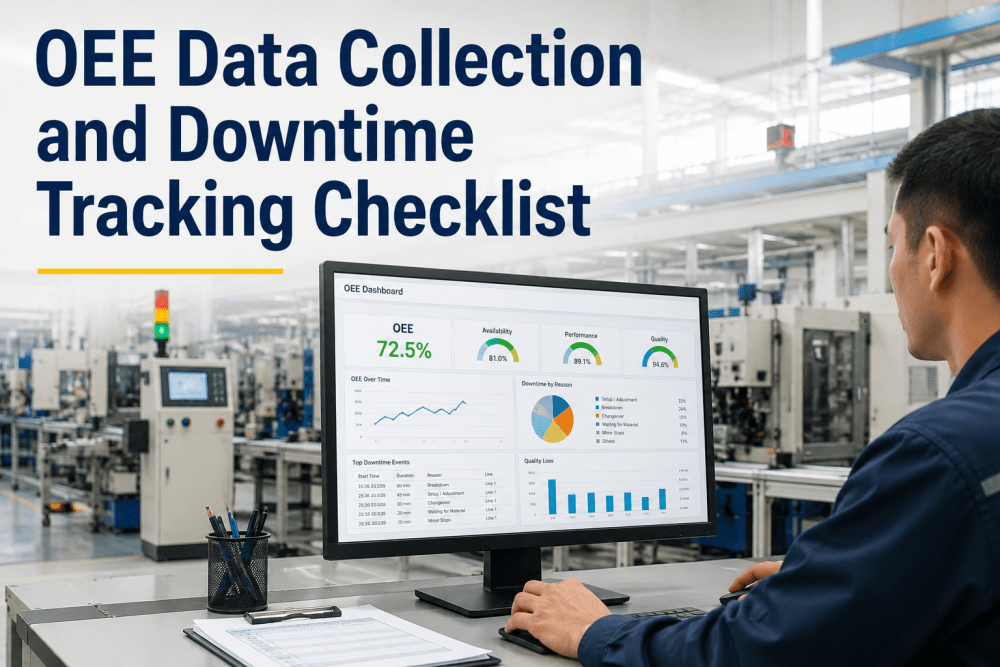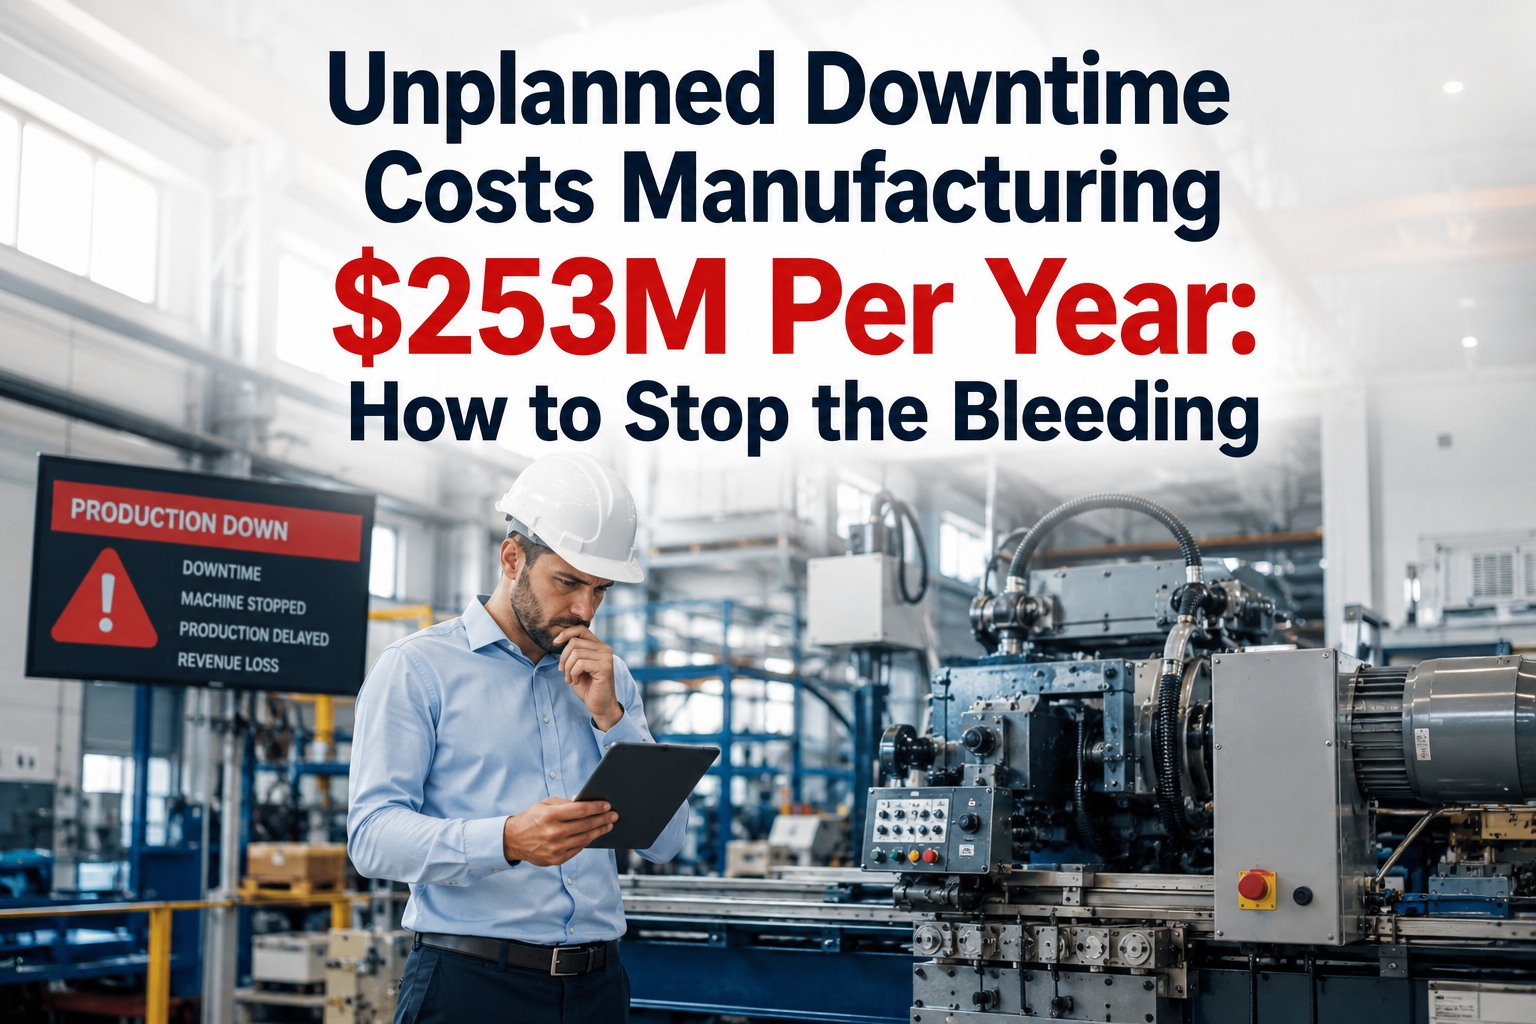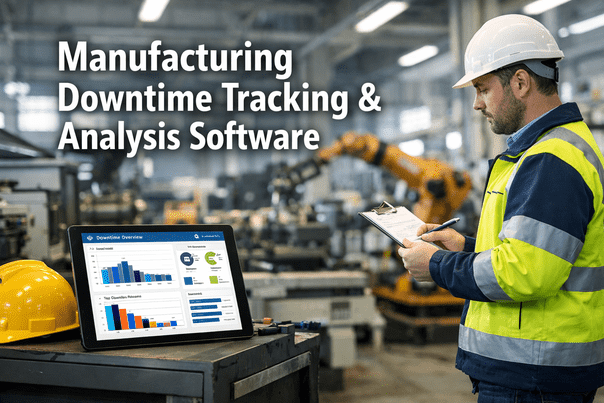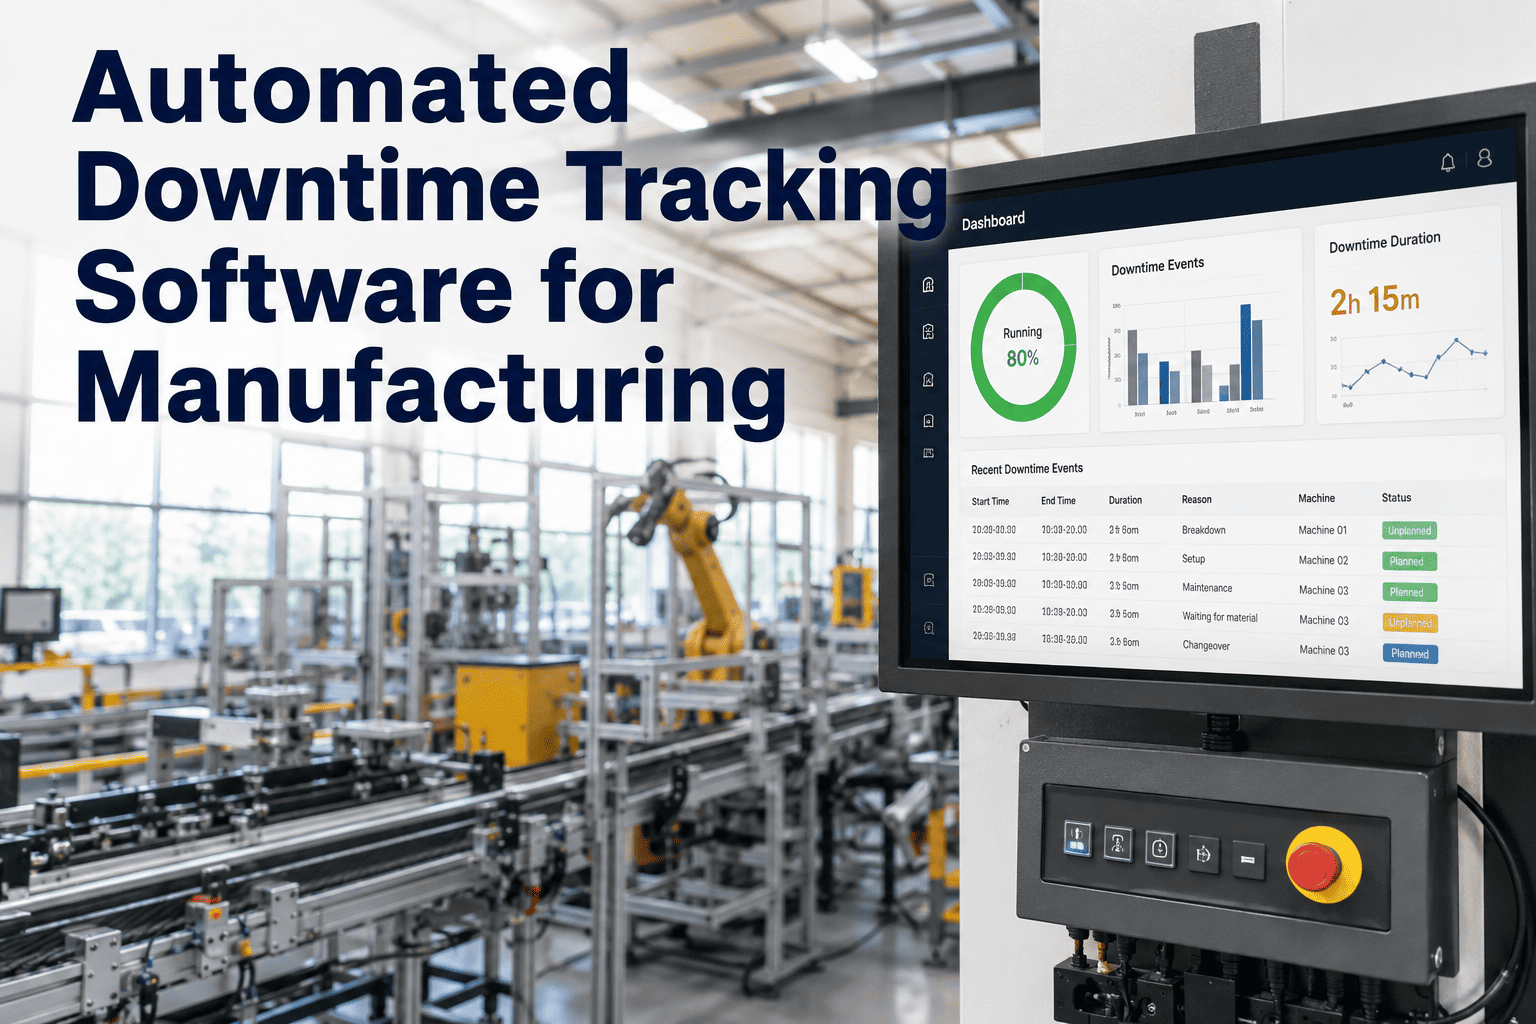
In the high-stakes environment of modern manufacturing, every second of unplanned downtime directly erodes profitability, supply chain reliability, and competitive edge. Yet, for decades, the industry has relied on a fundamentally flawed approach: manual downtime logging by operators. The reality is stark—by the end of the second week of any new tracking initiative, operator engagement plummets, logs become sporadic, and the rich, granular data needed for root cause analysis is replaced by vague, untrustworthy entries. This is not a failure of workforce diligence but a systemic problem of poor tooling. The solution lies in a paradigm shift toward automated downtime tracking software that leverages AI, IIoT sensor fusion, and edge computing to capture every millisecond of machine state without demanding a single click from your operators. At iFactory, we engineer this next-generation intelligence. Our platform doesn't just log downtime; it classifies, contextualizes, and predicts it, transforming raw machine signals into actionable production insights. Book a Demo to see how leading plants eliminate data fatigue and achieve unprecedented OEE transparency.
Stop Guessing. Start Knowing.
Eliminate manual logging fatigue forever. Capture every downtime second with AI-driven automation. See your true OEE in real time.
The Hidden Cost of Manual Downtime Logging
Manual downtime logging is not just an inconvenience; it is a systemic risk that corrupts the very data needed for continuous improvement. The root cause is human psychology: operators are hired to run machines, not to be data entry clerks. When a line stops, their immediate priority is to restart production, not to navigate a dropdown menu of 50 reason codes. This leads to a predictable pattern of data degradation—initially enthusiastic, then sparse, then outright fabrication of 'scheduled breaks' to avoid scrutiny. The result is a dataset that masks true losses, misguides root cause analysis, and inflates OEE calculations. Plants relying on manual logs often discover, after an audit, that their real OEE is 10 to 20 points lower than reported. This gap represents millions in lost capacity that could have been recovered with accurate, real-time tracking.
Beyond accuracy, manual logging creates a latency problem. By the time a supervisor reviews the shift report, the context around the downtime event—ambient noise, vibration patterns, preceding micro-stops—is lost. This temporal blindness prevents the identification of subtle, cascading failure modes that only become apparent when machine signals are correlated with downtime events in sub-second resolution. Automated downtime tracking solves this by timestamping every state change directly from the PLC or smart sensor, creating an immutable, high-fidelity timeline of production. This data is the bedrock of predictive maintenance and true lean manufacturing.
Core Capabilities of Automated Downtime Tracking
IIoT Sensor Fusion
Aggregate data from vibration, temperature, current, and pressure sensors at the edge. Our AI fuses these signals to detect machine state transitions with 99.7% accuracy, eliminating false positives from electrical noise or sensor drift.
AI Reason Code Classification
Machine learning models trained on millions of real-world events automatically classify downtime into granular categories: mechanical failure, material jam, operator wait, changeover, or planned maintenance. No operator input required.
Real-Time OEE Dashboard
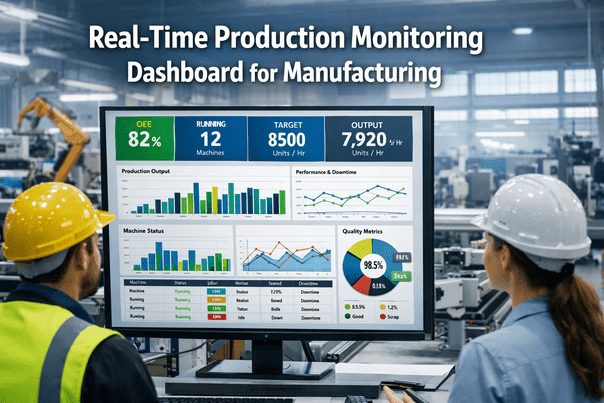
Visualize availability, performance, and quality metrics updated every second. Drill down from plant-level OEE to individual machine state timelines. Share live data with shift teams via mobile or large-screen displays.
Edge Computing Architecture
Process data locally on edge gateways to ensure zero data loss even during network outages. Only aggregated insights are sent to the cloud, reducing bandwidth costs and enabling sub-100ms response times for alarm generation.
Implementation Roadmap: From Data Chaos to Clarity
Phase 1: Sensor Audit & Connectivity
Our engineers conduct a thorough audit of your existing PLCs, SCADA systems, and sensor infrastructure. We identify gaps and recommend cost-effective IIoT retrofits for legacy machines. Connectivity is established via MQTT or OPC UA with zero disruption to production.
Phase 2: AI Model Training & Calibration
We deploy a baseline model trained on general manufacturing data, then fine-tune it using your specific machine signatures. This calibration period lasts 2 to 4 weeks, during which the model learns to distinguish between normal wear, material variations, and actual fault conditions.
Phase 3: Dashboard Customization & Rollout
Your team collaborates with our UX designers to build role-specific dashboards. Plant managers see strategic OEE trends; maintenance supervisors get real-time alarm feeds; operators receive simple traffic-light indicators. Full rollout is completed within 8 weeks.
Phase 4: Continuous Learning & Optimization
The AI model continuously retrains on new data, improving classification accuracy over time. Monthly analytics reports highlight emerging patterns, such as recurring micro-stops before major breakdowns, enabling proactive interventions.
Manual vs. Automated Downtime Tracking: A Quantitative Comparison
| Metric | Manual Logging | Automated Tracking |
|---|---|---|
| Data Accuracy | ~60% after 2 weeks | >98% continuous |
| Time to Capture Event | 5-15 minutes delay | < 1 second |
| Granularity of Reason Codes | 10-15 predefined codes | Unlimited AI-generated codes |
| Operator Time Spent | 30-60 mins per shift | 0 mins |
| OEE Visibility | Weekly lagging reports | Real-time, second-by-second |
| Predictive Capability | None | AI-driven anomaly detection |
Transform Your Downtime Data into Profit
Stop relying on unreliable logs. Get a live, AI-powered view of every lost second. Start your journey to true OEE transparency today.
The Role of AI in Downtime Reason Classification
Traditional downtime reason codes are static, generic, and often irrelevant to the specific failure mode. For example, a 'mechanical failure' code might be used for everything from a worn bearing to a broken belt, providing no actionable insight for maintenance planning. AI-driven classification changes this by analyzing multi-dimensional signal data—vibration frequency, current draw, temperature rate of change—to assign a highly specific cause. The model can distinguish between a gradual bearing wear pattern and a sudden overload event, even if the external symptoms appear identical. This granularity enables maintenance teams to move from reactive to predictive strategies, scheduling interventions based on actual degradation curves rather than arbitrary calendar intervals.
Furthermore, AI models can detect novel failure modes that were previously invisible. By clustering similar signal patterns that precede downtime events, the system can flag emerging issues before they cause a full stop. For instance, a recurring micro-stop lasting only 3 seconds might be dismissed by operators, but the AI correlates it with a subtle voltage dip from a failing power supply. Over time, the model learns the unique 'fingerprint' of each machine, adapting to changes in environment, material, or maintenance history. This continuous learning loop ensures that the classification accuracy improves over time, rather than degrading like manual logs.
Architecture for Zero Data Loss
Edge Buffering
Local storage buffers data for up to 72 hours of continuous logging. If the cloud connection is lost, no data is dropped. Once connectivity resumes, the buffer is automatically synced in order of priority.
Redundant Sensor Paths
Critical machines are equipped with dual sensors (e.g., primary and secondary vibration sensors). If one fails, the system seamlessly switches to the backup without interrupting data flow.
Data Integrity Checksums
Every data packet is tagged with a cryptographic hash. At the receiving end, the hash is verified to ensure no tampering or corruption occurred during transmission.
Real-Time Replication
Data is replicated across three geographically distributed servers. In the event of a regional outage, the system automatically fails over to the nearest replica with zero data loss.
Overcoming Operator Resistance: The Human Side of Automation
A common fear among plant managers is that automated tracking will be perceived by operators as 'Big Brother' surveillance, leading to pushback or even sabotage. However, the opposite is true when implemented correctly. By removing the tedious burden of manual logging, operators are freed to focus on their core tasks: running machines efficiently and maintaining quality. At iFactory, we design our interfaces to be completely invisible to operators—no login, no dashboard, no data entry. The system works silently in the background, and the only feedback operators receive is a simple green/red indicator on a wearable device or a large screen. This transparency builds trust, as operators see that the data is used to improve their work environment, not to punish them.
Moreover, automated tracking actually empowers operators by providing them with real-time insights into machine health. When a subtle vibration pattern indicates an impending jam, the system can alert the operator before it happens, allowing them to take preventive action. This transforms the operator from a passive observer into an active problem-solver. In our pilot programs, operator satisfaction scores increased by 35% after the first month, as they no longer had to spend 30 minutes per shift filling out forms. The key is to position the technology as a tool for empowerment, not surveillance. Clear communication, training, and involvement of operators in the rollout process are essential for adoption.
Frequently Asked Questions
How does automated downtime tracking handle machines with no digital output?
For legacy machines without PLCs or digital interfaces, we deploy retrofittable smart sensors that measure vibration, current, and temperature. These sensors communicate via wireless mesh networks (e.g., LoRaWAN or Zigbee) to an edge gateway. The AI models are trained to infer machine state (running, idle, fault) solely from these analog signals. In our experience, over 90% of legacy machines can be retrofitted without any modification to the machine itself. For the remaining 10%, we integrate with external timers or power meters. This approach ensures complete coverage across your entire factory floor, regardless of machine age. Book a Demo to see a live retrofit demonstration.
What happens if the network goes down? Do I lose data?
No, you will never lose a single data point. Our edge gateways are equipped with local storage that can buffer up to 72 hours of high-frequency data (100ms intervals). During a network outage, all data is stored locally and timestamped. Once the connection is restored, the gateway automatically syncs the data to the cloud in chronological order, using a priority queue to ensure critical alarms are delivered first. Additionally, the gateways have a battery backup that lasts up to 8 hours, so even a power failure will not interrupt data collection. This architecture guarantees 100% data integrity, even in harsh industrial environments with unstable power or network infrastructure. Contact our support team for more details on redundancy options.
How accurate is the AI classification of downtime reasons?
Our AI models achieve an average classification accuracy of 96.5% across all manufacturing verticals, with higher accuracy (up to 99%) in specific domains like automotive or electronics assembly where we have extensive training data. The accuracy is continuously improved through a feedback loop: when a maintenance engineer corrects a classification, that correction is used as a training example for the next model update. After the initial calibration period of 2 to 4 weeks, the model typically reaches peak accuracy for your specific machines. We also provide a confidence score for each classification, and any event with low confidence is flagged for human review. This hybrid approach ensures that you can trust the data for critical decision-making. Book a Demo to see accuracy benchmarks from your industry.
Can the system integrate with our existing CMMS or ERP?
Yes, our platform offers robust integration capabilities via REST APIs, OData, and direct connectors for major CMMS systems (e.g., SAP PM, Oracle EAM, IBM Maximo). Downtime events, classification data, and OEE metrics can be automatically pushed to your CMMS to trigger work orders, update asset histories, or populate dashboards. The integration is bidirectional: for example, when a work order is closed in the CMMS, the system can automatically reset the downtime counter for that asset. We also support exporting data in standard formats (CSV, JSON, XML) for custom integrations. Our professional services team will work with your IT department to ensure seamless data flow with minimal latency. Get support to schedule an integration assessment.
What is the typical ROI timeline for implementing automated downtime tracking?
Based on data from over 200 implementations, the median payback period is 6 months, with many plants achieving a positive ROI within 3 months. The primary drivers of ROI are: reduction in unplanned downtime (average 35% reduction), increase in OEE (average 15 percentage points), and elimination of manual data entry labor (saving 30-60 minutes per shift per operator). Additional indirect benefits include longer asset life due to predictive maintenance, reduced scrap from faster root cause analysis, and improved production scheduling accuracy. We provide a detailed ROI calculator during the demo to project your specific savings based on your current OEE and downtime rates. Book a Demo to receive a personalized ROI estimate.