A manufacturing plant that reviews production performance at the end of a shift is always reacting to decisions that were made hours ago. Real-time production monitoring changes this by making every machine state, output count, quality result, and downtime event visible to every role in the organization at the moment it occurs, not hours after the fact. iFactory connects to your existing PLCs and SCADA and delivers role-specific real-time dashboards for operators, shift supervisors, plant managers, maintenance teams, and quality engineers simultaneously, all from the same data source, with no manual data entry and no separate system to maintain. Book a free production monitoring assessment for your plant.
iFactory's real-time production monitoring connects to your PLCs and SCADA in read-only mode and delivers five simultaneous dashboard views: operator shopfloor display (live machine status and output count), shift supervisor view (line OEE and active downtime events), plant manager view (plant-wide production vs target), maintenance view (active faults and work order status), and quality view (SPC charts and defect Pareto). All five views update from the same PLC data stream in real time with no manual entry.
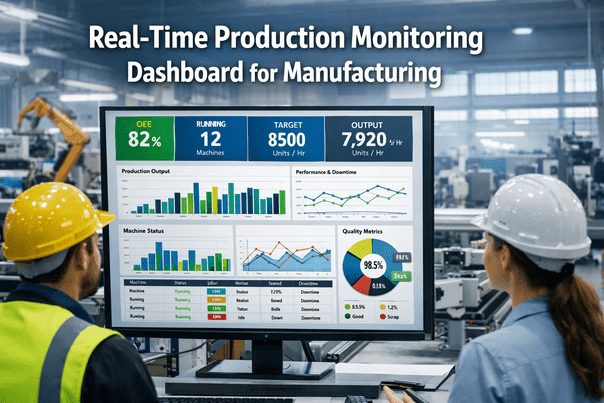
Five Role-Based Dashboard Views from One PLC Data Connection
The same production data means different things to different roles. An operator needs to know the current machine state and output rate. A shift supervisor needs to see OEE and active downtime events across the whole line. A plant manager needs production vs target across all lines. iFactory delivers all five views simultaneously from the same data connection, so every role has the information they need at the moment they need it. Book a demo to see all five views configured for your production lines.
Large-format display mounted at the machine showing current state, shift output count, target progress, and active fault code with elapsed time. Alert flashes when output rate drops below takt threshold.
Live OEE per machine, active downtime events ranked by duration, open work orders awaiting maintenance response, and quality reject count by fault code for the current shift.
Plant-wide production vs daily and weekly target, revenue on track vs plan, lines requiring management attention flagged by exception, and shift-level trend from prior day.
Active fault list ranked by production impact, open work order queue with priority and parts status, predictive alerts requiring scheduled intervention, and MTTR tracking for the current shift.
Live SPC control charts per key characteristic, FPY and scrap Pareto by defect code and machine, CpK trending with early warning when process capability is drifting toward incapability.
iFactory connects to your existing PLCs and SCADA in read-only mode and delivers all five role-specific dashboards simultaneously within 24 hours of connection, without any manual data entry configuration or separate data pipeline to maintain.
What Real-Time Monitoring Enables vs What End-of-Shift Reporting Provides
The difference between real-time monitoring and end-of-shift reporting is not just data latency. It is the difference between having the opportunity to intervene and not having it. Every hour of visibility delay is an hour of production loss that cannot be recovered.
iFactory Real-Time Monitoring Roadmap: PLC Connection to Full Plant Visibility
The fastest path from zero real-time visibility to a fully operational five-role dashboard is a structured 3-week deployment that connects data sources, validates accuracy, and configures role-specific displays before go-live. Book a demo to review the deployment timeline for your specific PLC types and plant layout.
PLC and SCADA connected read-only. Machine state signals validated against floor observation. Production count signals verified against known output. Quality system connected via OPC-UA or CSV. First 48-hour data capture reviewed for accuracy before proceeding.
All five role-based dashboards configured per your plant layout, shift structure, product mix, and target rates. Shopfloor displays positioned and tested. Mobile app configured for maintenance team. Alert thresholds set per machine and product. ERP integration connected for production vs target calculation.
All five dashboards live simultaneously. First shift with no manual downtime logging or paper end-of-shift report. Automated shift summary report sent to plant manager at end of each shift. First weekly review conducted using iFactory data, replacing manual report compilation process.
Client Results: Plants with iFactory Real-Time Production Monitoring
Average OEE improvement within 6 months of real-time monitoring deployment, driven by faster fault response, production target tracking, and elimination of unrecorded minor stoppages.
Average reduction in supervisor time spent compiling shift reports, preparing management review decks, and chasing operators for downtime reason codes per production line per week.
Time from PLC connection to first live real-time production dashboard displaying machine states, output counts, and OEE for all connected machines without any manual configuration.
Average reduction in time from fault occurrence to maintenance team acknowledgment, enabled by direct PLC-sourced mobile alert delivered before the operator has finished stopping the machine.
End-of-shift reports tell you what happened. iFactory's real-time dashboards give you the window to intervene while production is still running. The difference is measurable in units recovered, faults responded to faster, and supervisor hours freed from report compilation.
iFactory vs Competing Real-Time Production Monitoring Platforms
Production monitoring platforms range from basic shopfloor displays to full multi-role analytics suites. The critical differentiator is whether the system captures data automatically from PLCs or depends on operator entry, and whether it delivers genuinely role-specific views or a single generic dashboard for all users. Book a demo to see iFactory compared to your current monitoring approach.
| Capability | iFactory | QAD Redzone | Evocon | Mingo Smart Factory | VersaCall | L2L (Leading2Lean) | Tulip | WorkClout |
|---|---|---|---|---|---|---|---|---|
| Data Collection | ||||||||
| Automatic PLC data capture (no operator entry) | Full automatic, all machine states | Operator tablet entry primary | PLC integration available | PLC integration available | Andon system, operator-triggered | Operator-reported primary | Configurable, manual or sensor | Mobile operator entry |
| Sub-second data refresh rate from PLC | Sub-second, PLC-sourced | Operator entry lag | Near real-time | Near real-time | Andon signal latency | Minutes lag | Configurable | Minutes lag |
| Dashboard Capability | ||||||||
| 5 role-specific simultaneous dashboard views | Operator, Supervisor, Manager, Maintenance, Quality | Operator and supervisor focus | OEE-focused, limited roles | Configurable role views | Andon display only | Operator and supervisor | Configurable | Mobile-first, limited roles |
| Predictive AI alerts integrated with monitoring | Full predictive AI in same platform | Reactive monitoring only | Reactive monitoring only | Reactive monitoring only | Reactive only | Reactive only | Reactive only | Reactive only |
| On-premise deployment (no cloud data) | Full on-premise | Cloud SaaS | Cloud SaaS | Cloud SaaS | Cloud SaaS | Cloud SaaS | Cloud SaaS | Cloud SaaS |
Based on publicly available product documentation as of Q1 2025. Verify capabilities with each vendor before procurement decisions.
Regional Compliance: Production Data, Monitoring Records, and Data Residency
Real-time production monitoring generates continuous production records that are subject to regulatory requirements in pharmaceutical, food, automotive, and other regulated manufacturing sectors. iFactory's on-premise architecture ensures all production data remains within your facility and jurisdiction, satisfying data residency requirements by architecture.
| Region | Production Monitoring and Data Requirements | iFactory Compliance Coverage |
|---|---|---|
| USA | FDA 21 CFR Part 11 electronic production records with audit trail for pharmaceutical and food manufacturers. IATF 16949 production monitoring evidence for automotive suppliers. OSHA recordkeeping for production incident data. SEC production data for public company disclosures. | FDA 21 CFR Part 11 compliant electronic production records with immutable audit trail. IATF 16949 OEE and production monitoring records. OSHA incident data from work order system. All data on-premise within US jurisdiction. |
| UAE | UAE ESMA industrial product certification requires production quality monitoring evidence. ADNOC production performance records for oil and gas facilities. MOHAP GMP production monitoring records for pharmaceutical manufacturers. UAE data localization requirements for industrial data. | UAE ESMA production quality monitoring records. ADNOC production performance evidence. MOHAP GMP real-time production records. UAE data localization satisfied by on-premise architecture. Arabic platform interface. All data on-premise within UAE. |
| UK | MHRA GMP real-time production monitoring for pharmaceutical batch manufacturing. IATF 16949 for automotive tier suppliers. UK GDPR for production data processing. Made Smarter UK digital manufacturing grants require OEE monitoring evidence. PUWER 1998 machine monitoring records. | MHRA GMP real-time production records with audit trail. IATF 16949 OEE monitoring evidence. UK GDPR compliant on-premise data processing. Made Smarter OEE baseline evidence. PUWER machine monitoring records. All data within UK jurisdiction. |
| Canada | Health Canada GMP real-time production monitoring for pharmaceutical manufacturers. IATF 16949 for Ontario and Quebec automotive suppliers. PIPEDA data residency for production records. Statistics Canada manufacturing productivity reporting requirements. | Health Canada GMP real-time production records. IATF 16949 OEE monitoring. PIPEDA compliant on-premise data residency. Statistics Canada productivity data. Bilingual EN/FR reporting for Quebec. All data on-premise within Canada. |
| Germany / EU | EMA GMP real-time production monitoring for pharmaceutical manufacturers. IATF 16949 and VDA standards for automotive tier suppliers. GDPR requires all production data processing to comply with data minimization and residency. EU CSRD production output and efficiency reporting. | EMA GMP real-time production records with immutable audit trail. IATF 16949 and VDA OEE monitoring evidence. GDPR compliant on-premise data processing. EU CSRD production efficiency data. EU data residency guaranteed. All data within EU jurisdiction. |
| Australia | TGA GMP real-time production monitoring for pharmaceutical manufacturers. FSANZ for food and beverage production monitoring. WHS Regulations for machine monitoring records. AMP Advanced Manufacturing Fund requires production monitoring capability evidence for grants. | TGA GMP real-time production records. FSANZ food safety production monitoring. WHS machine monitoring records. AMP production monitoring capability evidence. Australian Privacy Act compliant on-premise data. All data within Australia. |
Frequently Asked Questions
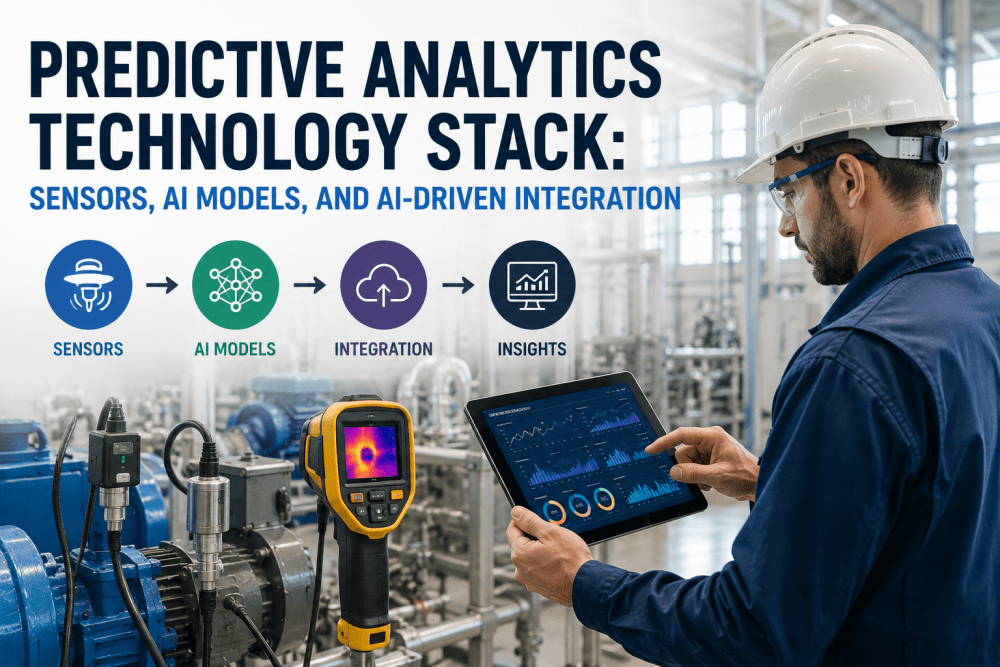
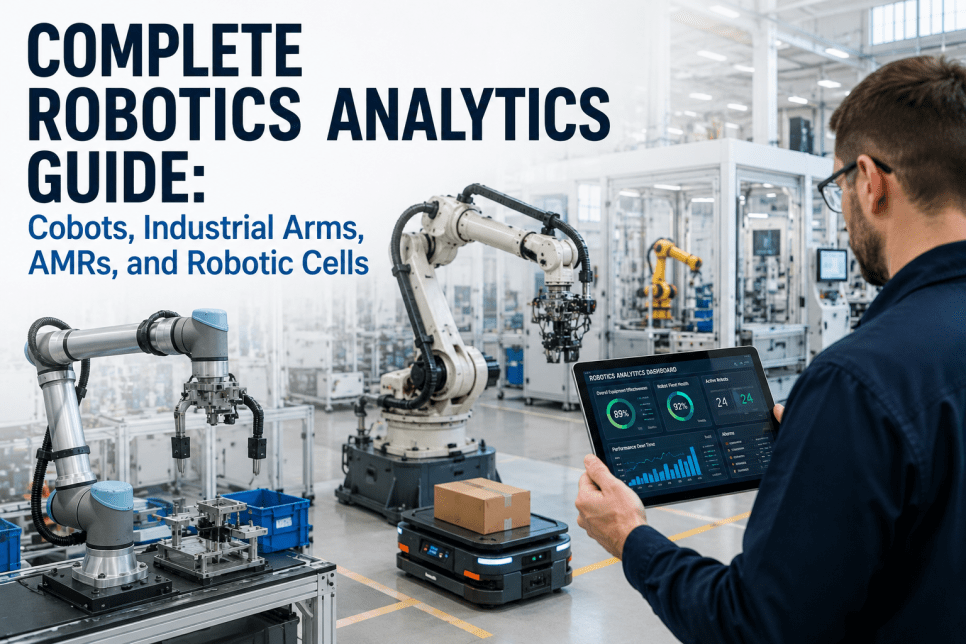
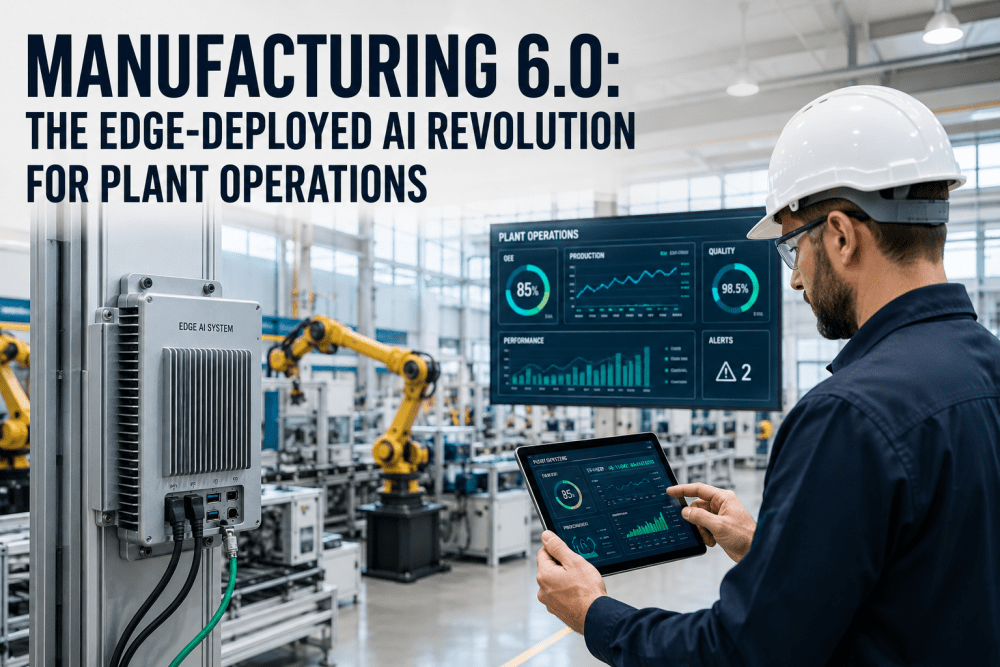
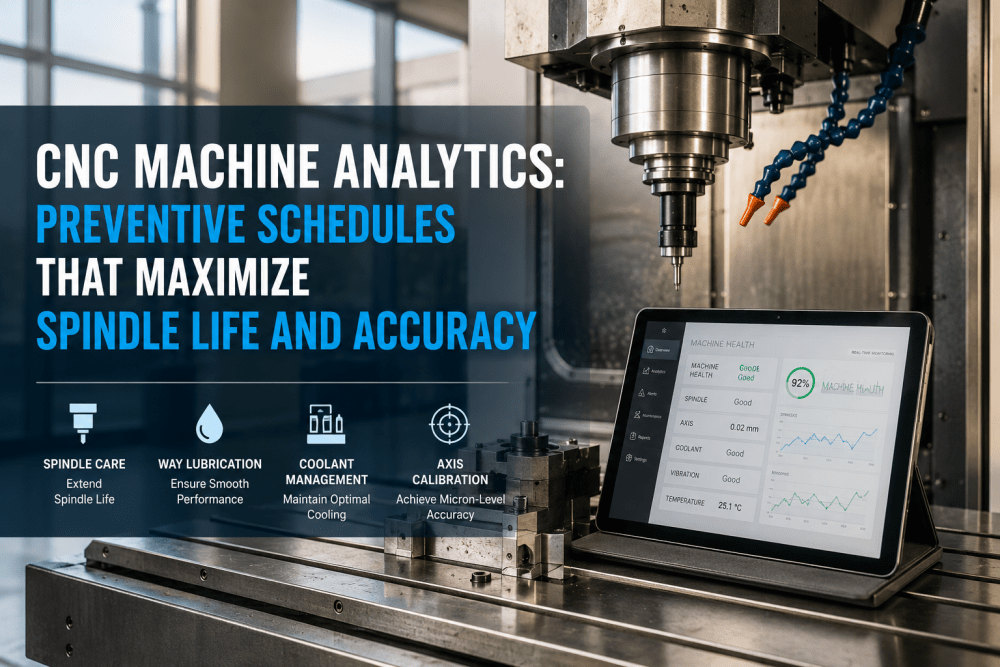
Continue Reading
Five simultaneous role-based dashboards from one PLC data connection. No manual data entry. No end-of-shift log compilation. Sub-second data latency from every machine in your plant, displayed on any device, on-premise with no cloud dependency.