Most manufacturing plants have a downtime problem and a data problem simultaneously. The downtime events happen. The result is a downtime Pareto that shows the same top three causes month after month, with action plans that address symptoms rather than root causes, because the data is not granular enough, not timely enough, and not connected to the equipment signals that would reveal the actual failure mechanism. iFactory's AI-powered downtime tracking platform eliminates the data problem entirely: every stoppage is automatically captured from your PLC at the moment it occurs, categorized against the Six Big Loss framework, correlated with process parameters, and presented in a Pareto that is ready for root cause action within minutes of the event. Book a free downtime analysis demonstration for your plant.
iFactory's downtime tracking software automatically captures every stoppage event from your PLC and SCADA at the moment it occurs, categorizes it against the Six Big Loss framework without operator input, correlates it with process parameter data to identify root causes, and generates a real-time Pareto analysis by machine, shift, product, and fault code. Every downtime event is connected to a work order, and every work order outcome feeds back to improve future categorization accuracy.
From Raw PLC Signal to Actionable Downtime Intelligence: The 4-Layer Process
Effective downtime tracking is not about recording stoppages. It is about converting PLC fault signals into structured intelligence that drives specific maintenance and operational actions. iFactory processes downtime data through four sequential layers, each adding a level of analytical value that the previous layer cannot provide alone. Book a demo to see all four layers configured for your production lines.
Every downtime event triggers a condition-based work order in your CMMS with the fault category, recommended repair action, and parts pre-staged. Root cause analysis is auto-populated from correlated process data. Prevention rules are updated to catch the same pattern earlier next time.
Categorized downtime events are aggregated into real-time Pareto by machine, shift, operator, product, and fault code. Trend analysis identifies whether frequency and duration are improving or deteriorating. Correlation analysis connects downtime events to upstream process parameter deviations that preceded them.
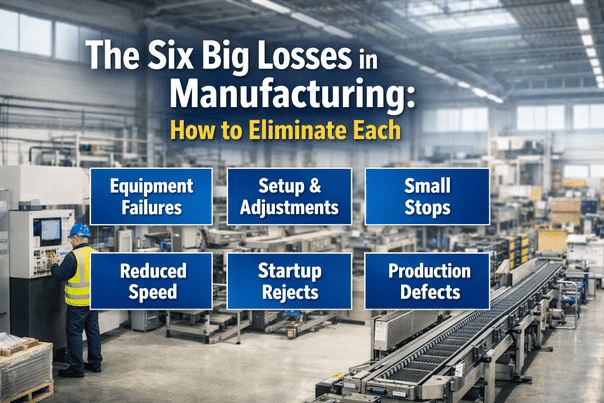
Raw stop signals are classified automatically into Six Big Loss categories: Equipment Failures (L1), Setups and Adjustments (L2), Minor Stoppages (L3), Reduced Speed (L4), Process Defects (L5), and Reduced Yield (L6). Each event is tagged with shift, operator, product code, and machine state at time of stop.
Every machine state transition is captured from your PLC in real time via OPC-UA or Modbus. Run, fault, idle, changeover, and scheduled stop states are detected automatically with millisecond timestamp precision. No operator input required. No end-of-shift downtime logs. No missed events.
Six Big Loss Categorization: How iFactory Classifies Every Downtime Event
The Six Big Losses framework (from TPM methodology) provides the most comprehensive and internationally standardized categorization structure for manufacturing downtime. iFactory maps every PLC stop event to one of the six categories automatically, without any operator input, using machine state, duration, and fault code correlation rules that are configured during deployment.
From PLC fault signal to categorized Six Big Loss event to real-time Pareto, all without a single operator entry or end-of-shift downtime log. First automated downtime Pareto available within 24 hours of PLC connection.
iFactory Downtime Pareto: What Your Current System Shows vs What iFactory Shows
The quality of a downtime Pareto is entirely determined by the quality of the underlying data. Manual downtime logging typically captures 60 to 70 percent of actual downtime events, misclassifies 30 to 40 percent of captured events, and misses virtually all minor stoppages under 10 minutes. The difference between a manual Pareto and an iFactory Pareto is not cosmetic. It is the difference between acting on accurate data and acting on a partial record.
- 60 to 70% of events captured (operator-dependent)
- Minor stoppages under 10 minutes almost never recorded
- Fault categories selected from operator memory, not machine data
- End-of-shift entry means event details are already forgotten
- No correlation with process parameters at time of stop
- Pareto shows the same top 3 causes month after month
- Action plans address operator-perceived causes, not actual root causes
- Reporting takes 2 to 4 hours of supervisor time per week
- 100% of events captured from PLC at millisecond precision
- Minor stoppages under 5 seconds captured and counted
- Fault categories mapped from actual fault codes, not operator memory
- Event data recorded at the moment of occurrence, not hours later
- Every downtime event correlated with 200+ process parameters
- Pareto changes as new patterns are detected in real time
- Action plans linked to validated root cause evidence from process data
- Downtime Pareto updated continuously with zero supervisor effort
Implementation Roadmap: PLC Connection to Full Downtime Analytics in 4 Weeks
iFactory's downtime tracking deployment does not require replacing your existing CMMS or MES. It connects to your PLC, reads from your ERP, and enriches your existing maintenance management system with real-time automated downtime data. Book a demo to review the deployment timeline for your specific PLC types and CMMS.
Every PLC fault code is mapped to a Six Big Loss category. Machine state signals (run, fault, idle, changeover) are documented and validated. Ideal cycle times are set per product code from ERP or iFactory product master.
iFactory connects to production PLCs via OPC-UA or Modbus in read-only mode. First 48 hours of automated downtime capture validated against floor observations. Categorization accuracy confirmed before go-live.
iFactory REST API connected to your existing CMMS. Work order auto-generation rules configured per fault category and severity threshold. Maintenance team trained on alert response and work order approval workflow.
Real-time downtime Pareto active for all connected machines. Shift-level, machine-level, and product-level downtime reports replacing manual end-of-shift logs. Management dashboard shows live OEE contribution from each loss category.
Client Results: Plants Using iFactory for Downtime Tracking
Average ratio of events captured by iFactory compared to the prior manual downtime logging system, driven by automatic minor stoppage capture under 10 minutes.
Average OEE improvement in the 12 months following iFactory downtime tracking deployment, measured from the pre-deployment baseline established during PLC mapping week.
Manual downtime logging forms and end-of-shift downtime entry eliminated from day one of iFactory deployment. Operators focus on production, not paperwork.
Time from PLC connection to first valid automated downtime Pareto for connected machines, including Six Big Loss categorization and shift attribution.
Average reduction in minor stoppage frequency within 6 months once iFactory reveals the full minor stoppage Pareto for the first time, enabling targeted intervention at the highest-frequency causes.
Average reduction in supervisor time spent compiling downtime reports, preparing weekly review decks, and chasing operators for downtime reason codes per production line per week.
Minor stoppages under 10 minutes represent an average of 22 percent of OEE loss in manufacturing plants, yet they are almost never captured in manual downtime systems. iFactory shows you the complete downtime picture for the first time, often revealing that the highest-impact improvement opportunity is something entirely unexpected.
iFactory vs Competing Downtime Tracking Software Platforms
Downtime tracking software ranges from basic manual entry tools to fully automated PLC-connected systems. The critical differentiator is not the reporting interface. It is whether the system captures downtime automatically from machine signals or depends on operator entry for the underlying data. Book a demo to see iFactory's automated tracking compared to your current system.
| Capability | iFactory | QAD Redzone | Evocon | Mingo Smart Factory | L2L (Leading2Lean) | Tulip | Plex Mfg Cloud | SafetyCulture |
|---|---|---|---|---|---|---|---|---|
| Data Collection Method | ||||||||
| Automatic PLC downtime capture (no operator entry) | Full automatic from PLC | Operator tablet entry | PLC integration available | PLC integration available | Operator-initiated | Manual or sensor | ERP and MES sourced | Manual inspection entry |
| Minor stoppage capture (under 10 minutes) | All stoppages, any duration | Operator-reported only | PLC-connected captures all | PLC-connected captures all | Not typically captured | Configurable | Via MES integration | No |
| Analysis and Intelligence | ||||||||
| Six Big Loss auto-categorization | Fully automatic from PLC signals | Operator selects reason code | Configurable auto-rules | Partial | Partial | Configurable | Via MES | No OEE framework |
| Process parameter correlation with downtime events | 200+ parameters correlated per event | No process correlation | Limited | Limited | No | Via integrations | Via ERP data | No |
| Auto-generates CMMS work order from downtime event | Automatic, fault type pre-diagnosed | Alert-based, not auto WO | Alert-based | Alert-based | L2L work order native | Via integrations | Via ERP WO module | No |
| Architecture and Security | ||||||||
| On-premise deployment (no cloud data transfer) | Full on-premise | Cloud SaaS | Cloud SaaS | Cloud SaaS | Cloud SaaS | Cloud SaaS | Cloud SaaS | Cloud SaaS |
| Predictive failure detection alongside downtime tracking | Full predictive AI integrated | Reactive tracking only | Reactive tracking only | Reactive tracking only | Reactive tracking only | Reactive tracking only | Reactive tracking only | Reactive only |
Based on publicly available product documentation as of Q1 2025. Verify capabilities with each vendor before procurement decisions.
Regional Compliance: Downtime Data, Records, and Reporting Requirements
Downtime tracking data is increasingly subject to regulatory requirements across manufacturing sectors and regions, particularly for production quality records, equipment maintenance documentation, and environmental reporting where production interruptions may trigger reporting obligations. iFactory's on-premise architecture keeps all downtime and production data within your facility and jurisdiction.
| Region | Downtime Data and Records Requirements | Applicable Standards | iFactory Compliance Coverage |
|---|---|---|---|
| USA | FDA 21 CFR Part 11 requires electronic production records with audit trail for pharmaceutical and food manufacturers. IATF 16949 requires production downtime analysis and OEE measurement for automotive tier suppliers. OSHA PSM requires mechanical integrity maintenance records for hazardous chemical plants. | FDA 21 CFR Part 11, IATF 16949, ISO 9001, OSHA PSM 1910.119, EPA RMP, NIST 800-82 | FDA 21 CFR Part 11 electronic records with immutable audit trail. IATF 16949 OEE and downtime analysis records. OSHA PSM maintenance records from auto-generated work orders. All data on-premise within US jurisdiction. |
| UAE | ADNOC HSEMS requires equipment performance and downtime records for oil and gas facilities. UAE ESMA production quality records required for industrial product certification. MOHAP GMP requires batch production records with equipment status documentation for pharmaceutical manufacturers. Dubai Municipality food safety records for food and beverage plants. | ADNOC HSEMS, UAE ESMA, MOHAP GMP, Dubai Municipality, ISO 9001, ISO 22000 | ADNOC HSEMS equipment performance records with immutable audit trail. UAE ESMA production quality documentation. MOHAP GMP batch production records with equipment status. Arabic platform support. All data on-premise within UAE. |
| UK | PUWER 1998 requires records of maintenance work on work equipment. MHRA GMP requires production batch records with equipment status and downtime documentation for pharmaceutical manufacturers. IATF 16949 for automotive tier suppliers. HSE COMAH requires maintenance records for hazardous sites. | PUWER 1998, MHRA GMP, IATF 16949, HSE COMAH, ISO 9001, UK GDPR | PUWER maintenance work records with timestamp and technician attribution. MHRA GMP batch production records with equipment downtime documentation. COMAH maintenance records from work order system. All data on-premise within UK. |
| Canada | Health Canada GMP requires production and equipment records for pharmaceutical manufacturers including downtime and maintenance events. IATF 16949 for Ontario and Quebec automotive suppliers. Provincial OHSA requires equipment maintenance records. PIPEDA data residency requirements for production records. | Health Canada GMP, IATF 16949, ISO 9001, Provincial OHSA, PIPEDA | Health Canada GMP production and equipment event records. IATF 16949 OEE and downtime documentation. OHSA equipment maintenance records from work order system. PIPEDA-compliant on-premise data. Bilingual EN/FR support for Quebec. |
| Germany / EU | BetrSichV requires records of maintenance work on pressure equipment and work equipment. EMA GMP for pharmaceutical manufacturers. IATF 16949 and VDA standards for automotive tier suppliers. GDPR requires all production data processing to comply with data minimization and residency principles. EU NIS2 for critical manufacturing OT systems. | BetrSichV, EMA GMP, IATF 16949, VDA, GDPR, EU NIS2, IEC 62443 | BetrSichV maintenance records with immutable audit trail. EMA GMP production and equipment records. IATF 16949 and VDA OEE and downtime documentation. GDPR-compliant on-premise processing. EU data residency guaranteed. NIS2 OT security controls. |
| Australia | WHS Regulations require records of inspections and maintenance of plant and equipment. TGA GMP for pharmaceutical manufacturers including equipment and production records. FSANZ for food manufacturers. Australian Privacy Act for production data. SOCI Act operational records for critical infrastructure facilities. | WHS Regulations, TGA GMP, FSANZ, ISO 9001, Australian Privacy Act, SOCI Act | WHS plant inspection and maintenance records. TGA GMP equipment and production records. FSANZ food safety production documentation. SOCI Act operational records. Australian Privacy Act compliant on-premise data. All data within Australia. |
Frequently Asked Questions
Continue Reading
Automatic Six Big Loss categorization. Real-time Pareto by machine, shift, and product. CMMS work order auto-generation. On-premise architecture with zero cloud data transfer. First automated downtime Pareto available within 24 hours of PLC connection.