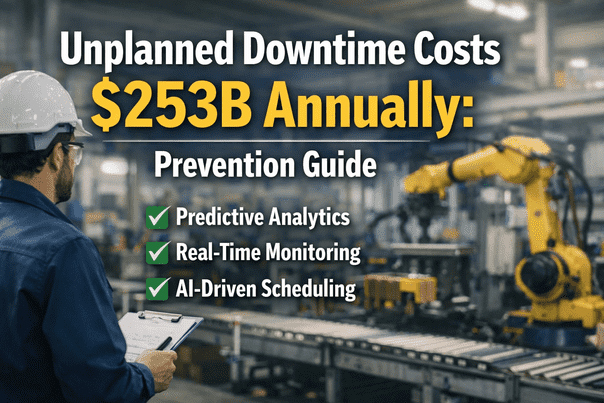
Unplanned downtime costs manufacturers $253 billion every year, according to Siemens and Aberdeen Group research, yet the majority of those stoppages are not random events. The manufacturers who have reduced unplanned stops by 40 to 60 percent have not changed their equipment. They changed their information: they replaced threshold alarms that react to failures with AI-driven early-warning systems that detect failure signatures 48 to 96 hours before a forced stop. This article documents the true cost of unplanned downtime by sector, the five root causes that drive 85 percent of all unplanned stops, and the iFactory implementation roadmap that converts reactive plants to predictive operations in under eight weeks. Book a free downtime cost assessment for your plant.
Unplanned downtime costs $253 billion annually across global manufacturing. The average manufacturer loses $532,000 per hour of unplanned downtime across all sectors, rising to $2.3M per hour in automotive and $1.8M per hour in semiconductor fabrication. iFactory's AI-driven predictive maintenance platform detects the failure signatures responsible for 85% of unplanned stops between 48 and 96 hours in advance, converting reactive stoppages into planned, scheduled interventions with zero production interruption.
The Real Cost of Unplanned Downtime: Visible and Hidden
Every plant manager knows the visible cost of a downtime event. Very few have calculated the hidden cost, which research consistently shows is 3 to 5 times larger than the immediately visible figure. The two panels below show both categories. Book a demo to calculate your plant's true downtime cost with iFactory's cost model.
Downtime Cost per Hour by Manufacturing Sector
The cost of one hour of unplanned downtime varies dramatically by sector because it reflects the combination of output value, customer penalty exposure, and labor intensity. The direct loss figures below represent production loss only: hidden costs add 3 to 5 times these amounts.
| Manufacturing Sector | Direct Loss per Hour | True Cost per Hour (with Hidden) | Primary Downtime Driver | iFactory Prevention Mechanism |
|---|---|---|---|---|
| Automotive Assembly | $1.3M to $2.3M | $4M to $8M | Welding robot failures, conveyor trips, press downtime | Servo motor current analysis, press tonnage deviation detection, vibration on robot joints |
| Semiconductor Fab | $1.5M to $1.8M | $5M to $9M | Process tool failures, cleanroom utility faults, chiller trips | Sub-fab utility monitoring, chiller vibration and refrigerant pressure, process tool pump detection |
| Oil and Gas Processing | $800K to $1.5M | $3M to $6M | Compressor failures, pump cavitation, heat exchanger fouling | Compressor vibration and discharge temperature, pump suction pressure deviation, fouling index trending |
| Food and Beverage | $50K to $400K | $200K to $1.5M | Packaging line jams, CIP pump failures, filler valve faults | Packaging line minor stoppage analysis, CIP pump health monitoring, filler flow and pressure deviation |
| Pharmaceutical | $250K to $750K | $1M to $3M | HVAC failures, blending equipment trips, utility quality deviations | HVAC AHU performance monitoring, blending motor current, utility quality sensor integration |
| Steel and Metals | $100K to $700K | $400K to $2.8M | Rolling mill drive failures, hydraulic system trips, cooling system faults | Mill drive vibration and thermal monitoring, hydraulic pressure and contamination, cooling flow detection |
Cost estimates based on industry research from Siemens, Aberdeen Group, and MESA International. Hidden cost multiplier of 3 to 5x applied to direct loss figures.
iFactory's pre-deployment assessment uses your actual downtime history and production data to calculate sector-specific visible and hidden downtime cost for your plant, and maps each cost category to the specific iFactory detection mechanism that eliminates it.
The 5 Root Causes Behind 85% of All Unplanned Stoppages
Unplanned downtime is not uniformly distributed across failure modes. Research from MESA International and industry maintenance benchmarking consistently shows that five root cause categories account for 85 percent of all unplanned production stops. iFactory has a specific detection mechanism for each.
Bearing wear, seal failure, shaft imbalance, and misalignment account for the single largest share of unplanned stoppages across all manufacturing sectors. These failure modes develop over weeks and months and are detectable through vibration frequency analysis, temperature trending, and acoustic emission monitoring well before catastrophic failure.
Motor winding degradation, VFD overtemperature, contactor wear, and power quality issues collectively cause 22 percent of unplanned stoppages. Motor winding insulation failure is particularly insidious: the motor may pass all manual tests until the moment of catastrophic failure, yet shows a measurable current imbalance signature weeks in advance.
Hydraulic pump wear, valve spool erosion, seal degradation, and compressed air system failures cause 14 percent of unplanned stops. Hydraulic contamination is the leading cause within this category: particles above 15 microns in hydraulic fluid cause accelerated valve and pump wear that progresses to complete system failure within predictable timeframes.
Inadequate lubrication causes 11 percent of all unplanned stoppages and is the single most preventable failure category because it is entirely caused by maintenance program gaps rather than equipment aging. Centralized lubrication system failures, incorrect lubricant application intervals, and oil contamination cause bearing and gear failures that appear to be rotating equipment failures but are actually lubrication system failures.
Cooling system failures, compressed air quality degradation, and steam system faults cause 6 percent of unplanned stoppages but are disproportionately damaging because they cause simultaneous multi-machine stops rather than single-asset failures. A chiller trip can stop an entire production floor in minutes.
iFactory Prevention Roadmap: From Reactive to Predictive in 6 Weeks
The transition from reactive to predictive maintenance does not require replacing your PLCs, DCS, or existing maintenance management system. iFactory connects to what you have, learns from your historical failure data, and starts predicting before the first planned maintenance window closes. Book a demo to see the roadmap configured for your asset mix and sector.
iFactory engineers review 12 to 24 months of downtime records, maintenance work orders, and production loss logs. Every asset is ranked by downtime cost contribution. The top 20 percent of assets causing 80 percent of downtime loss are prioritized for immediate sensor coverage.
Wireless vibration, temperature, and current sensors deployed on priority assets. PLC and SCADA data feeds connected via OPC-UA or Modbus in read-only mode. Historian data synchronized. No control system changes, no production interruption, no firewall modifications to OT networks.
iFactory AI models trained against your specific failure history and normal operating patterns. Baseline established per asset per operating mode. False alarm thresholds calibrated to your maintenance team's response capacity. Every model validated against at least one known historical failure event before activation.
Predictive alert system goes live. Every alert auto-generates a condition-based work order in your CMMS with pre-diagnosed fault type, recommended parts, and priority level. Maintenance planners receive scheduled interventions instead of emergency call-outs. OEE monitoring tracks improvement in real time from this point forward.
Client Results: Downtime Reduction with iFactory
Average reduction in unplanned stoppage frequency within 12 months of iFactory deployment, measured against the 12-month pre-deployment baseline for each plant.
Average annual avoided downtime cost per plant across the iFactory installed base, including direct production loss, emergency repair premium, and schedule recovery cost avoided.
Average lead time from first iFactory predictive alert to planned maintenance intervention, across all asset classes in the monitoring portfolio.
Percentage of iFactory predictive alerts confirmed as genuine degradation events during maintenance inspection. False alarm rate under 7 percent across all monitored asset classes.
From project kick-off to first live predictive alert issued to the maintenance team, including sensor deployment, PLC integration, and AI model calibration for the priority asset group.
Average planned maintenance ratio achieved within 12 months of iFactory deployment, up from an industry average starting point of 45 to 55 percent planned.
The failure signatures behind your next unplanned stoppages are detectable right now from your existing PLC and sensor data. iFactory connects in read-only mode to what you already have and shows you those signatures before they become production losses.
iFactory vs Competing Downtime Prevention Platforms
Multiple platforms claim to reduce unplanned downtime. The critical differentiators are whether they detect failure signatures from your actual production data automatically, whether they deploy on-premise without cloud data dependency, and whether they integrate with your existing PLC and CMMS without replacing them. Book a demo to see iFactory mapped against your current platform.
| Capability | iFactory | TRACTIAN | Augury | Siemens Insights Hub | C3 AI Manufacturing | Fiix (Rockwell) | MaintainX | Limble CMMS |
|---|---|---|---|---|---|---|---|---|
| Failure Detection Capability | ||||||||
| Predictive failure detection from PLC data | Full PLC and sensor AI | Sensor-only, no PLC | Sensor-only, no PLC | PLC integration available | Data science models, not auto | CMMS only, no prediction | No predictive capability | No predictive capability |
| Advance warning lead time | 48 to 96+ hours average | Hours to days | Hours to days | Varies by model | Varies by deployment | Reactive only | Reactive only | Reactive only |
| All 5 root cause categories covered | Rotating, electrical, hydraulic, lubrication, utilities | Rotating equipment only | Rotating equipment primary | Rotating and electrical | Configurable | No detection | No detection | No detection |
| Deployment and Architecture | ||||||||
| On-premise deployment (no cloud data) | Full on-premise | Cloud SaaS | Cloud SaaS | Cloud or hybrid | Cloud only | Cloud SaaS | Cloud SaaS | Cloud SaaS |
| Auto-generates CMMS work order on alert | Condition-based WO, auto | Alert notification only | Alert notification only | Via SAP PM integration | Configurable | WO management native | WO management native | WO management native |
| Deployment timeline to first alert | 6 weeks | 4 to 8 weeks (sensor only) | 8 to 16 weeks | 3 to 12 months | 6 to 18 months | 4 to 8 weeks (CMMS only) | 2 to 6 weeks (CMMS only) | 2 to 4 weeks (CMMS only) |
Based on publicly available product documentation as of Q1 2025. Verify capabilities with each vendor before procurement decisions.
Regional Compliance: Downtime Prevention and Reporting Requirements
Unplanned downtime in regulated manufacturing sectors carries compliance consequences beyond production loss. Safety incidents during uncontrolled failure events, environmental releases from process upsets, and food safety deviations from utility failures all create regulatory reporting obligations. iFactory's on-premise architecture ensures all production and maintenance data remains within your facility and jurisdiction.
| Region | Downtime-Related Compliance Obligations | Regulatory Risk from Unplanned Stops | iFactory Compliance Coverage |
|---|---|---|---|
| USA | OSHA PSM for hazardous chemical plants, FDA 21 CFR Part 110 and 211 for food and pharma, EPA RMP for chemical release risk, OSHA 300 log recordkeeping for injury events during unplanned stops | OSHA PSM citations for inadequate mechanical integrity programs. EPA RMP violation for uncontrolled process release. FDA consent decree risk for repeat production failures in pharmaceutical GMP facilities. | OSHA PSM mechanical integrity records auto-generated. FDA GMP production event logging with immutable audit trail. EPA RMP process upset monitoring. All data on-premise within US jurisdiction. |
| UAE | ADNOC HSE standards for equipment integrity in oil and gas, UAE ESMA production quality standards, Dubai Municipality food safety regulations, MOHAP Good Manufacturing Practice for pharmaceutical plant stoppages | ADNOC audit findings for inadequate equipment condition monitoring programs. ESMA product quality non-conformance from unplanned downtime. MOHAP GMP non-compliance for pharmaceutical process interruptions. | ADNOC HSE equipment integrity records and inspection logs. UAE ESMA production quality data with audit trail. MOHAP GMP event logging. Arabic platform support. All data on-premise within UAE. |
| UK | PSSR 2000 for pressure equipment, PUWER 1998 maintenance records, HSE COMAH for hazardous sites, MHRA GMP for pharmaceutical manufacturing stoppages | HSE enforcement notice for inadequate PSSR compliance. COMAH prosecution for major accident from inadequate equipment integrity. MHRA GMP non-compliance for pharmaceutical production interruptions without proper investigation records. | PSSR and PUWER maintenance records with immutable audit trail. COMAH mechanical integrity monitoring evidence. MHRA GMP production event logging. All data on-premise within UK jurisdiction. |
| Canada | OHSA provincial requirements for equipment mechanical integrity, Health Canada GMP for pharmaceutical production interruptions, ECCC reporting for environmental releases from uncontrolled process upsets | Provincial OHSA orders for inadequate equipment maintenance records. Health Canada GMP non-compliance for pharmaceutical production interruptions. ECCC reporting obligations triggered by environmental releases during uncontrolled shutdowns. | Provincial OHSA mechanical integrity records. Health Canada GMP production and maintenance logging. ECCC environmental monitoring from process sensors. Bilingual EN/FR reporting support. All data on-premise within Canada. |
| Germany / EU | BetrSichV (Industrial Safety Regulation) for pressure equipment inspection records, EU Machinery Directive maintenance documentation, GDPR for production data privacy, EU NIS2 for critical manufacturing OT security | BetrSichV violation for missing pressure equipment inspection records. EU Machinery Directive non-compliance for inadequate equipment maintenance documentation. NIS2 OT security incident reporting for cyber-related production stoppages. | BetrSichV inspection records with immutable audit trail. EU Machinery Directive maintenance documentation. GDPR-compliant on-premise data processing. NIS2 OT security event logging. EU data residency guaranteed. |
| Australia | WHS Act and Regulations for equipment maintenance and hazardous plant, Australian Standard AS 3788 for pressure equipment inspection, FSANZ for food manufacturing, TGA GMP for pharmaceutical, SOCI Act for critical infrastructure resilience | WHS regulator enforcement for inadequate hazardous plant maintenance records. AS 3788 non-compliance for pressure equipment inspection gaps. SOCI Act reporting obligation for significant operational disruption at critical infrastructure facilities. | WHS hazardous plant inspection records. AS 3788 pressure equipment evidence. FSANZ food safety production monitoring. TGA GMP records. SOCI Act operational resilience evidence. All data on-premise within Australia. |
Frequently Asked Questions
Continue Reading
Connect to your PLCs, SCADA, and historian in read-only mode. No control system changes. No cloud dependency. First predictive alert within the first week of go-live. On-premise architecture satisfies ISO, OSHA, FDA, ADNOC, and GDPR requirements from day one.