Before any plant manager signs off on a predictive maintenance platform, they need a number. Not a brochure claim. A number specific to their plant, their failure history, their downtime cost per hour, and their current maintenance spend. This page builds that number transparently, category by category, using the four sources of measurable return that iFactory delivers across every manufacturing plant deployment: avoided unplanned downtime, reduced reactive maintenance labor and parts cost, energy optimization savings, and compliance audit cost elimination. The same financial model that iFactory presents in pre-deployment assessments is documented here so your team can run the calculation against your own cost data before any sales conversation. Book a free ROI assessment with your plant's actual cost data today.
iFactory generates return across four measurable categories: unplanned downtime elimination (typically $500K to $4M+ per year depending on plant size and downtime cost per hour), reactive-to-predictive maintenance cost shift (22 to 35 percent of total maintenance spend), energy waste reduction (compressed air, motor efficiency, boiler fuel: $40K to $200K per year), and compliance audit cost elimination ($50K to $200K per year in preparation and penalty avoidance). Combined payback period across deployments: 30 to 60 days in the majority of plants.
The 4 ROI Categories: Where iFactory Delivers Measurable Return
Every dollar of return from a predictive maintenance platform comes from one of four categories. iFactory tracks and reports return from all four separately, so your finance team can attribute savings to specific maintenance events and equipment categories rather than treating PdM ROI as a single unverifiable claim. Book a demo to see the four-category ROI model applied to your plant's cost structure.
The largest ROI category for most manufacturing plants. Every prevented unplanned equipment failure that would have caused a production line stoppage generates a return equal to the downtime cost per hour multiplied by the hours avoided. iFactory's 94 percent fault detection accuracy and 14 to 90 day advance warning window converts most imminent failures into planned maintenance events during scheduled downtime windows, eliminating the production loss entirely.
Emergency reactive maintenance costs 3 to 5 times more than planned predictive maintenance for the same repair. Emergency labor premium, expedited parts shipping, secondary damage from running to failure, and the higher cost of forced replacement versus condition-based repair all contribute to the cost differential. iFactory shifts the maintenance program from calendar-based and reactive to condition-based, eliminating the emergency premium across the entire monitored asset population.
Energy waste in manufacturing is systematic and measurable: compressed air leaks consuming 25 to 35 percent of compressor output, motors running in degraded efficiency states, boiler combustion drifting from optimum excess air ratio, and hydraulic systems operating above necessary pressure. iFactory identifies and quantifies each energy waste source continuously, generating optimization recommendations with dollar values attached to each recommendation so the maintenance team can prioritize by financial impact.
Manufacturing plants subject to OSHA PSM, PSSR, ISO 55001, ADNOC, or other statutory maintenance documentation requirements spend significant labor hours manually compiling inspection records before each audit. iFactory's immutable audit trail provides the complete inspection evidence package in seconds rather than days, eliminating the pre-audit labor cost and reducing the risk of documentation gaps that create non-conformance findings and penalty exposure.
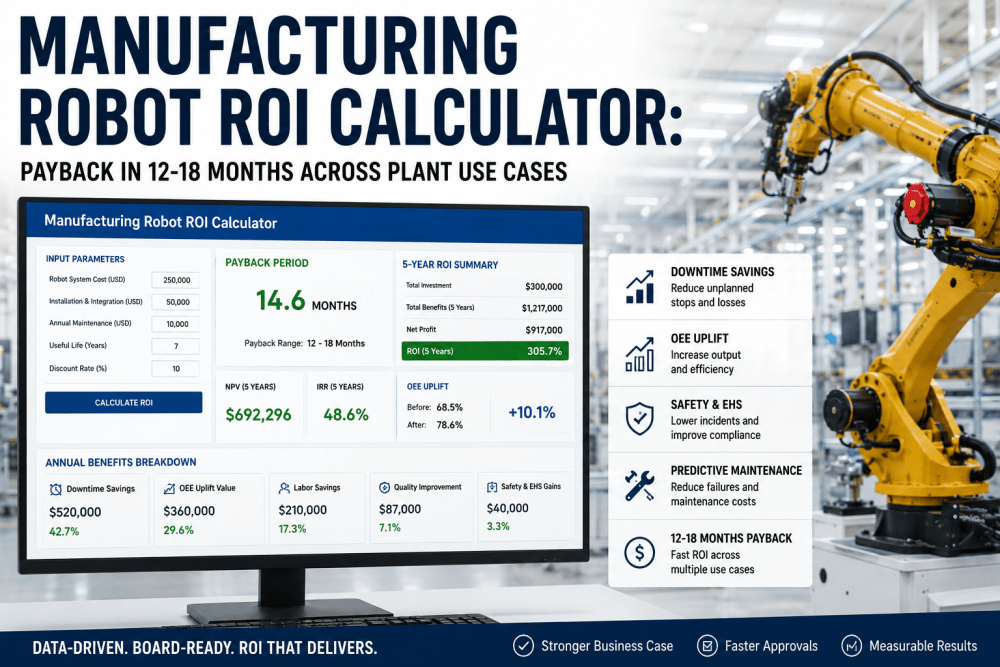
Three Plant Scenarios: Worked ROI Calculations
The three scenarios below represent typical manufacturing plant configurations. Match your plant to the closest scenario to estimate your iFactory return, then book an assessment to refine the numbers against your actual cost data.
iFactory's pre-deployment assessment builds a plant-specific ROI model from your downtime history, maintenance spend breakdown, energy bills, and compliance audit records. The output is a single-page investment case your finance team can approve, built before any platform commitment is required.
The Payback Timeline: How iFactory Delivers Return in the First 90 Days
ROI from iFactory does not arrive at the end of year one. Different return categories deliver at different points in the deployment timeline. Understanding the payback sequence shows why most plants achieve full ROI well within the first quarter of deployment.
Compressed air leak mapping generates the first energy savings within 24 hours of ultrasonic sensor deployment. Compressor scheduling optimization delivers its first savings within the first week as the AI demand model begins generating scheduling recommendations. These energy savings alone often cover a significant portion of the deployment cost within the first month.
First predictive alerts activate after the 7 to 21 day baseline learning period. Condition-based work orders replace calendar-based PM tasks for monitored assets. Labor and parts are redirected from scheduled but unnecessary PM activities to condition-triggered interventions, reducing total maintenance labor hours for the same asset population from the first month.
The highest-value return category typically delivers its first event within the first 90 days of deployment. For most plants, at least one developing fault is detected in the baseline learning period that would have caused an unplanned stoppage within the next 30 to 90 days. A single prevented failure on a production-critical asset often covers the complete deployment cost of the entire iFactory program for 12 months.
From month 3, all four return categories are running simultaneously. Each work order completed feeds back into the AI model. Each quarter's energy billing shows the compression in compressor cost. Each statutory audit cycle eliminates the pre-audit preparation cost. The ROI multiple grows continuously as the platform learns more of the plant's failure history and the maintenance program becomes progressively more efficient.
iFactory vs Competing PdM Platforms: ROI Delivery Comparison
ROI from a predictive maintenance platform is directly limited by which equipment categories it can monitor, how quickly it deploys, and whether it generates automatic work orders or only alerts. Platforms that cover only vibration or only CMMS generate a fraction of the ROI that iFactory's five-sensor, four-category model delivers. Book a demo to see iFactory's ROI model compared against your current platform investment.
| ROI Driver | iFactory | TRACTIAN | Augury | MaintainX | Fiix (Rockwell) | Siemens Insights Hub | Limble CMMS | C3 AI Mfg |
|---|---|---|---|---|---|---|---|---|
| ROI Category 1: Downtime Elimination | ||||||||
| Multi-equipment predictive failure alerts | All equipment types: rotating, electrical, fluid | Rotating equipment only | Rotating equipment only | No predictive layer | No predictive layer | Via connected assets | No predictive layer | Via custom models |
| Warning horizon for planned intervention | 14-90 days for most fault types | Days to 2 weeks typical | Days to 2 weeks typical | Reactive only | Reactive only | Varies by asset | Reactive only | Varies |
| ROI Category 2 and 3: Maintenance Cost and Energy | ||||||||
| Condition-based maintenance (replaces calendar PM) | Auto work orders replace calendar tasks | Alert triggers manual WO | Alert triggers manual WO | Yes (calendar-based) | Yes (calendar-based) | Via SAP PM | Yes (calendar-based) | Via CMMS |
| Energy optimization analytics (compressed air, motors, boilers) | All 3 energy systems monitored | No | No | No | No | Via Siemens energy mgmt | No | Via models |
| ROI Category 4: Compliance and Deployment Speed | ||||||||
| Auto compliance audit trail (eliminates prep cost) | Immutable trail for all major standards | No compliance module | No compliance module | Basic records | Basic records | Via SAP GRC | Basic records | No |
| Deployment to first ROI (weeks to first prevented failure) | 14-21 days to first actionable alerts | 4-8 weeks | 6-12 weeks | Days (CMMS only) | Days (CMMS only) | 3-6 months | Days (CMMS only) | 6-12 months |
Based on publicly available documentation as of Q1 2025. Verify capabilities with each vendor before procurement decisions.
Regional Compliance: How Compliance ROI Varies by Region
The compliance cost elimination ROI category varies significantly by region based on the mandatory documentation requirements and penalty exposure for non-compliance. Plants in regions with statutory maintenance documentation obligations see higher compliance ROI from iFactory's automated audit trail.
| Region | Key Standards Requiring Documentation | Typical Manual Audit Prep Cost | iFactory Compliance ROI |
|---|---|---|---|
| USA | OSHA PSM (29 CFR 1910.119) mechanical integrity records, EPA RMP documentation, NFPA 70B electrical inspection records, ISO 55001 audit evidence, OSHA recordkeeping (300 log) | PSM-covered plants: 200-600 labor hours per audit cycle at $85-$150/hour. Penalty exposure: $15,625 per willful violation per day. | Audit prep from 200 hours to under 2 hours. PSM mechanical integrity records generated automatically. OSHA citation risk reduced by complete inspection documentation. Typical compliance ROI: $40,000 to $150,000/year per plant. |
| UAE | ADNOC Asset Integrity Management System (AIMS), AGES standards, ISO 55001, OSHAD-SF regulatory requirements, Dubai Municipality industrial compliance | ADNOC-regulated plants: 300-800 hours per AIMS audit cycle. ISO 55001 certification preparation: 100-250 hours per surveillance audit. Arabic documentation requirements add translation cost. | ADNOC AIMS and AGES documentation generated automatically. ISO 55001 surveillance packages in under 2 hours. Arabic platform outputs eliminate translation cost. Typical compliance ROI: $60,000 to $200,000/year per plant. |
| UK | PSSR Written Scheme of Examination, PUWER statutory inspection records, COMAH major hazard documentation, ISO 55001, HSE RIDDOR incident reporting | PSSR-regulated plants: 100-300 hours per Written Scheme review cycle. COMAH safety case evidence compilation: 200-500 hours per major hazard audit. Prohibition notice cost: production stoppage until remediation. | PSSR Written Scheme evidence automatically maintained. COMAH major hazard records complete. HSE inspection evidence retrievable in seconds. Typical compliance ROI: $35,000 to $120,000/year per plant. |
| Canada | Provincial OHS Acts, TSSA (Ontario) boiler and pressure vessel inspection records, CSA Z1000 maintenance management, bilateral bilingual documentation requirements | TSSA-regulated plants: 80-200 hours per Certificate of Inspection cycle. CSA Z1000 audit preparation: 100-300 hours per audit. French documentation requirement (Quebec): additional translation cost. | TSSA inspection records automatic. CSA Z1000 maintenance management audit trail complete. Bilingual (EN/FR) platform eliminates translation cost. Typical compliance ROI: $30,000 to $100,000/year per plant. |
| Germany / EU | BetrSichV operational safety records, PED pressure equipment inspection evidence, TUV annual inspection preparation, EU GDPR-compliant data handling, ISO 55001, NIS2 OT cybersecurity | BetrSichV-regulated plants: 150-400 hours per TUV audit cycle. PED pressure equipment records: 100-300 hours per inspection period. NIS2 OT cybersecurity evidence: new requirement adding 50-150 hours per cycle. | BetrSichV, PED, and TUV records automatic. NIS2 OT cybersecurity evidence included. GDPR on-premise architecture eliminates data protection compliance overhead. Typical compliance ROI: $45,000 to $160,000/year per plant. |
| Australia | WHS Act maintenance records, AS 3788 pressure equipment inspection evidence, State high-risk plant registration and inspection, NGER Act emissions reporting, Safe Work Australia recordkeeping | High-risk plant operators: 80-250 hours per State inspection cycle. NGER Act emissions compilation: 50-150 hours per year. WHS Act maintenance records: ongoing documentation requirement per asset. | WHS and AS 3788 records automatic. High-risk plant inspection evidence complete. NGER emissions data from monitoring systems. Typical compliance ROI: $30,000 to $90,000/year per plant. |
iFactory's pre-deployment assessment identifies the specific compliance standards applicable to your facility, the current manual audit preparation cost, and the penalty exposure you carry. The compliance ROI is often larger than plants expect, particularly in ADNOC, PSSR, BetrSichV, and PSM-covered facilities.
Results: What Manufacturing Plants Actually Achieve with iFactory
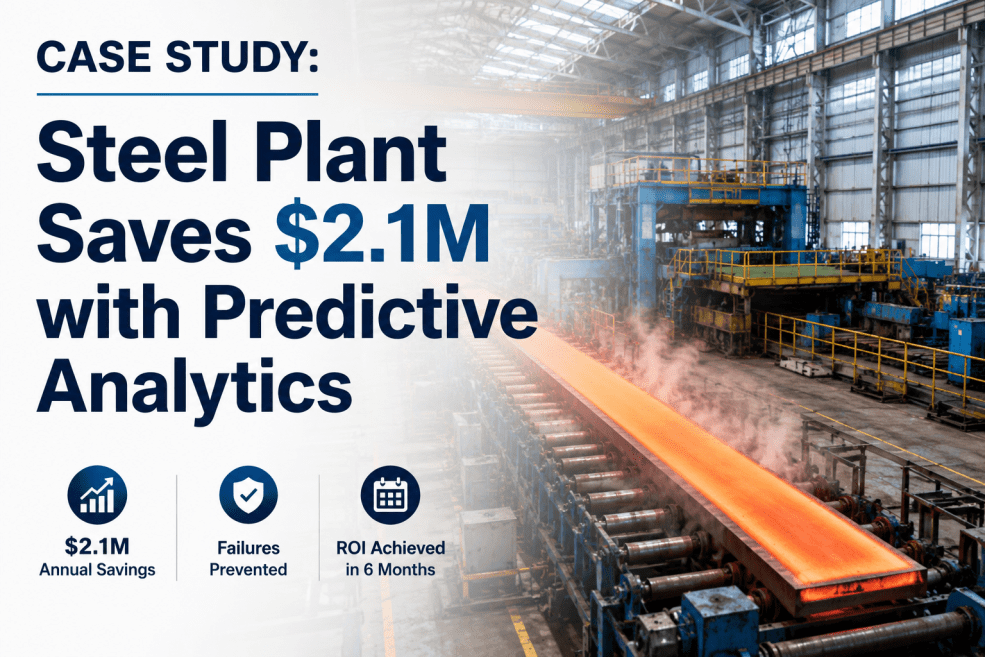
Measured across iFactory deployments in manufacturing plants where a single prevented failure or the first month's energy savings exceed the total deployment cost. Payback is faster in plants with higher downtime cost per hour.
A plant spending $100,000 on iFactory deployment achieves $800,000 to $2,500,000 in cumulative return over 3 years from all four ROI categories. ROI multiples for large plants typically run at 15 to 60 times the deployment investment.
Shift from reactive and calendar-based maintenance to condition-based maintenance driven by iFactory alerts reduces total maintenance spend by 22 to 35 percent across the monitored asset population within the first 12 months.
iFactory builds the plant-specific ROI model before any platform commitment. The assessment uses your downtime history, maintenance spend, energy bills, and compliance audit records to produce a financial case your finance team can evaluate independently.
After sensor deployment and the 7 to 21 day AI baseline learning period, first actionable fault alerts activate. For most plants, at least one developing fault is identified in the first 30 days that would have caused an unplanned stoppage without intervention.
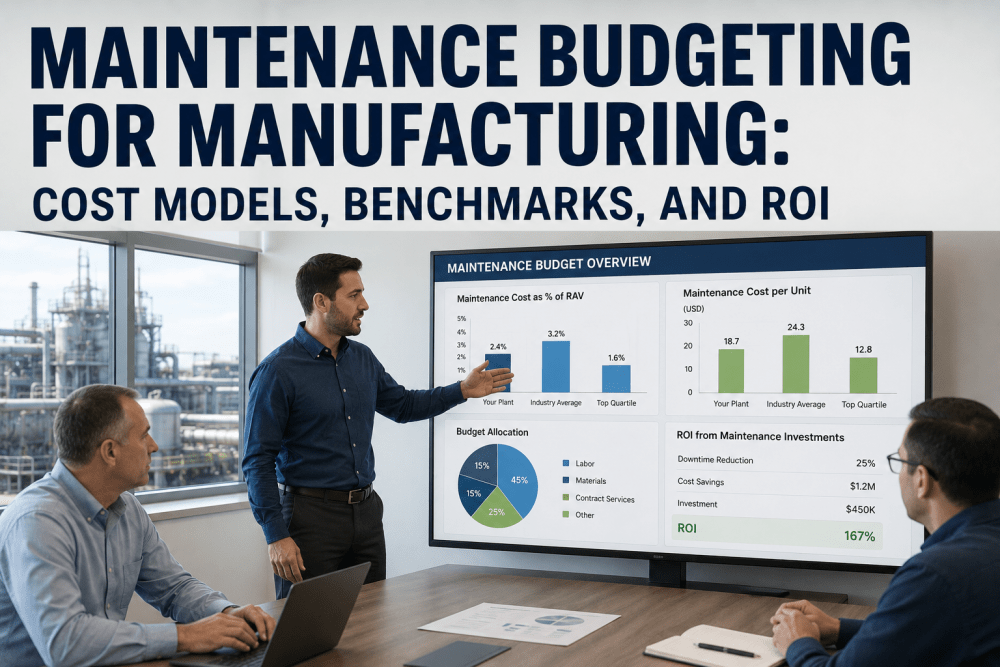
iFactory's ROI dashboard attributes every prevented failure, energy saving, and compliance cost elimination to the specific asset, fault type, and date. Your finance team can verify every dollar of return claimed, with the work order and sensor data as the supporting evidence.
Frequently Asked Questions
Continue Reading
Three years of downtime records, your maintenance spend breakdown, last year's energy bills, and the specific compliance standards you audit against are all that is needed. iFactory builds the four-category financial model, presents it as a single-page investment case, and requires no commitment to proceed. The assessment is free. The numbers are yours to keep.