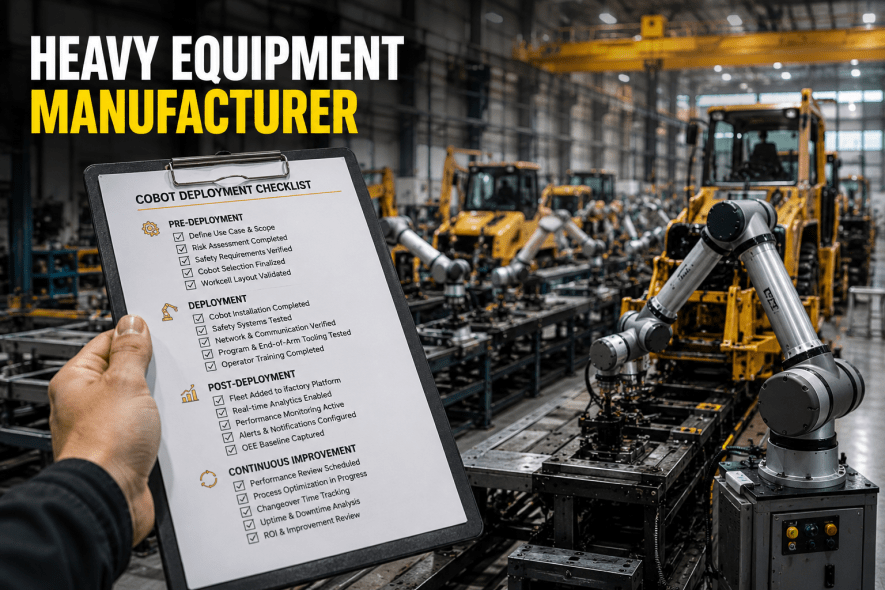
Heavy Equipment Manufacturer Deploys 35 Cobots with iFactory Analytics Tracking

By Hannah Baker on June 9, 2026

heavy-equipment-35-cobots-ifactory-analytics

When a $2.8 billion heavy equipment manufacturer set a target to increase assembly line throughput by 25% across three production facilities, the company's existing automation strategy — a mix of standalone industrial robots and manual workstations — could not deliver the required flexibility at the needed scale. The company chose to deploy 35 collaborative robots across three assembly lines in a coordinated rollout, and equipped every cobot with iFactory's robotics analytics tracking platform from day one of production. The result over the first twelve months of operation: 99.3% fleet uptime, an 18-point improvement in overall equipment effectiveness, and a 42% reduction in changeover time between model variants — outcomes that transformed the company's business case for automation from a cost-recovery justification into a capacity-expansion mandate. Manufacturing leaders evaluating their first large-scale cobot deployment regularly Book a Demo to see how iFactory analytics delivers fleet-wide visibility from day one.

99.3%
Fleet uptime across 35 cobots over 12 months — achieved through predictive maintenance and real-time performance monitoring
+18%
OEE improvement across all three assembly lines — from 67% baseline to 85% post-deployment measured against nameplate capacity
42%
Reduction in model changeover time — from 84 minutes to 49 minutes through iFactory's coordinated changeover orchestration
35
Cobots deployed across chassis, powertrain, and final assembly lines in a single coordinated rollout with unified analytics

The Cobot Scaling Challenge — Why Manual Fleet Management Breaks at 35 Robots

The company's three assembly lines produced eight distinct model variants with frequent changeovers driven by customer orders. Before the cobot deployment, each line operated with a mix of five to seven legacy industrial robots — programmed off-line, cycle times unmonitored, maintenance performed on a fixed calendar schedule regardless of actual robot condition. Changeovers required an average of 84 minutes per transition, during which production stopped while technicians manually adjusted grippers, re-fed part feeders, and validated robot programs. Unplanned downtime averaged 4.7 hours per week per line, and first-pass yield across the three lines averaged 94.1%.

Most critically, the company had no centralized system to track robot performance, predict maintenance needs, or optimize changeover sequences. Each robot operated as an island, and the production team had no way to answer the most basic questions: which robot was causing the most downtime, which program variant produced the most errors, or how much capacity was actually available across the fleet at any given moment.

Fragmented Visibility Across the Fleet
15 legacy robots across 3 lines operating with no centralized performance monitoring or historical data repository. Each robot's cycle time, error rate, and utilization data existed in isolation.
Unplanned Downtime Undetected Until It Stopped Production
4.7 hours per week of unplanned stoppage per line — undetected until production stopped and root cause investigation began. No predictive alerting existed for any asset.
Lengthy Manual Changeovers Between Model Variants
84-minute average model changeover requiring manual gripper adjustments, part feeder reconfiguration, and per-robot program validation — performed sequentially by technicians moving station to station.
Reactive Maintenance Regardless of Actual Condition
Calendar-based maintenance regardless of actual robot utilization, joint torque trending, or cycle count accumulation. No condition data informed repair scheduling or part replacement timing.

35 Cobots, One Analytics Layer — How iFactory Unified the Fleet

The company selected 35 UR20 and UR30 collaborative robots from Universal Robots — 12 on the chassis assembly line, 11 on the powertrain assembly line, and 12 on the final assembly and test line — and deployed iFactory's robotics analytics tracking platform as the single monitoring and management layer across the entire fleet. Every cobot was connected to iFactory at commissioning, streaming cycle time, joint torque, motor current, program state, and error code data at sub-second intervals from the first production cycle.

iFactory was configured with per-line dashboards, model-specific cycle time baselines, and automated work order triggers calibrated to each cobot's operating parameters. The platform's changeover orchestration module was programmed with the full matrix of model variant transitions across all three lines, enabling coordinated program switching that reduced line idle time by 42% compared to the previous manual process. Within the first 30 days of operation, iFactory's torque trending models had established individual baselines for every cobot joint, and predictive alerts were active on all 35 units — flagging developing anomalies before they could cause production interruptions.

12
UR20 cobots deployed on frame welding, cross-member fastening, and axle subassembly stations

12 UR20 cobots deployed across frame welding stations, cross-member fastening cells, and axle subassembly positions. iFactory tracks per-robot cycle time variance against model-specific baselines, weld current trending for electrode wear prediction, and real-time torque verification rates for every fastened joint. The line achieved 99.5% uptime in month three of operation with zero quality escapes attributed to cobot positioning error over the measurement period. Cycle time variance alerts at 8% above baseline trigger automatic investigation work orders before throughput is affected.

11
UR30 cobots handling transmission mating, driveline fastening, and fluid fill operations

11 UR30 cobots handling transmission mating operations, driveline fastening sequences, and fluid fill and test procedures. The higher payload UR30 platforms were selected for transmission handling tasks requiring 20–30 kg lift capacity. iFactory monitors force-torque profiles for fastener integrity verification, joint temperature trending for predictive maintenance, and program execution consistency across shift changes. The powertrain line saw the largest OEE improvement — from 64% baseline to 83% post-deployment — driven by the elimination of manual torque verification delays.

12
UR20 cobots deployed on cab installation, trim assembly, and functional testing stations

12 UR20 cobots deployed across cab installation, trim assembly, and functional testing stations. iFactory tracks cycle count per program version to identify which model variants produce the highest error rates, utilization rate by shift for line balancing decisions, and error code frequency by cobot serial number to flag units requiring preventive intervention before failure. The final assembly line achieved the fastest ramp to full production rate — six weeks from commissioning to nameplate capacity — supported by iFactory's real-time performance benchmarking against fleet baselines.

Cobot Fleet Analytics · Real-Time Monitoring · Predictive Maintenance · OEE Optimization
Deploy iFactory Analytics on Your Cobot Fleet — From Pilot to Production in Weeks
iFactory connects to any collaborative or industrial robot controller, streaming cycle time, torque, error, and utilization data into a single fleet dashboard with consequence-weighted alerts and automated work order generation.

Measurable Results — Fleet Uptime, OEE, and Changeover Transformation

Twelve months after deployment, the results across the three lines were measured against established baselines. The company's internal automation ROI model had projected a 22-month payback period; actual results delivered payback in 14 months driven by higher-than-forecast uptime and changeover savings. Every metric exceeded the original business case projection. Book a Demo to review the full case study data and build your deployment projection.

99.3%
Fleet Uptime
Across 35 cobots over 12 months — driven by predictive torque trending that identified joint wear 48–72 hours before failure.
+18%
OEE Improvement
From 67% baseline to 85% post-deployment — the largest gains came from eliminating unplanned stops through condition-based alerts.
42%
Changeover Reduction
From 84 minutes to 49 minutes average — iFactory's coordinated program switching cut line idle time by more than a third.
91%
Downtime Reduction
Unplanned downtime dropped from 4.7 hours per week per line to 0.4 hours — a 91% reduction through predictive alerting.
14 mo
Actual Payback Period
Eight months ahead of the 22-month projection — driven by uptime and changeover savings the original model underestimated.
+4.6 pp
First-Pass Yield Gain
From 94.1% to 98.7% — program consistency across shifts eliminated the variance that caused manual rework.
Metric Baseline Post-Deployment Improvement
Fleet Uptime 87.2% 99.3% +12.1 pp
Overall Equipment Effectiveness 67% 85% +18 pp
Model Changeover Time 84 minutes 49 minutes –42%
Unplanned Downtime per Week 4.7 hours 0.4 hours –91%
First-Pass Yield 94.1% 98.7% +4.6 pp

The iFactory Analytics Workflow — From Raw Robot Data to Fleet Optimization

The analytics layer that connected every cobot's data stream into actionable intelligence followed a six-stage workflow, applied continuously across the 35-robot fleet. Each stage contributed a specific capability that the company's previous automation approach could not deliver.

01
Real-Time Data Aggregation
Every cobot streams cycle time, joint torque, motor current, program state, and error codes to iFactory at sub-second intervals. Data normalized across all 35 robots regardless of controller type or program version.
02
Performance Benchmarking
Individual robot performance compared against fleet baselines and model-specific targets. Underperformers identified before they cause throughput loss — not after the fact during shift review meetings.
03
Predictive Alerting
Anomaly detection on joint torque trends, motor current drift, and cycle-time degradation generates maintenance recommendations 24–72 hours before failure probability exceeds threshold.
04
Changeover Orchestration
Model-change procedures digitally synchronized across all affected cobots simultaneously. Line idle time reduced by 42% through coordinated program switching and automatic program version validation.
05
Automated Work Order Generation
Condition threshold breach generates prioritized inspection work order with asset ID, risk context, checklist, and completion timeframe. Life-safety conditions trigger immediate SMS escalation.
06
Continuous Improvement Loop
Production outcomes — cycle times, error rates, yield — fed back as labeled training events. Every changeover and maintenance cycle improves the fleet model's predictive accuracy.

What Manufacturing Leaders Say About iFactory Cobot Analytics

Before iFactory, our cobots were producing parts, but we had no window into whether they were performing at their potential. We could tell you which robots were running and which were stopped, but we could not tell you why a cycle time had drifted 12% over two weeks, or which program variant caused the most errors, or whether our maintenance schedule was catching problems before they caused downtime. iFactory changed that completely. Within 30 days of deployment, we had a fleet-wide performance baseline, predictive alerts on three cobots with developing joint torque issues, and a changeover process that cut 35 minutes out of every model transition. The 99.3% uptime we achieved in month four is not a lucky number — it is the direct result of having a system that converts robot data into decisions faster than problems can develop.
Director of Manufacturing Engineering
Heavy Equipment OEM, Three Production Lines, 35-Cobot Fleet

Conclusion — The Analytics Layer That Determines Cobot Fleet Success

The heavy equipment manufacturer's 35-cobot deployment demonstrates a pattern that holds across every scale of robotics investment: the robots themselves are commodity hardware. The competitive advantage comes from the analytics layer that monitors, benchmarks, predicts, and optimizes their collective performance. Without that layer, a 35-cobot fleet generates the same fragmented visibility, unplanned downtime, and reactive maintenance that plagued the previous generation of industrial robots. With iFactory analytics, the same fleet delivers 99.3% uptime, an 18-point OEE gain, and a 42% reduction in changeover time — metrics that shift the automation business case from cost recovery to capacity expansion.

iFactory's robotics analytics tracking platform delivers real-time fleet monitoring, consequence-weighted performance alerts, automated changeover orchestration, and continuous improvement feedback across any mix of cobot and industrial robot brands. The platform investment is typically recovered within the first 90 days of deployment from reduced downtime and improved changeover efficiency alone. Book a Demo to see how iFactory can transform your cobot deployment economics.

Frequently Asked Questions

For a multi-line cobot deployment in the 20–40 robot range, typical payback periods range from 12 to 18 months when the deployment includes a centralized analytics platform. The heavy equipment manufacturer in this case study achieved payback in 14 months — ahead of the 22-month projection — driven by 99.3% uptime (vs. 92% assumed) and 42% changeover reduction (vs. 20% assumed). iFactory analytics contributes to ROI through reduced unplanned downtime, faster changeovers, higher first-pass yield, and extended cobot service life through condition-based maintenance.
iFactory connects to any robot controller supporting standard protocols — URScript, RTDE, Modbus TCP, OPC-UA, and proprietary SDKs from Fanuc, ABB, Kuka, Yaskawa, and other manufacturers. All data is normalized into a unified schema so fleet-level dashboards and alert thresholds apply consistently across robot models. The same architecture supports mixed fleets of cobots and industrial robots in a single interface.
iFactory's cobot analytics dashboard tracks eight primary metrics: fleet uptime, cycle time variance, utilization rate, error rate per 1,000 cycles, first-pass yield, torque/force verification pass rate, joint torque trending, and motor current drift. In this deployment, iFactory's torque trend analysis identified three cobots with gradual joint torque increases that were causing micro-delays totaling 66 minutes of lost production per week — recovered through targeted lubrication and program path optimization.
For 30–40 cobots across 2–3 production lines in an existing facility, the full timeline from contract to fleet-wide production at nameplate capacity is typically 14–20 weeks. The heavy equipment manufacturer reached 95% of target OEE by week 16 and achieved full design performance by week 20. iFactory's data integration and dashboard configuration runs concurrently with cobot commissioning, not sequentially.
iFactory manages model-variant transitions at the fleet level. When a changeover is initiated, each cobot completes its cycle and returns to park position, iFactory verifies all robots are ready before beginning the program switch, the new program variant is loaded simultaneously on every cobot, and the first cycle is monitored with tighter tolerance thresholds. The 42% changeover reduction came primarily from eliminating the sequential manual program switching that characterized the previous process.
Ready to Transform Your Cobot Deployment Economics with iFactory Analytics?
iFactory gives manufacturing teams the platform to monitor every cobot in real time, predict maintenance before failure, orchestrate changeovers in minutes instead of hours, and build a continuous improvement loop that compounds OEE gains quarter over quarter.
Real-Time Fleet Monitoring
Predictive Torque Trending
Changeover Orchestration
Automated Work Orders
OEE Continuous Improvement

Share This Story, Choose Your Platform!

Related Posts