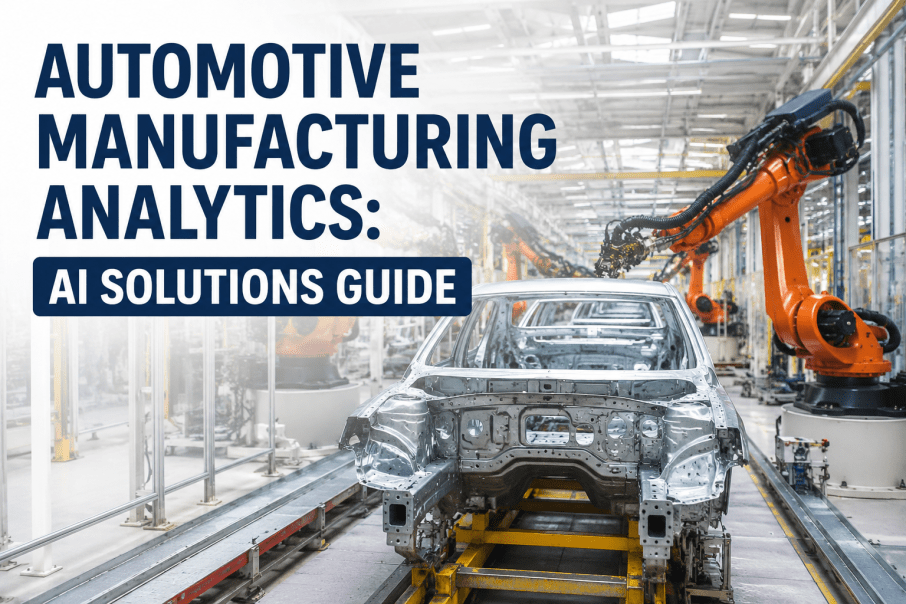
The afternoon shift supervisor at a Tier-1 automotive assembly plant watches her dashboard — 1,200 vehicles per shift, 14 robots on the body shop line, a paint booth running at 87% first-pass yield, and a conveyor system that handles 3,200 parts per hour. A single welding robot's cycle time drifts by 0.4 seconds. By the end of the shift, that drift costs 18 incomplete body welds and $14,000 in rework. The plant runs 24/7, and every minute of unplanned downtime costs $22,000. Automotive manufacturing analytics isn't a luxury — it's the difference between hitting production targets and explaining a missed quarter to the board.
One Platform for Every Production Signal — Assembly, Paint, Body, Robotics, Welding, Conveyors
iFactory ingests data from every source across your plant — robots, PLCs, vision systems, conveyor drives, paint booths, and weld controllers — and delivers a unified analytics layer that turns raw signals into actionable production intelligence.
Automotive Analytics That Spans Every Production Zone
Automotive plants are a federation of discrete systems — body shops with welding cells, paint lines with environmental controls, assembly stations with torque tools, and conveyor networks that tie it all together. Each system generates its own data stream, but no single tool sees the whole picture. iFactory connects to every data source on your plant floor — from FANUC and KUKA robot controllers to ABB paint booth PLCs, from SICK vision sensors to Siemens conveyor drives — and normalizes that data into a single analytics model. The result is a plant-wide view that detects drift in a weld gun's tip wear, flags a paint booth's humidity deviation, and alerts on a conveyor motor's vibration signature — all from one interface. No cloud dependency. No data leaving your network. A 6-to-12-week pilot that goes live with your existing infrastructure.
Six Analytics Modules That Cover Every Production Zone
Each module is purpose-built for a specific automotive manufacturing domain, but they share a common data model, alerting engine, and dashboard. Deploy one module or all six — the platform scales.
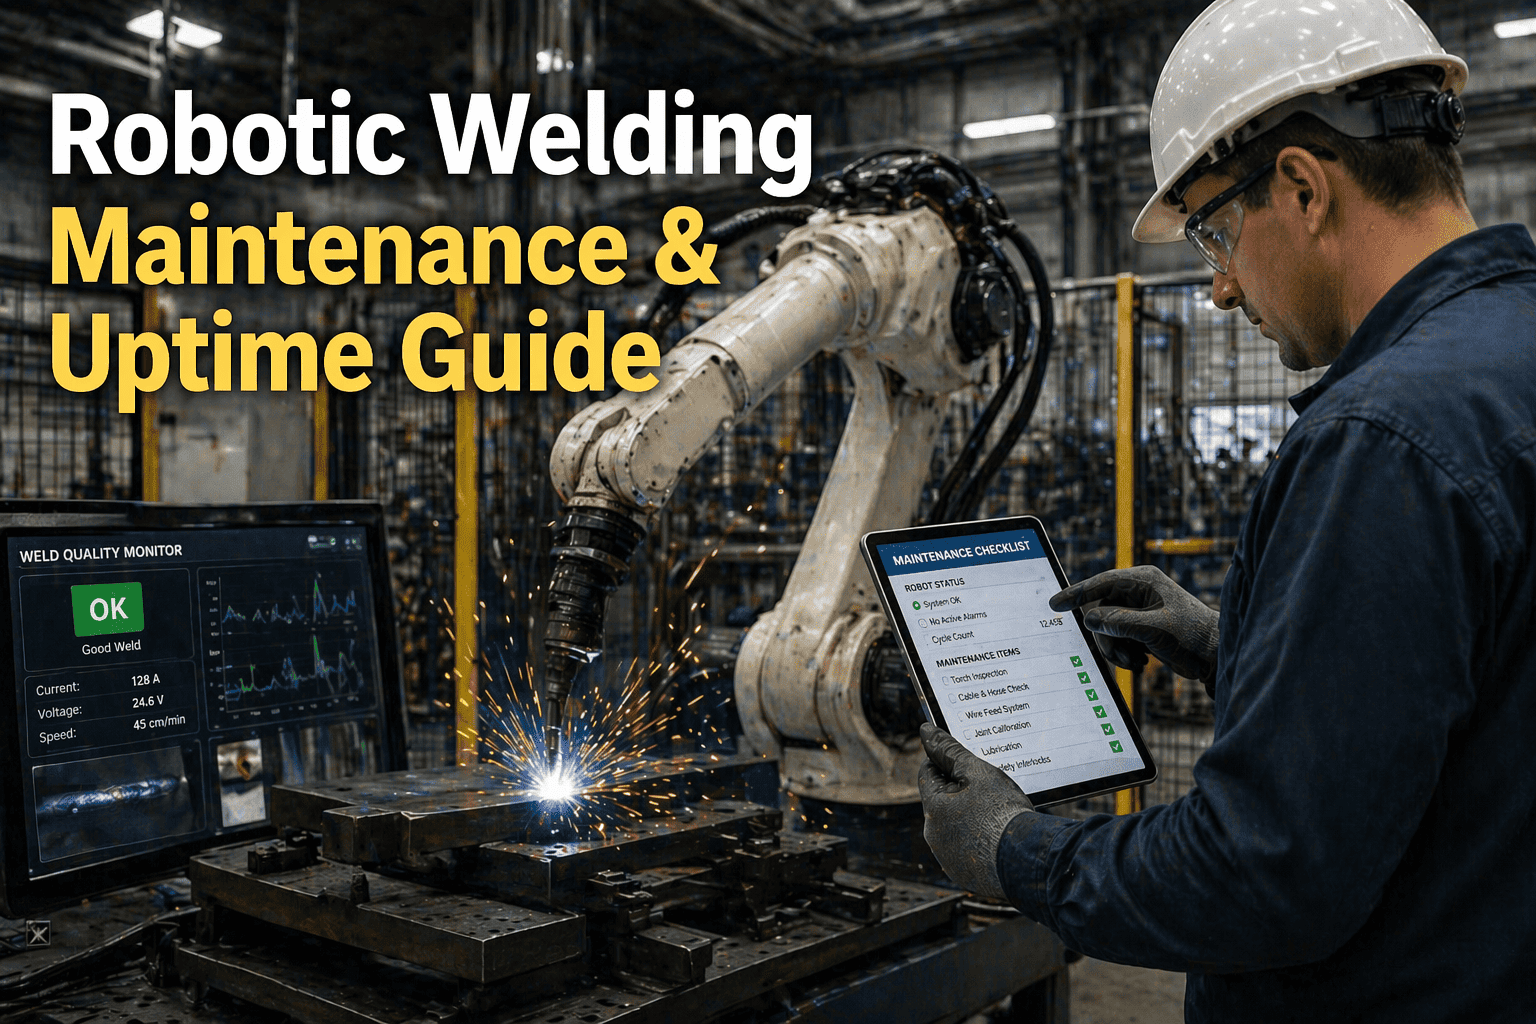
Welding & Joining Analytics
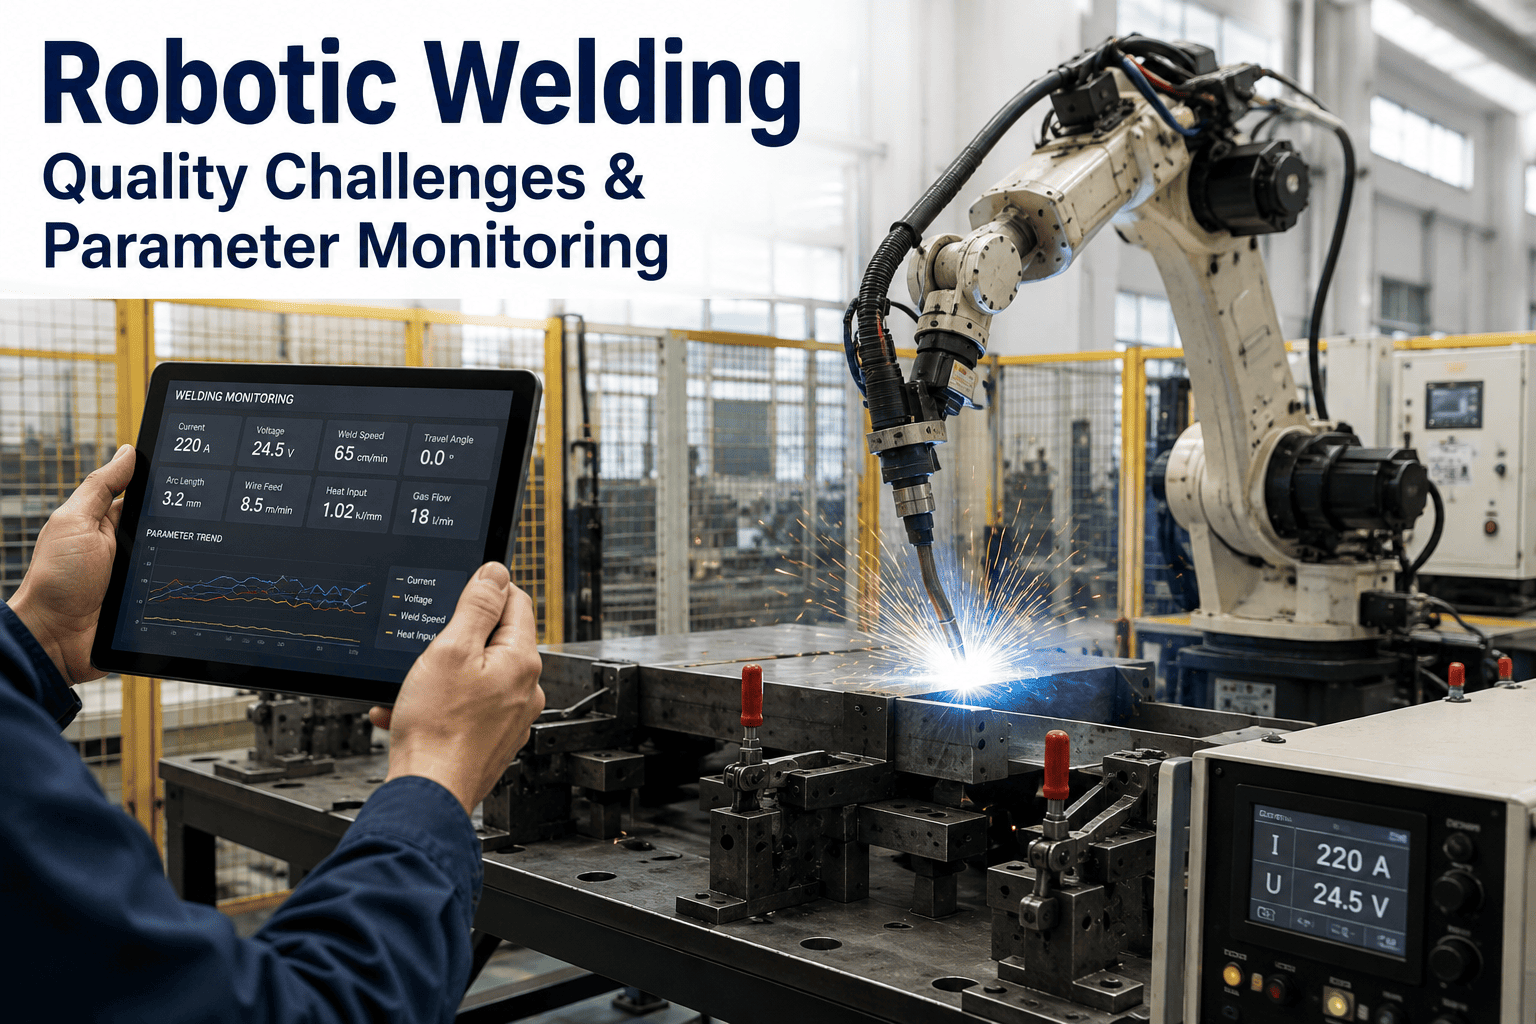
Monitors weld current, voltage, wire feed rate, and tip wear across all robotic and manual weld stations. Detects deviation in nugget size and expulsion events before they cause structural defects. Typical yield improvement: 4-7%.
Paint Booth & Coating Analytics
Tracks booth temperature, humidity, airflow, and robot applicator parameters in real time. Identifies conditions that cause orange peel, runs, or solvent pop. Reduces rework by 15-25% in the first quarter.
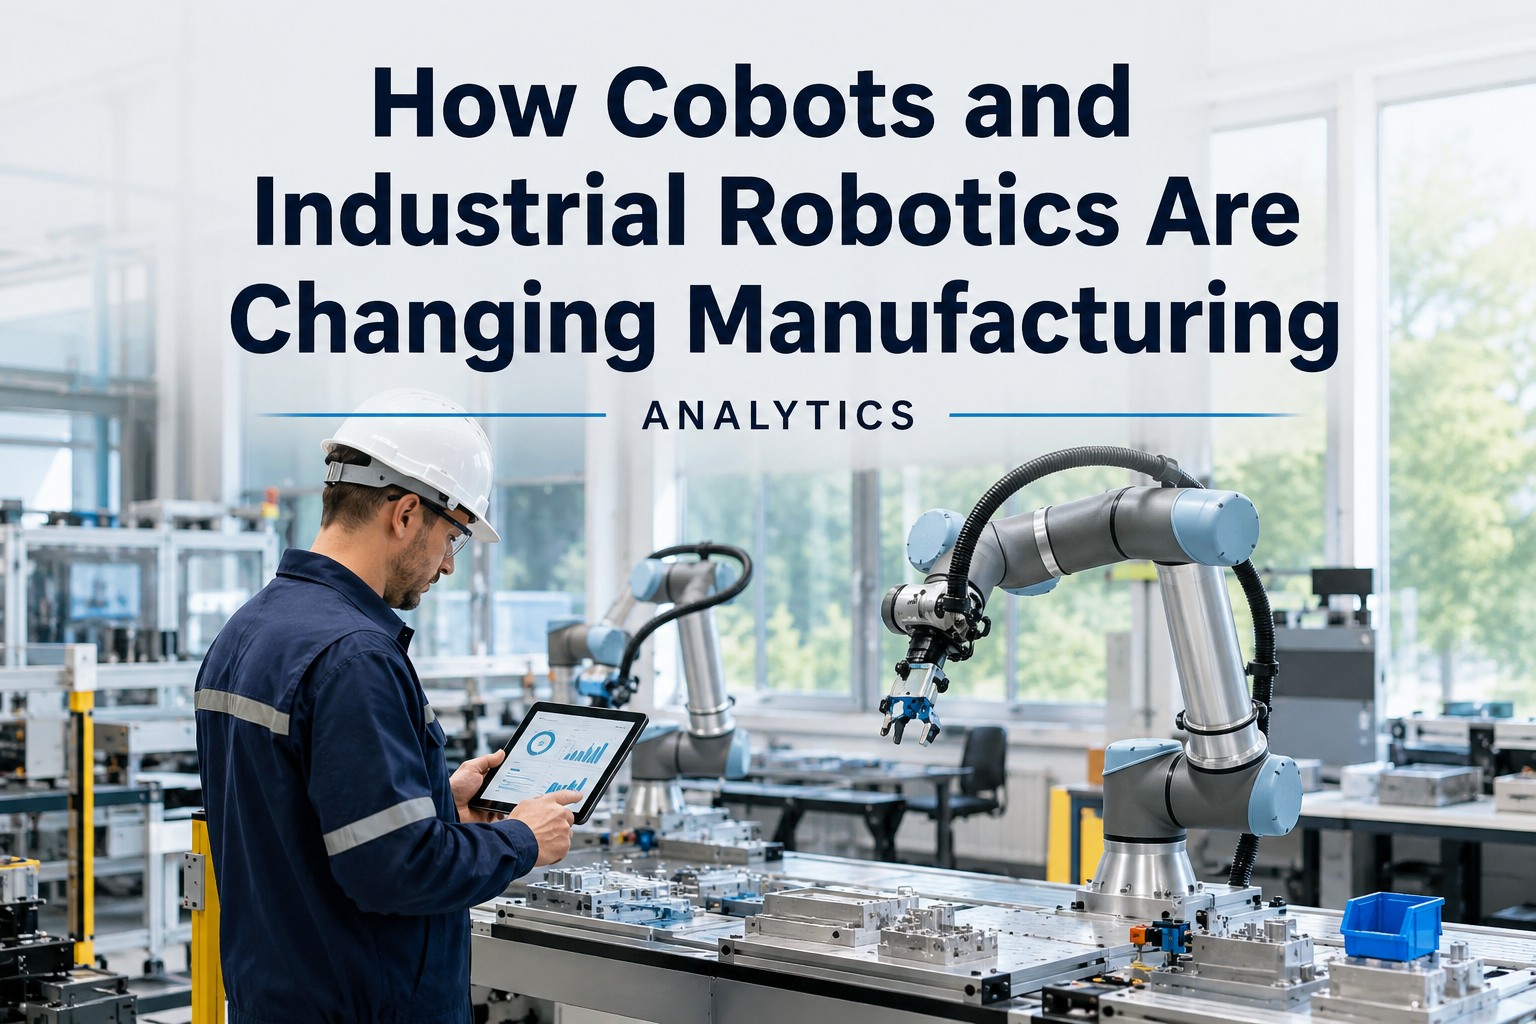
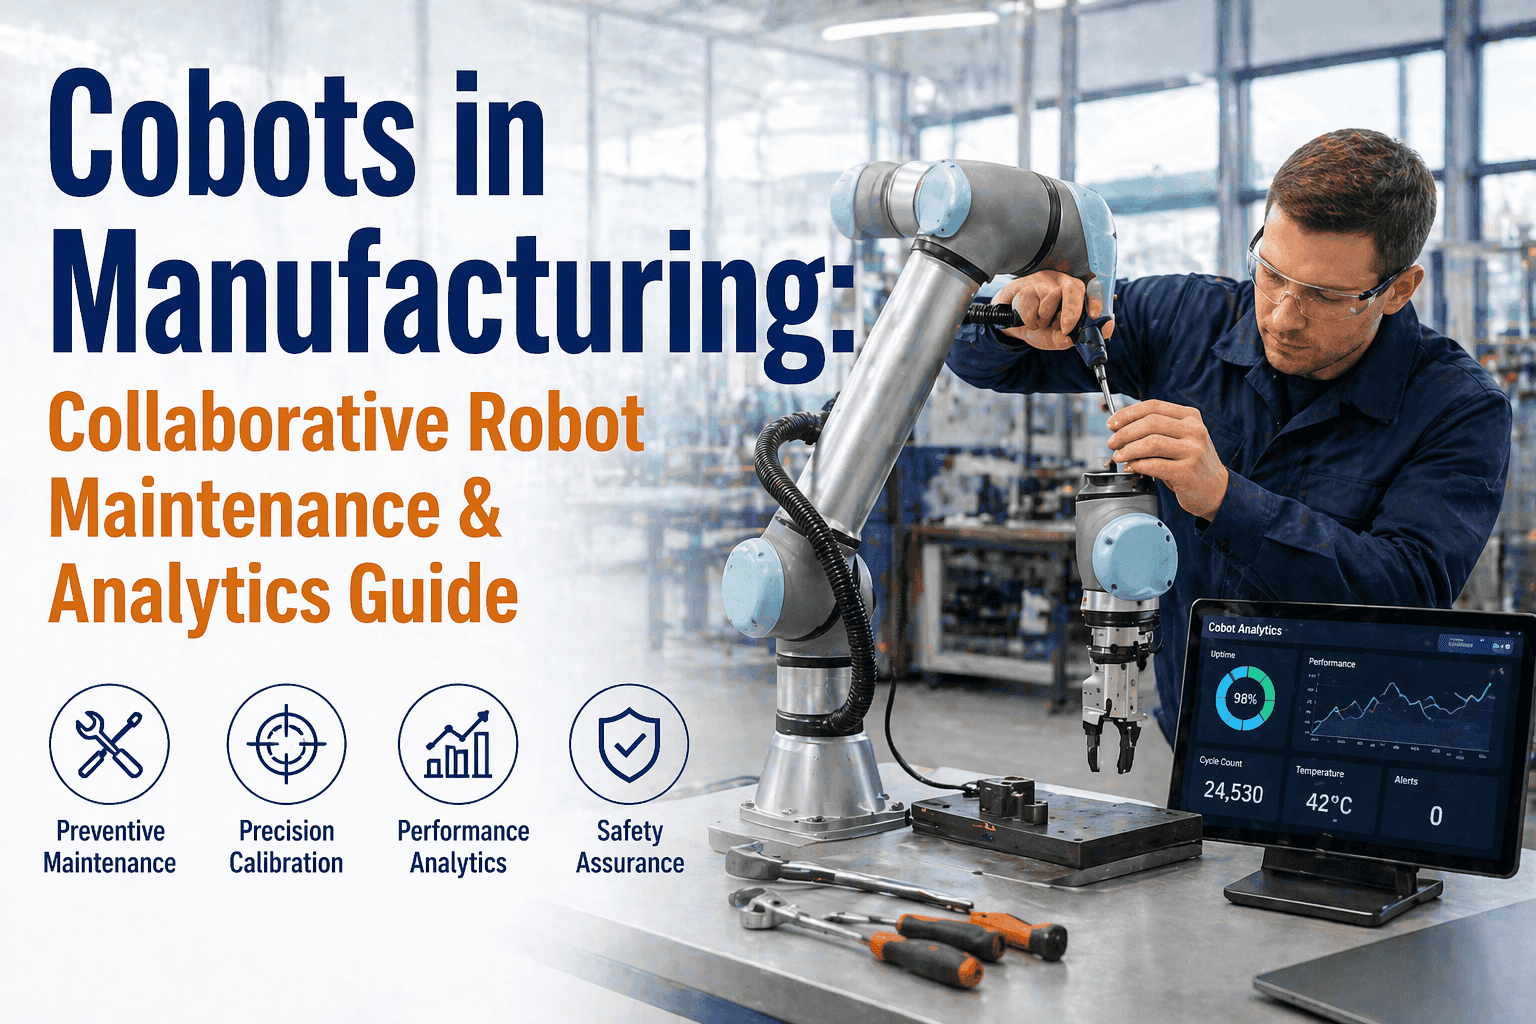
Robotics & Cobot Analytics Tracking
Ingests joint position, torque, acceleration, and cycle time data from every robot brand — FANUC, KUKA, ABB, Yaskawa, Universal Robots. Flags drifts in path accuracy, joint temperature, and payload utilization. Prevents unplanned stops by predicting bearing and gear wear 2-4 weeks in advance.
Assembly Line & Torque Analytics
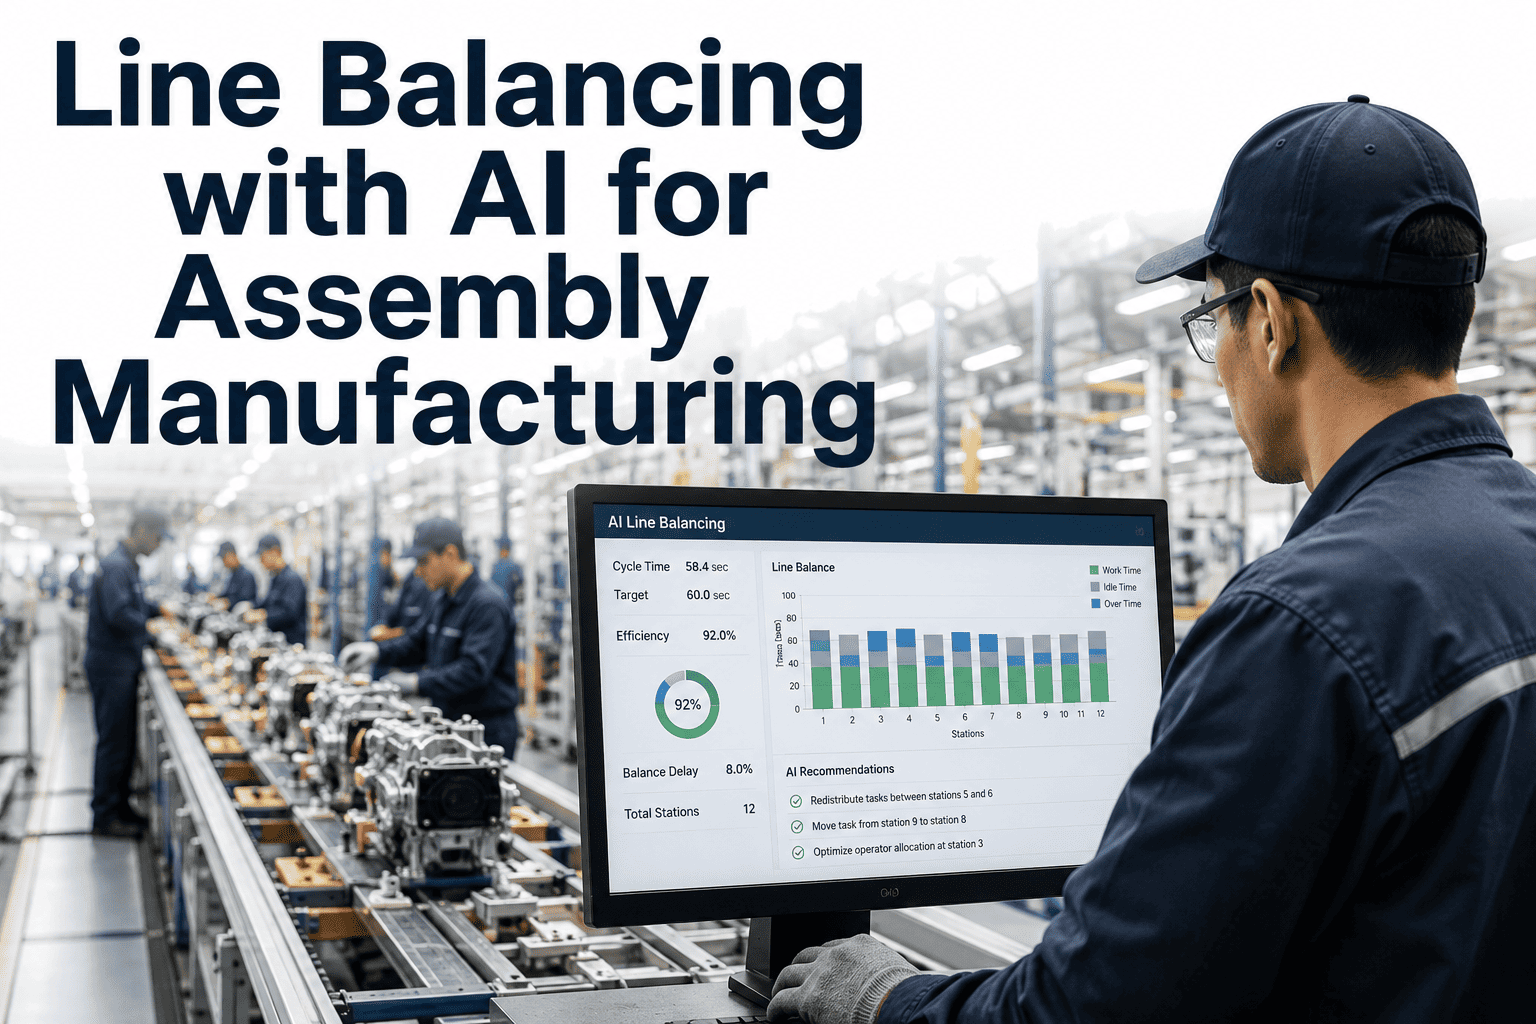
Monitors fastening tools, press forces, and pick-and-place cycles across final assembly. Correlates torque-angle curves with downstream quality data to catch cross-threading and under-torque events in real time. Reduces warranty claims tied to assembly defects by 30%.
Conveyor & Material Handling Analytics
Analyzes motor current, belt tension, roller bearing vibration, and chain wear across all conveyor segments. Predicts jams and breakdowns 48-72 hours before they occur, enabling planned maintenance during breaks instead of emergency stops.
Vision & Inspection Analytics
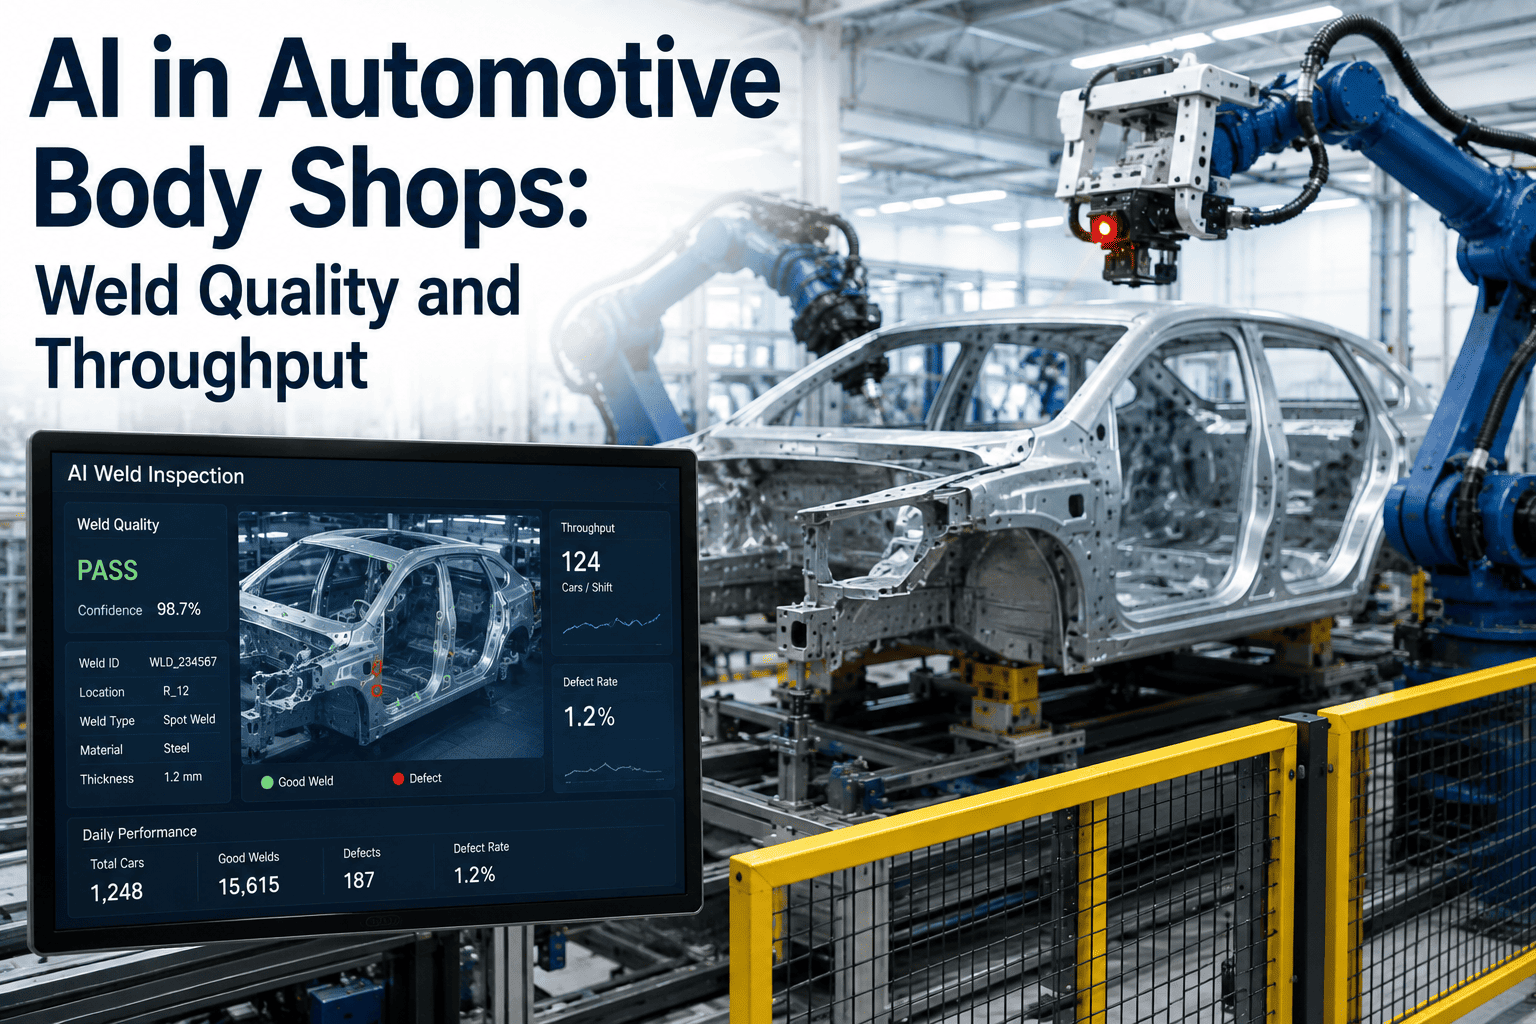
Connects to inline vision systems and coordinates their pass/fail data with upstream process parameters. When a camera rejects a part, iFactory traces back to the exact robot program, weld schedule, or conveyor speed that caused the defect. Reduces false rejects by 20%.
From Plant Data to Production Intelligence in Four Steps
iFactory is installed on an NVIDIA appliance on your plant network — no cloud, no data egress. The platform connects to your existing data sources and delivers analytics within weeks.
Connect All Data Sources
iFactory connects directly to robot controllers, PLCs, vision systems, conveyor drives, and paint booth controllers via OPC UA, MTConnect, Modbus, and direct SDK integrations — no middleware required.
Normalize & Model
Raw signals from different brands and protocols are normalized into a unified data model. Each machine, process parameter, and quality metric becomes a searchable, queryable asset.
Detect & Alert
Machine learning models detect drift, anomalies, and degradation patterns across all zones. Alerts are delivered to operator dashboards, mobile devices, and existing notification systems with root-cause context.
Optimize & Predict
Over time, the platform learns normal operating envelopes for every asset and process. Predictive models forecast failures 2-4 weeks out, and optimization recommendations suggest parameter adjustments that improve yield and throughput.
Three Ways Fragmented Analytics Hurts Your Bottom Line
When each production zone operates in its own data silo, problems cascade across the plant before anyone sees the pattern. Here's what that costs in real terms.
Unplanned Downtime from Robotic Drift
A welding robot's wrist joint temperature drifts 2°C over three days — invisible in siloed monitoring. On day four, the joint seizes, stopping the entire body shop for 45 minutes. At $22,000 per minute, that's $990,000 in lost production.
Paint Rework from Unseen Environmental Shift
Booth humidity rises 5% over two hours due to a failing HVAC damper. The paint robot applies coating with the same program, but the higher humidity causes solvent pop on 120 vehicle bodies. Each body requires 40 minutes of rework at $280 per hour.
Conveyor Jam Cascade
A conveyor motor bearing begins to fail on the paint shop exit line. The vibration signature shifts gradually over 12 hours, but no system monitors it. When the bearing seizes, it jams three downstream conveyor segments, stopping the entire assembly line for 18 minutes.
What Automotive Plants Achieve with iFactory
These are real outcomes from iFactory deployments across body shops, paint lines, and assembly plants — not projections.
Your plant already generates the data — iFactory turns it into actionable production intelligence. Book a 30-min walkthrough and we'll show you live on your data.
Common Questions About Automotive Manufacturing Analytics
Your Plant's Data Is Already Talking — iFactory Lets You Hear Every Signal
From the body shop to final assembly, from paint booth to conveyor line — one platform, one data model, one team. See it live in a 30-minute walkthrough with your own data.