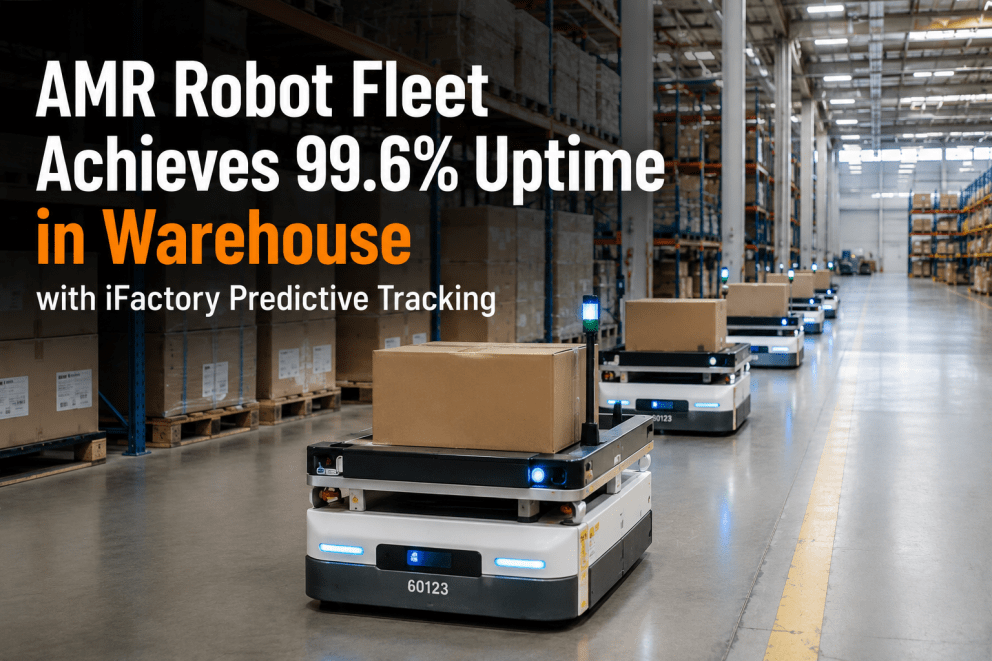
AMR Robot Fleet Achieves 99.6% Uptime in Warehouse with iFactory Predictive Tracking
By Hannah Baker on June 9, 2026
A 280,000-square-foot fulfillment center deployed a 60-unit autonomous mobile robot fleet to handle 18,000 order lines per day across three shifts. Eight months later, fleet uptime had collapsed from 97% to 81%. The robots were not failing due to design flaws or overwork — they were failing because no structured maintenance program existed for them. Wheel tread went unmeasured. LiDAR lenses accumulated warehouse dust. Battery charge cycles went untracked. The OEM fleet management software handled navigation and task dispatch but had no mechanism for component-level health tracking. The facility was not managing a robot fleet — it was waiting for failures to happen. This case study documents how iFactory's AI-driven predictive tracking and fleet health monitoring recovered 99.6% uptime, eliminated unplanned stoppages and restored over $312,000 in annual throughput value from the same hardware.
CASE STUDY: AMR FLEET OPTIMIZATION
Is Your AMR Fleet Operating Below Its Potential?
iFactory delivers real-time fleet health monitoring, battery degradation tracking, and predictive maintenance scheduling that converts a reactive robot fleet into a benchmark operation.
The Fleet at Risk: How a 97% Uptime Fleet Became an 81% Liability
The Hidden Cost of Maintenance-Free Robot Operations
The facility is a third-party logistics fulfillment center in the Southeast U.S. processing approximately 18,000 order lines daily across three shifts, 363 days per year. The AMR fleet — 60 units deployed for goods-to-person order picking — represented a $4.7M capital investment. Robots were managed exclusively through the OEM fleet management software for navigation and task dispatch. No CMMS tracked them as maintainable assets. No component-level health data was being collected. The assumption was that AMRs, designed for 50,000+ operating hours, would run reliably with minimal intervention. That assumption held for the first six months. Then the cumulative effects of unmonitored component degradation became visible in the one metric the facility could measure: uptime.
312Unplanned AMR stoppage events recorded in the 12 months before iFactory
47 minMean time to resolve per stoppage — from fault detection to fleet routing restoration
$312KAnnual throughput value lost to unplanned AMR downtime before intervention
Six Failure Modes, One Blind Spot
Diagnosing the Root Causes of AMR Fleet Degradation
Wheel Tread Degradation
No tread depth measurement schedule existed. Seven units developed tread wear causing odometry drift — the robot's self-reported position diverged from actual position over long routes, accumulating positioning errors that caused pick station misses and emergency stops. Worn tires were the single largest contributor to the 16-point uptime drop.
LiDAR Sensor Contamination
Warehouse particulate — cardboard dust, packing foam debris — accumulated on 14 of 60 LiDAR sensor lenses. Contaminated lenses reduced detection range and accuracy, causing robots to navigate more conservatively, slow down more frequently, and occasionally stop when detecting phantom obstacles. Cleaning takes under 3 minutes per unit. No one had scheduled it.
Battery Capacity Fade
Lithium-ion AMR batteries last 2,000–3,000 charge cycles when managed correctly. Deep discharge cycles below 15% state-of-charge accelerate cell degradation significantly. The fleet's charging protocol had never been configured for opportunity charging. Average fleet battery capacity had dropped to 76% of original — each robot returned to charge more frequently, reducing effective throughput by an estimated 11%.
Motor Bearing & Drive System Wear
Drive motor current draw increases as bearings wear, flat spots develop on wheels, and drive belt tension degrades. Without per-unit current monitoring, these degradation signals went undetected until motors drew fault-level current and triggered emergency stops. A structured monitoring program could have predicted every drive failure 4-6 days in advance.
Firmware Version Drift & Navigation Map Decay
Firmware updates were deferred because maintenance windows were tight and update-risk was real. Over 12 months, the fleet drifted into a mixed-version state where navigation map interpretations varied between units, causing coordination failures, task assignment errors, and robot-to-robot near-misses at intersection points.
Charging Contact & Docking Station Wear
Charging contacts accumulated oxidation and debris, increasing electrical resistance and reducing charge current delivery. Robots reporting "fully charged" in the fleet management dashboard were leaving dock at 88-92% state-of-charge — a discrepancy invisible to operators but measurable in increased return-to-charge frequency during peak windows.
IDENTIFY YOUR FLEET'S DEGRADATION SIGNALS
Most AMR Fleets Are Losing 12-18% Throughput to Unmonitored Component Wear
iFactory's predictive tracking detects wheel wear, battery fade, LiDAR contamination, and motor degradation 2-6 weeks before they disrupt operations. Book a Demo to see a live fleet health assessment.
How iFactory Recovered 99.6% Uptime: The Deployment Framework
A Structured 5-Phase Program for AMR Fleet Health Recovery
iFactory deployed its Robotics & Cobot Analytics Tracking platform across the 60-unit fleet without replacing the existing OEM fleet management software. The platform added the maintenance intelligence layer that the OEM software was never designed to provide — registering every robot as an individual asset with its own health profile, PM schedule, and degradation tracking by component category.
Phase 01
Asset Registration & Health Baseline Establishment
All 60 AMR units were registered in iFactory as individual assets — each with serial number, battery ID, motor specs, wheel model, and sensor configuration. PM templates were built for all six critical component categories. Telemetry streams from the fleet management system were configured to establish healthy operating baselines per robot.
Phase 02
Predictive Health Scoring Engine Activation
iFactory introduced a per-unit fleet health score — a composite of battery capacity percentage, tread depth remaining, sensor calibration recency, motor current draw variance, and open work order count. Fleet managers could see at a glance which units were approaching a maintenance threshold before a fault event occurred.
Phase 03
Automated Work Order & Fault Response Pipeline
When a fault occurred, iFactory's work order was automatically pre-populated with the unit's full history — last PM dates, battery cycle count, prior fault log, and recommended repair procedure. Mean time to resolve dropped from 47 minutes to 11 minutes within six weeks of this capability going live.
Phase 04
Charging Window Maintenance Scheduling
iFactory's scheduling engine used fleet health data to generate maintenance work orders timed to the overnight charging window — every inspection, wheel replacement, LiDAR calibration, and battery cell check executed during charging, not during a shift. Zero planned maintenance events required pulling a robot from active duty.
With six months of structured maintenance data, iFactory's analytics surfaced fleet-level patterns invisible in the OEM platform. Three units showed LiDAR contamination at twice the fleet average — all assigned to a high-cardboard-cutting zone. Cleaning intervals were adjusted. Battery capacity trending identified four units approaching replacement threshold four months in advance.
Results: Before and After iFactory Deployment
12-Month Performance Data from a 60-Unit AMR Fleet
Performance Metric
Pre-iFactory
Post-iFactory
Improvement
Fleet Uptime (60-unit average)
81%
99.6%
+18.6 pts
Mean Time to Resolve
47 minutes
11 minutes
77% faster
Unplanned AMR Stoppages
312 events/yr
14 events/yr
96% reduction
PM Completion Rate
Not tracked
94%
Program created
Emergency Parts Spend
$84,000/yr
$19,000/yr
-77%
Battery Capacity (Fleet Avg)
76% of original
91% of original
+15 pts recovered
Order Lines Missed Due to Downtime
~4,200/yr
~180/yr
96% reduction
Throughput Value Recovered
Baseline
+$312,000/yr
Full fleet restored
"We were running a $4.7M AMR fleet at 81% uptime and telling ourselves the robots were working fine — because the OEM dashboard showed green across the board. The green was a lie. It showed navigation status, not health. iFactory gave us the first true picture of what our fleet was actually experiencing: wheels worn past spec, batteries running at 76% capacity, LiDAR sensors blinded by dust that we didn't know could be cleaned. Within 12 months, we recovered 99.6% uptime and eliminated unplanned mid-shift stoppages entirely. The robots we already owned became the robots we thought we had purchased."
Director of Warehouse Operations3PL Fulfillment Center, Southeast USA
The Architecture Behind 99.6% Uptime
What Genuine AMR Fleet Intelligence Requires
Recovering a 60-unit fleet from 81% to 99.6% uptime required four interdependent systems working continuously. The OEM fleet management platform handled navigation and task dispatch — but it had no concept of component health, no ability to detect degradation curves, and no mechanism to schedule preventive interventions. iFactory provided the intelligence layer that filled every gap:
Per-Unit Fleet Health Scoring
Every robot receives a continuously updated health score (0-100) based on battery state-of-health, wheel tread depth, LiDAR calibration recency, motor current variance, charge cycle count, and navigation error rate. Scores below 70 trigger automated PM work orders before failure occurs.
Predictive Degradation Detection
AI models trained on historical telemetry data identify component degradation curves 2-6 weeks before functional failure. Drive motor current trending predicts bearing wear 4-8 days ahead. Battery voltage sag patterns forecast capacity replacement needs 4-6 months out.
Charging Window Automation
iFactory schedules all PM events during the overnight charging window — the 4-hour period when all robots are docked. Fault-to-work-order automation pre-populates repair context so technicians execute immediately rather than spending 47 minutes gathering history.
Fleet-Level Pattern Analytics
Cross-fleet analytics identify which robot models degrade fastest, which routes cause the most wear, which shifts correlate with elevated fault rates. These insights drive PM interval optimization, route design changes, and fleet expansion planning based on real wear data.
RECOVER YOUR AMR FLEET PERFORMANCE
Get a Predictive Fleet Health Assessment for Your Warehouse
iFactory's robotics engineering team will connect to your AMR fleet telemetry, establish health baselines per robot, and deliver a structured ROI analysis showing exactly how much throughput and uptime your fleet can recover.
What caused the AMR fleet uptime to drop from 97% to 81%?
The degradation was caused by six simultaneous failure modes that went unmonitored: wheel tread wear causing odometry drift, LiDAR sensor contamination from warehouse particulate, battery capacity fade from improper charging protocols, motor bearing wear undetected without current monitoring, firmware version drift across the fleet, and charging contact oxidation. Without component-level health tracking, each failure mode accumulated silently until the cumulative impact appeared as uptime loss.
How does iFactory detect AMR component degradation before failure?
iFactory integrates with AMR fleet telemetry via REST API, MQTT, or OPC-UA to ingest motor current, battery voltage, navigation error rates, charge cycle counts, and sensor calibration status. AI models compare each robot's real-time data against its own healthy baseline — detecting trends like rising motor current (bearing wear), increasing navigation error rate (LiDAR drift), or voltage sag under load (battery degradation) 2-6 weeks before functional failure.
Does iFactory replace the OEM fleet management software?
No. iFactory works alongside existing OEM fleet management platforms (Locus, MiR, Fetch, Geek+, and others) by adding the maintenance intelligence layer that OEM software was never designed to provide. The OEM platform continues to handle navigation and task dispatch. iFactory handles component health tracking, predictive degradation detection, PM scheduling, and work order automation.
How long does it take to deploy iFactory on an existing AMR fleet?
API integration is typically live within 72 hours. Health baselines become reliable predictors at week 6 — before that, the system provides real-time health data with building predictive accuracy. Full predictive operations with accurate 3-5 day warning windows are achieved by week 8-10. The 60-unit fleet in this case study reached 99.6% uptime at month 12.
What throughput value can a typical AMR fleet recover with iFactory?
A 60-unit fleet running at 81% uptime is not delivering 60 robots of productivity — it is delivering 48. The gap between 81% and 99.6% represents 11 additional robots of effective capacity from the same hardware. In this deployment, recovered throughput value was $312,000 annually. For a 30-unit fleet, typical recovery ranges from $90,000 to $180,000 per year depending on order volume and peak window requirements.
.png)