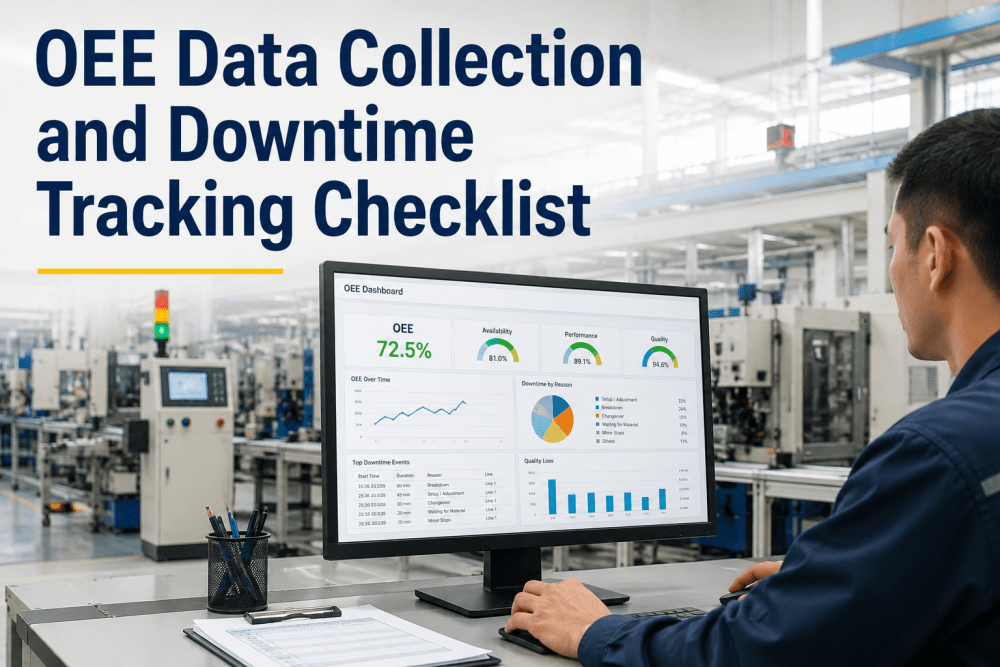
OEE measurement only works when the data behind it is consistent. A single shift that codes downtime as "unplanned stop" instead of the specific reason — bearing failure, material jam, operator absence — wipes out the trend data your reliability team needs to act on. This checklist standardizes how every shift, on every line, collects availability, performance and quality data so your OEE dashboard reflects what actually happened on the floor — not what was easiest to log at the end of a rushed shift.
OEE Data Collection and Downtime Tracking Checklist
Standardize downtime reason coding, speed loss recording, quality defect logging, and shift handover across every line and every shift — so your OEE number means something.
Inconsistent Data Is the Silent OEE Killer
Most plants with OEE below 65% don't have a machine problem — they have a data problem. When two operators code the same stoppage two different ways, when speed losses go unrecorded because "the line was still running," or when quality rejects from the previous shift get logged in the current shift's numbers, your OEE figure becomes an average of noise. You can't improve what you can't measure accurately.
The checklist below is structured around the three OEE components — Availability, Performance, and Quality — plus the shift handover process that keeps data continuous across crew changes. Each section is designed for use at the machine level, by the operator or team lead, during the shift or immediately at shift end.
Downtime Recording and Reason Code Checklist
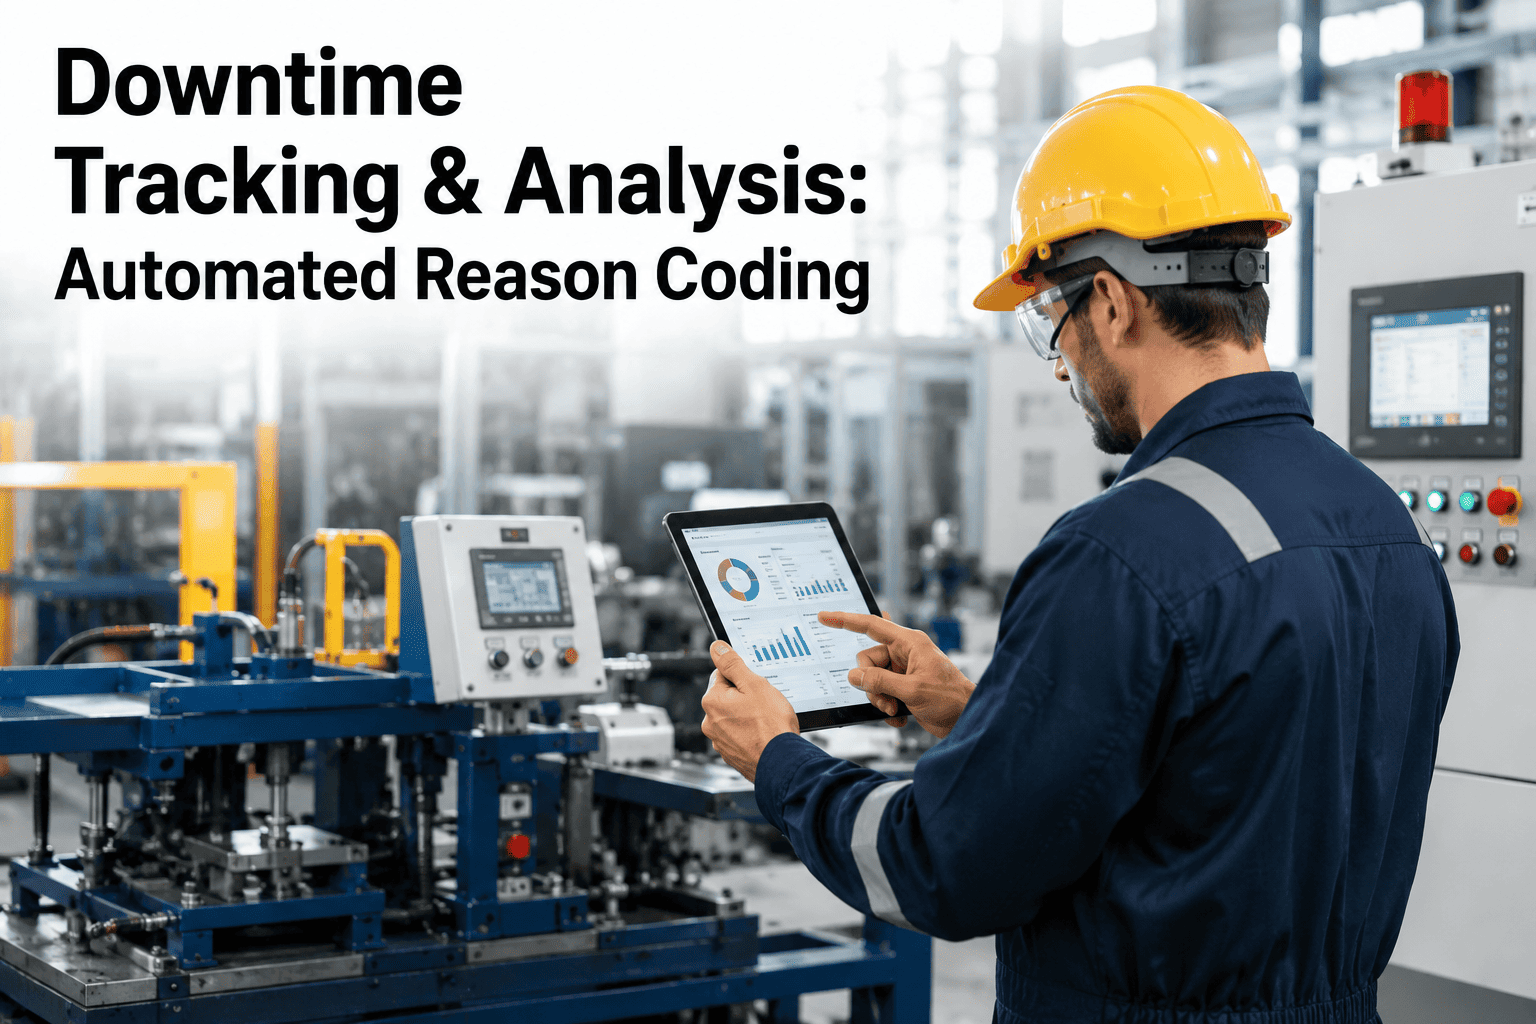
Availability losses are the most impactful OEE component to track — and the most frequently miscoded. Every unplanned stoppage of two minutes or more should be logged with a specific reason code, not a catch-all category. Use the checklist below at each unplanned stop and at shift end to verify all events are captured.
Speed Loss and Reduced Rate Recording Checklist
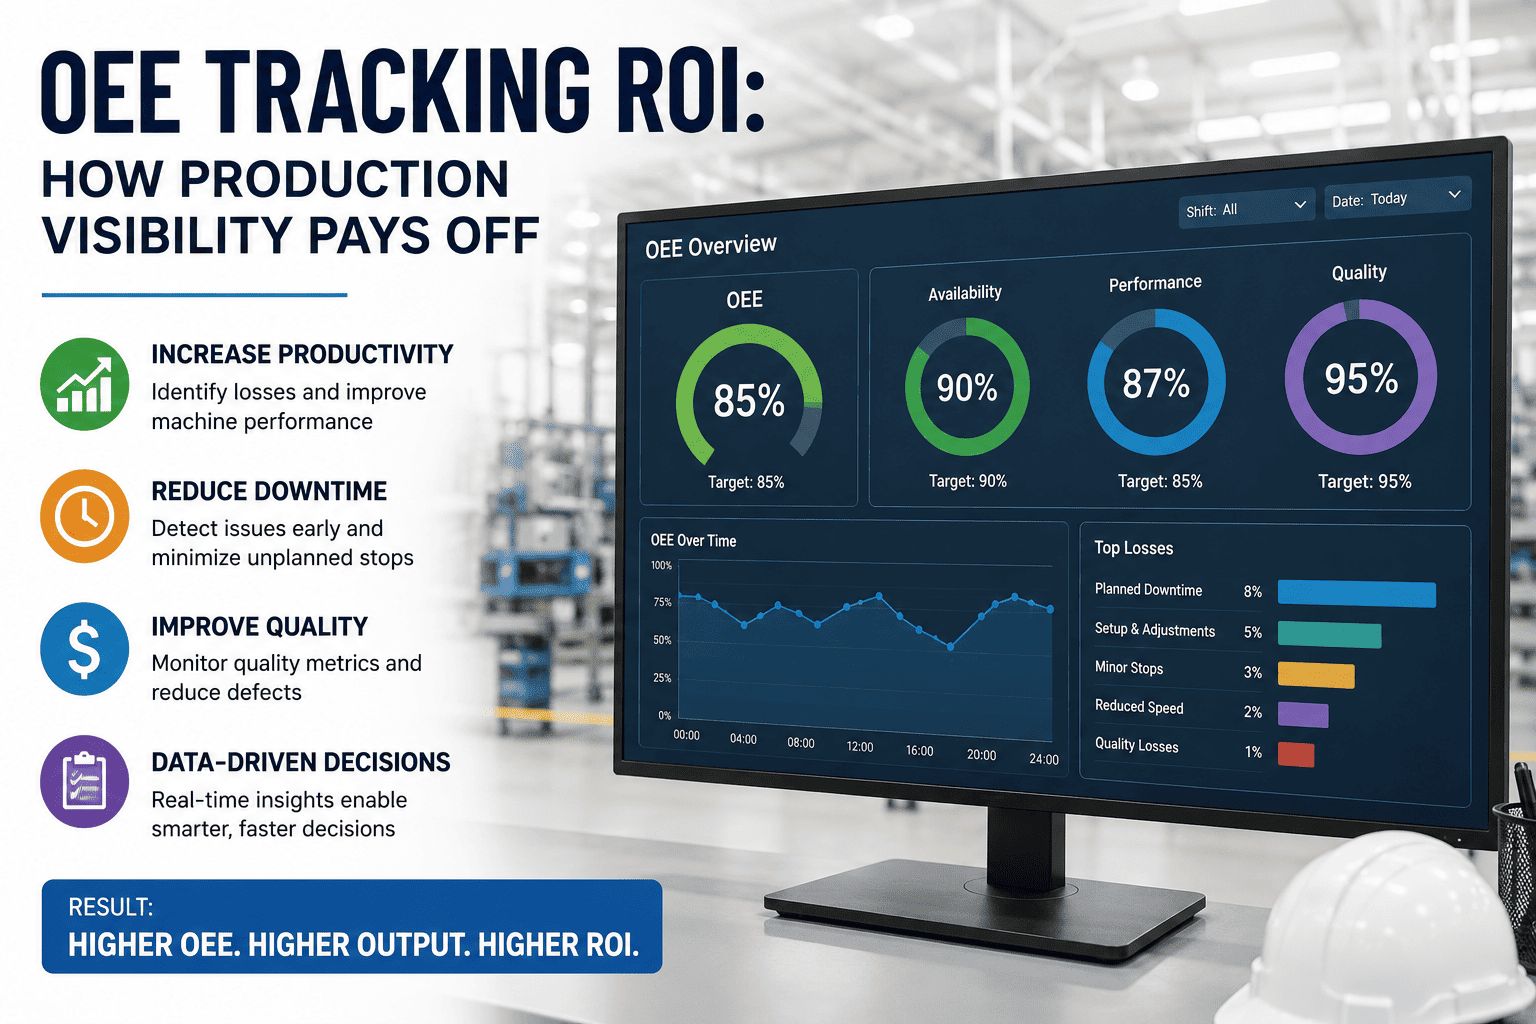
Performance losses are the most underreported OEE component. When a line runs at 85% of its ideal rate for an entire shift, operators rarely flag it — the line is running, product is moving, and no alarm fired. But that 15% speed gap is a real loss that compounds across every shift. This checklist captures it.
Defect, Reject, and Rework Logging Checklist
Quality losses are the most straightforward OEE component to measure — but only if rejects are counted at the point of production, not at final inspection. A defect caught three stations downstream was still produced during the shift where it was created. Log it there.
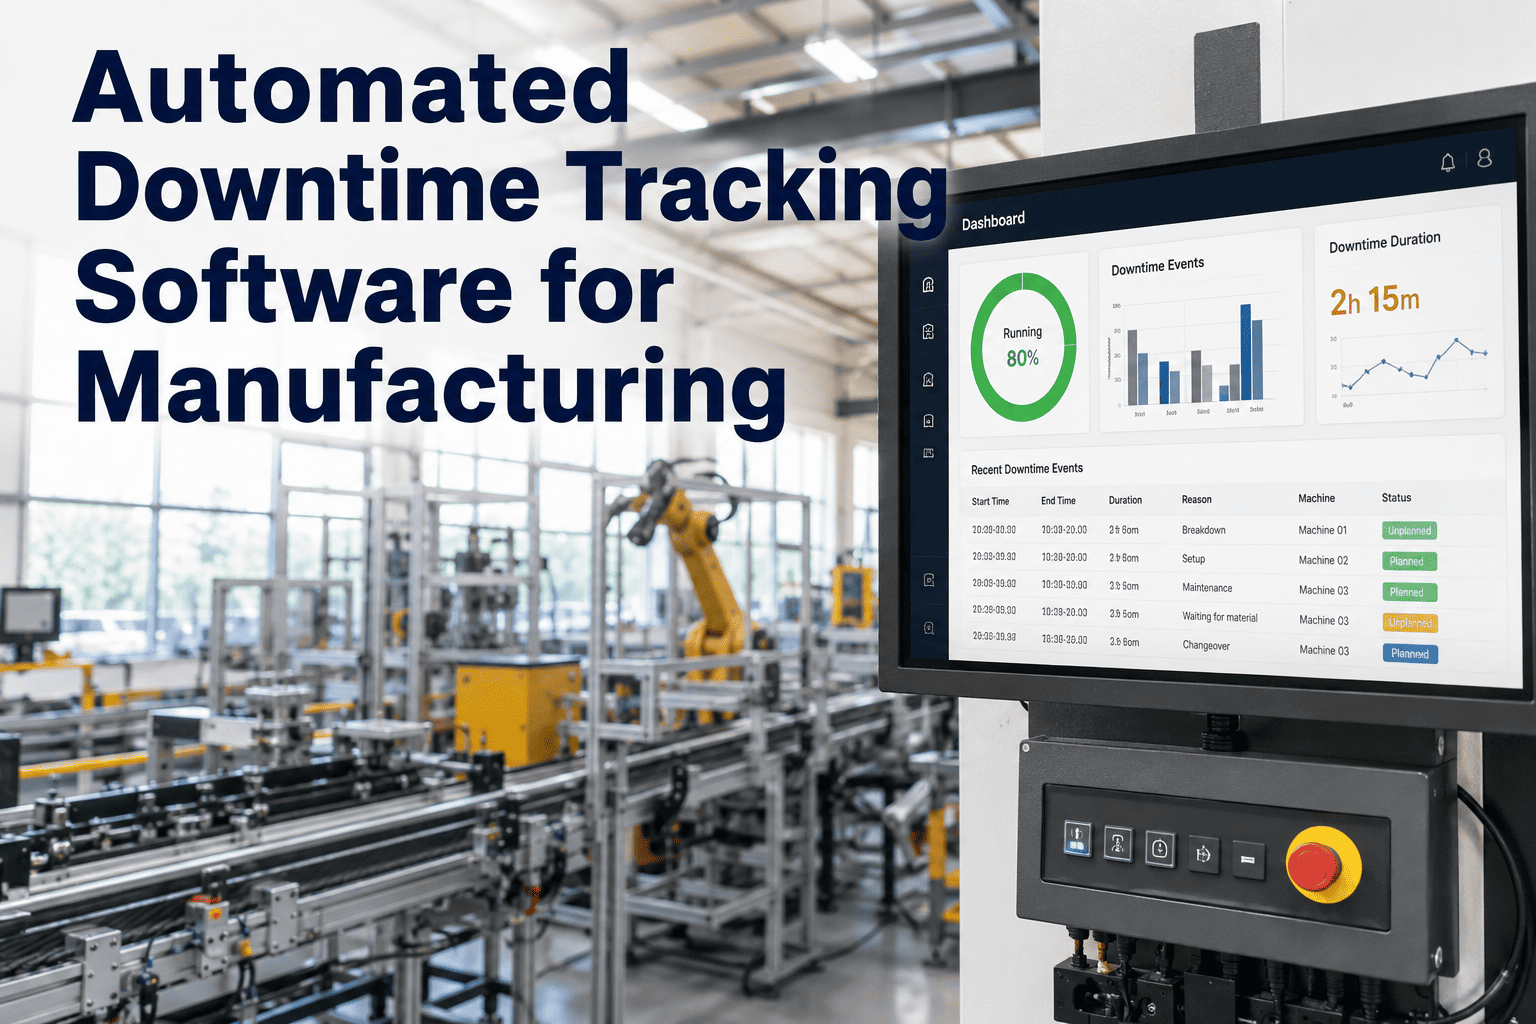
iFactory's OEE Analytics module connects directly to your line PLCs and operator terminals to capture downtime events, speed data, and reject counts automatically — with reason code prompts that appear on the operator screen the moment a stop is detected. Book a demo to see how it works in a live plant environment.
Shift Handover and Data Continuity Checklist
Shift boundaries are where OEE data breaks down most often. A downtime event that starts in one shift and ends in the next needs to be properly allocated. A quality issue discovered at the start of the incoming shift may have originated in the previous one. The handover checklist closes these gaps.
Recommended Downtime Reason Code Hierarchy
A well-structured reason code list is the foundation of actionable OEE data. The table below shows a three-level hierarchy — Category, Subcategory, and Specific Code — that covers the majority of manufacturing downtime events. Adapt it to your equipment and processes, but maintain the three-level structure.
| Category | Subcategory | Example Specific Codes | OEE Component |
|---|---|---|---|
| Mechanical | Drive System | Bearing failure, Belt slip, Coupling failure, Gearbox fault | Availability |
| Mechanical | Tooling & Fixturing | Tool wear, Tool breakage, Fixture misalignment, Worn guide | Availability |
| Electrical | Control System | PLC fault, Sensor failure, HMI lockup, Communication loss | Availability |
| Electrical | Power Supply | Power outage, Voltage fluctuation, Drive trip, Overload | Availability |
| Material | Supply | Material starved, Lot changeover, Material jam, Out of stock | Performance |
| Material | Quality | Off-spec material, Wrong lot, Material contamination, Dimension variation | Quality |
| Process | Setup & Adjustment | Changeover, Parameter adjustment, First-off inspection, Trial run | Availability |
| Process | Speed Reduction | Reduced rate — tooling, Reduced rate — material, Reduced rate — operator | Performance |
| Quality | Defect Type | Dimensional, Surface finish, Assembly error, Contamination, Functional | Quality |
| Planned | Maintenance | Scheduled PM, Lubrication, Calibration, Inspection | Planned (Excluded) |
Replace Paper Logs and Spreadsheets With Real-Time OEE Data
iFactory connects to your line PLCs and operator terminals, captures downtime events automatically, and gives your team a structured reason code interface at the machine. Your OEE dashboard updates in real time — no end-of-shift data entry required.
How to Roll Out This Checklist Across Shifts
A checklist only delivers value when it's used consistently by every operator on every shift. The four-step rollout below has been validated across multi-shift discrete and process manufacturing environments.
Baseline Your Current Codes
Pull the last 90 days of downtime data. Identify which reason codes account for more than 5% of "Other" usage. These are the codes missing from your current list. Add them before any training begins.
Train Operators on the Code List — Not the System
Operators need to understand what each reason code means physically — not how to navigate software. Thirty minutes of discussion at shift change, using real examples from their own line, is more effective than any e-learning module.
Run a Parallel Pilot for Two Weeks
Run the new checklist alongside your existing logging process for two weeks. Compare the outputs daily. Where they diverge, investigate whether the checklist is capturing a real event that was previously missed, or whether there is a training gap.
Review Code Usage Weekly and Prune
Any code with zero usage after 30 days is either irrelevant to this line or not understood by operators. Remove or rename it. A short, clear code list used consistently outperforms a comprehensive list used inconsistently every time.
What Plant Managers Get Wrong About OEE Data Collection
The single most common mistake I see in OEE implementations is treating data collection as an IT project rather than an operations discipline. Plants invest in software, configure dashboards, and then discover after three months that their OEE trend lines are flat — not because performance hasn't changed, but because the underlying data is inconsistent across shifts.
The second mistake is deploying OEE measurement without first standardizing reason codes at the machine level. I've worked with plants running 200-item reason code lists that operators navigate on a touchscreen during an active stoppage. The result is predictable: operators select the first plausible option and get back to running the line. The data looks complete but means nothing.
The plants that get real value from OEE — the ones where a 3-point improvement in performance is traceable to a specific tooling change or a revised changeover procedure — all share one characteristic: they treat data quality as a production metric, not an administrative function. They review reason code usage in the same weekly meeting where they review output and waste. That accountability loop is what makes the difference.
OEE Is Only as Good as the Data Behind It
The checklists in this guide — downtime logging, performance tracking, quality recording, and shift handover — cover the four points where OEE data most frequently breaks down in real plant environments. None of these are complicated processes. They become complicated only when they are inconsistently applied across shifts or when the reason code structure doesn't match the actual failure modes on the floor.
iFactory's OEE Analytics module automates the data capture layer — pulling events directly from your PLCs and presenting reason code prompts to operators at the moment of each stoppage — so that the discipline captured in this checklist is built into the workflow rather than dependent on operator memory at end of shift. The result is OEE data accurate enough to drive equipment investment decisions, maintenance strategy changes, and process improvement priorities with confidence.
Start with one line, one shift, and the availability checklist. Get that right before expanding. Consistent data from one line is more valuable than inconsistent data from twenty.
OEE Data Collection — Common Questions
See iFactory OEE Analytics in a Live Plant Environment
We connect to a live iFactory instance and walk you through exactly how downtime events are captured, reason codes are presented to operators, and OEE dashboards update in real time. No slides. No mockups.