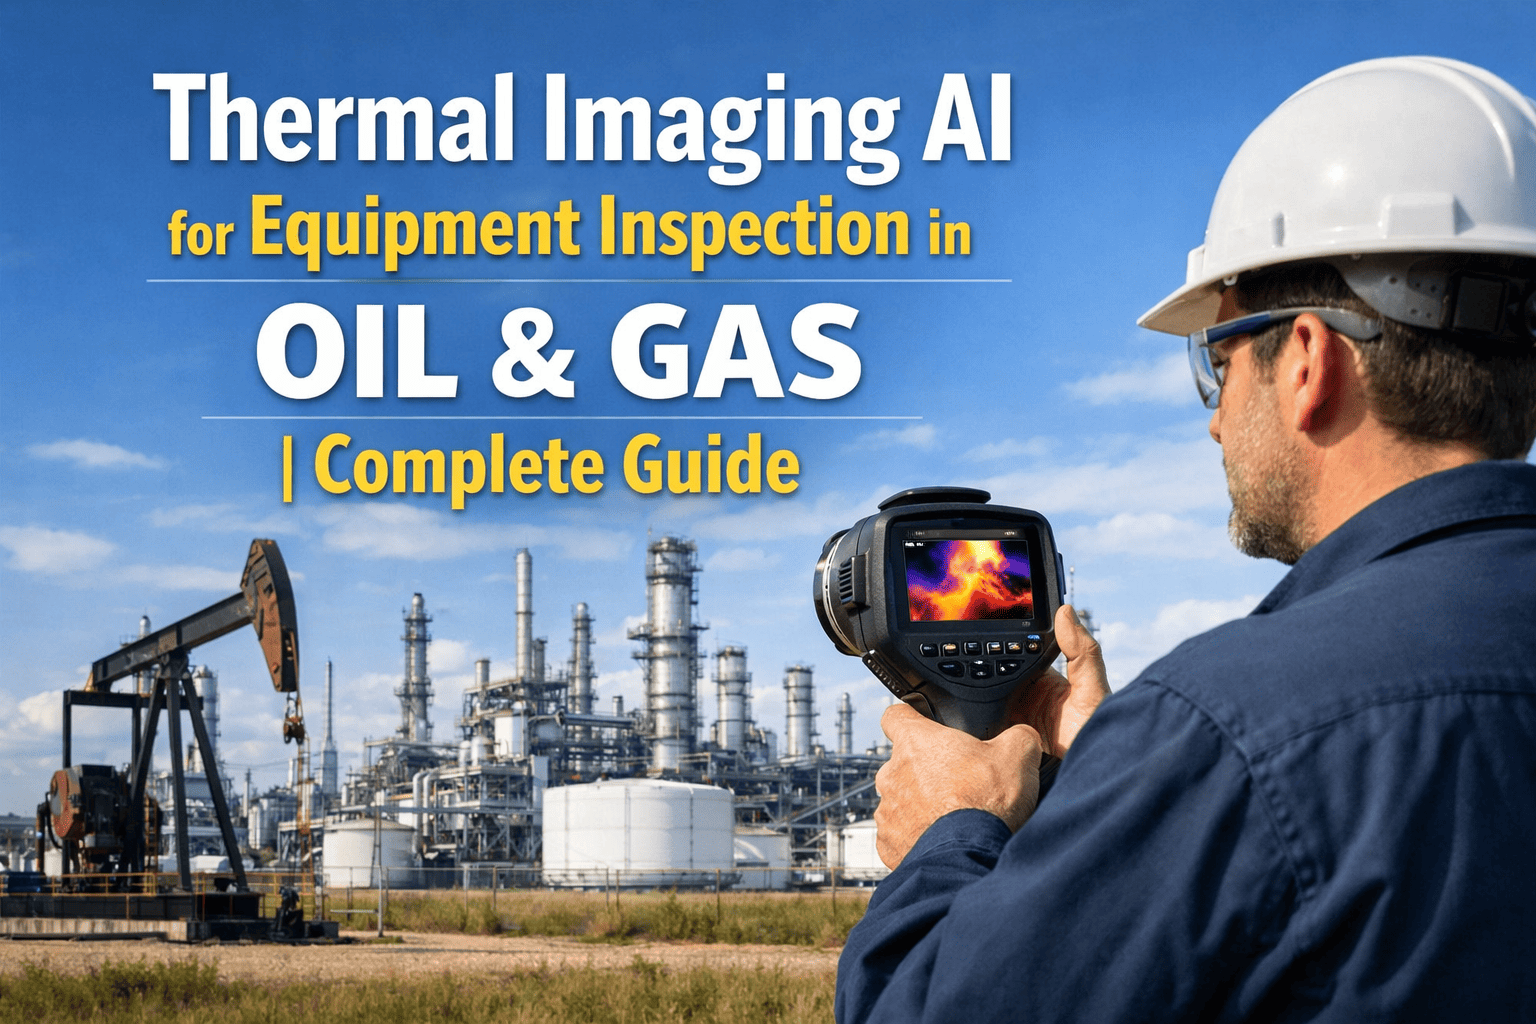
Conventional handheld thermal cameras require trained technicians performing monthly or quarterly facility walkarounds generating static images lacking trend analysis, historical comparison, or automated anomaly detection, resulting in inconsistent coverage across 24/7 operations, delayed failure detection during off-shift periods, and subjective interpretation variability between inspectors missing subtle temperature changes indicating equipment degradation progression. iFactory's AI-powered thermal imaging platform deploys fixed-mount infrared cameras with edge analytics continuously monitoring critical assets, automatically detecting temperature anomalies through machine learning models trained on normal operating baselines, generating predictive alerts 30-60 days before failure threshold with 94% accuracy, and integrating inspection findings directly into CMMS work order systems enabling condition-based maintenance scheduling that reduces unplanned downtime 62% while eliminating 45% of unnecessary preventive maintenance tasks. Book a demo to see thermal imaging AI for your oil and gas operations.
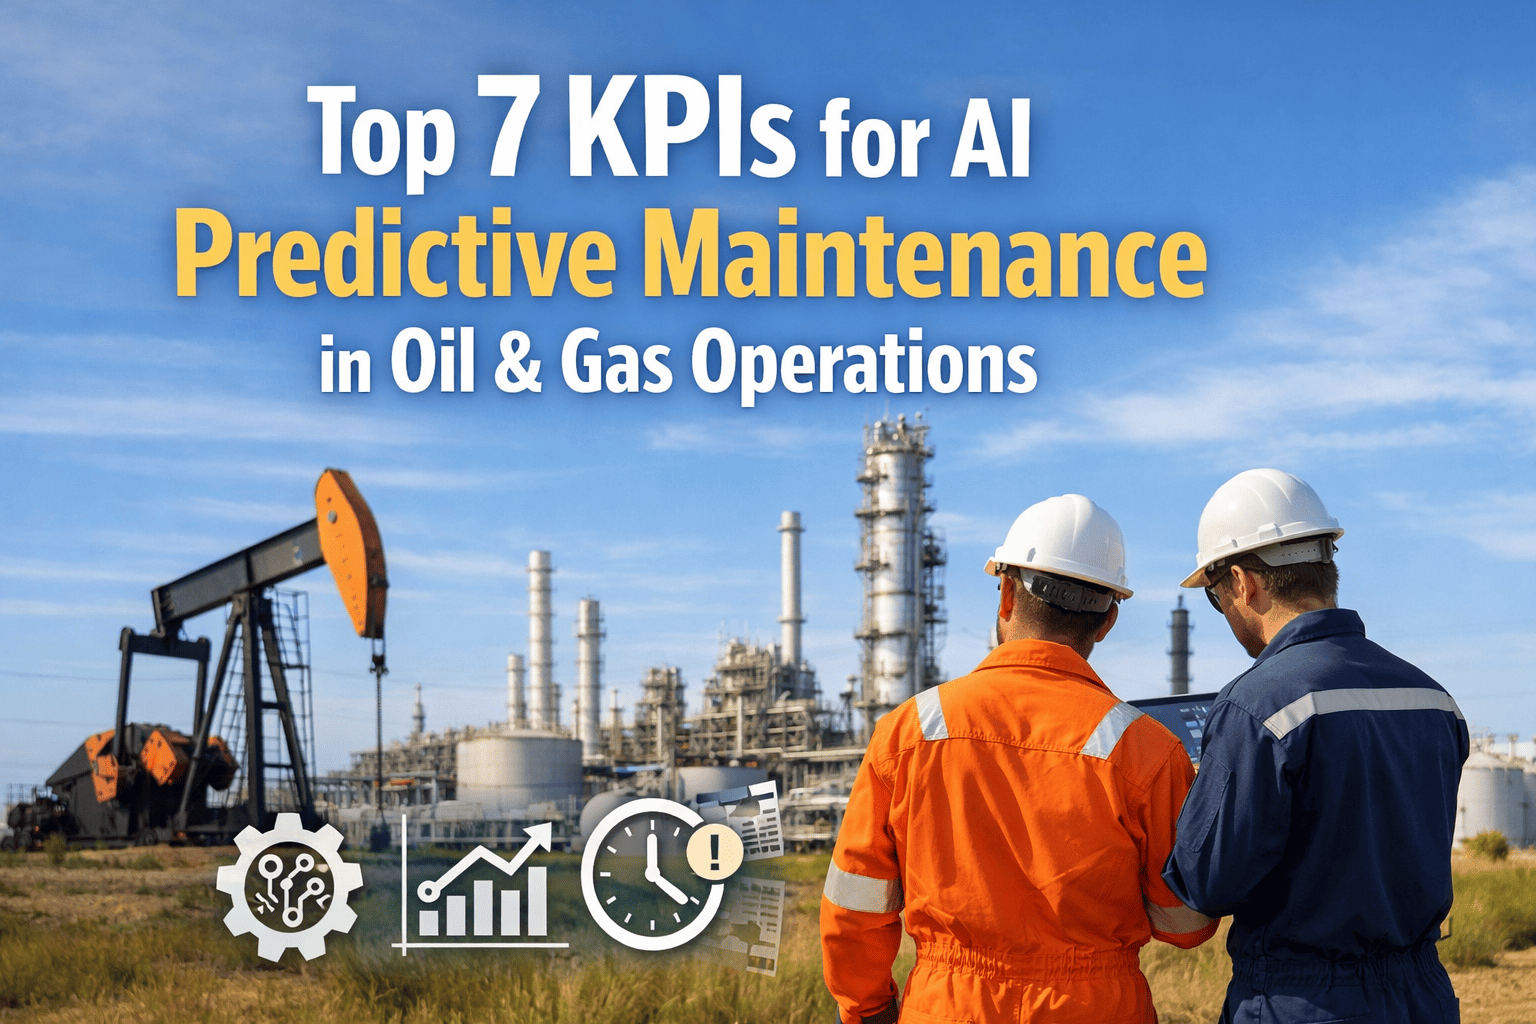
The Complete AI Platform for Oil & Gas Operations
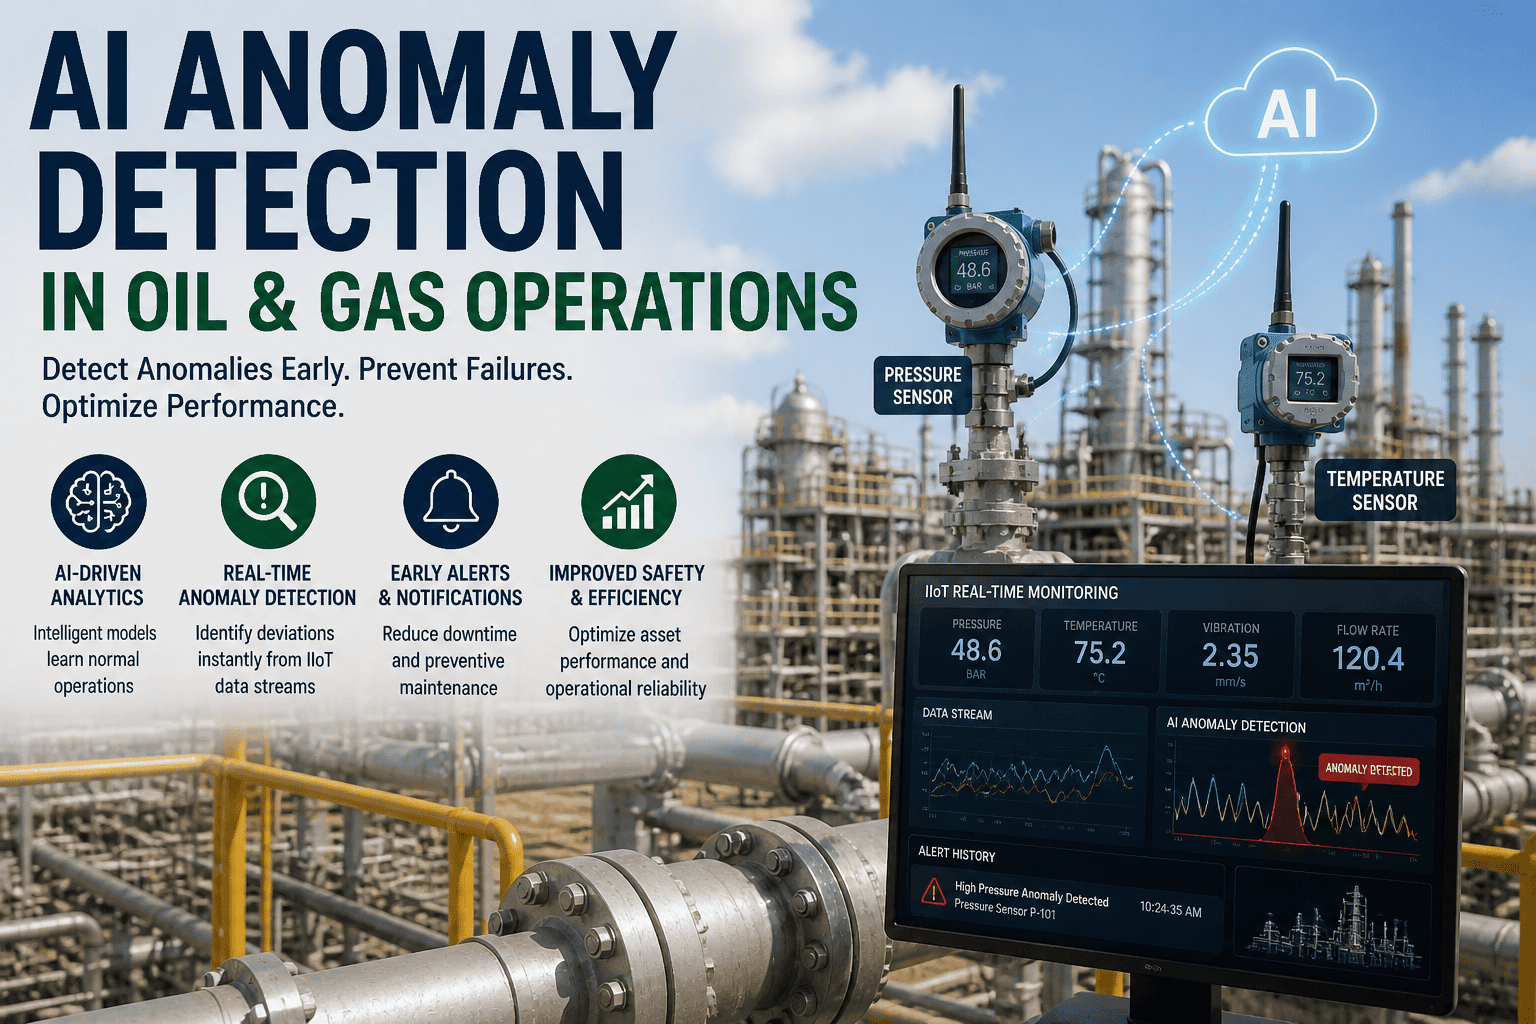
AI Eyes That Detect Leaks Before They Escalate
Deploy continuous thermal monitoring across refineries, gas plants, and pipeline facilities with AI-powered anomaly detection identifying equipment failures 30-60 days in advance, achieving 94% prediction accuracy while reducing inspection labor 70%.
Understanding Oil and Gas Operations and Equipment Criticality
Oil and gas operations span three primary segments requiring distinct thermal inspection approaches based on equipment criticality, operating temperatures, and failure consequences. Upstream exploration and production facilities monitor wellhead equipment, separation vessels, and compressor stations where equipment failures halt production impacting daily revenue. Midstream pipeline operations track pump stations, valve assemblies, and compression facilities where thermal anomalies indicate developing leaks, corrosion, or mechanical degradation threatening pipeline integrity. Downstream refining and processing plants inspect distillation columns, heat exchangers, furnaces, and catalytic crackers operating at extreme temperatures where thermal deviations signal process upsets, catalyst deactivation, or equipment damage requiring immediate intervention preventing cascading failures across integrated process units.
1
Upstream Production Facilities
Wellhead equipment, separation vessels, compressor stations, and gas treatment units operate continuously in remote locations with limited inspection access. Thermal imaging detects gas leaks (cold spots from Joule-Thomson expansion), compressor bearing failures (elevated temperatures 40-80°F above baseline), separator level control issues (abnormal vessel wall temperatures), and electrical cabinet hotspots from loose connections or overloaded circuits. AI models trained on normal operating patterns identify anomalies accounting for ambient temperature variations, process load changes, and equipment cycling patterns, reducing false positive alerts from 35% (threshold-based systems) to under 8% with contextual analysis.
2
Midstream Pipeline and Transport
Pipeline networks spanning hundreds of miles include pump stations, valve assemblies, metering facilities, and compression units requiring inspection across distributed infrastructure. Thermal cameras monitor pump bearing temperatures (normal 140-160°F, failure indicated by gradual rise to 180°F+ over 2-4 weeks), valve stem packing leaks (cold signature from product escaping), pipeline insulation degradation (heat loss patterns), and electrical motor hotspots indicating winding failures or phase imbalance. Fixed cameras at critical locations provide 24/7 monitoring versus monthly manual inspections missing failures occurring between inspection cycles, while drone-mounted thermal sensors inspect remote pipeline segments identifying coating damage, cathodic protection failures, and third-party interference from temperature anomalies.
3
Downstream Refining and Processing
Refineries and gas processing plants operate complex equipment at extreme temperatures requiring precision thermal monitoring. Furnace tube inspections detect hot spots indicating coking or tube failure risk (localized temperatures 50-100°F above surrounding tubes), heat exchanger fouling appears as temperature distribution changes across tube bundles, distillation column tray damage shows abnormal temperature profiles between stages, and rotating equipment (pumps, compressors, turbines) exhibits bearing temperature trends predicting imminent failures. Integration with DCS and historian systems correlates thermal data with process parameters (flow rates, pressures, compositions) enabling root cause analysis: elevated bearing temperature plus increased vibration plus decreased throughput indicates impeller wear requiring replacement during next planned shutdown.
Critical Industry Challenges Driving Thermal Imaging AI Adoption
Oil and gas operators face interconnected challenges making manual thermal inspection programs inadequate for preventing costly equipment failures and safety incidents in modern operations.
Critical equipment failures in oil and gas facilities cost $250,000-$850,000 per hour in lost production, with major component replacements (compressor rebuilds, turbine overhauls, heat exchanger replacements) ranging $2-$8 million including parts, labor, and extended outage duration. Electrical equipment failures from loose connections, overloaded circuits, or insulation breakdown cause 40% of unplanned shutdowns, all exhibiting detectable thermal signatures weeks before failure. Mechanical failures (bearing degradation, misalignment, imbalance) generate elevated temperatures 15-45 days before catastrophic failure, providing intervention window if detected early through continuous monitoring versus monthly manual inspections.
Product leaks from pipeline corrosion, mechanical damage, or valve packing failures create safety hazards, environmental incidents, and regulatory violations with cleanup costs averaging $1.5-$8 million per significant release. Small leaks exhibit cold thermal signatures from pressure drop and Joule-Thomson cooling effect, detectable weeks before leak rate increases to visible levels. Internal corrosion and erosion create wall thickness reductions changing heat transfer characteristics visible in thermal images before through-wall failure occurs. Manual pipeline patrols inspect centerline every 7-30 days missing leaks developing between inspection cycles, while continuous thermal monitoring detects anomalies within hours of onset enabling prompt repair before escalation.
Inspectors performing thermal surveys in operating facilities face hazards including H2S exposure, explosive atmospheres, extreme temperatures, elevated work platforms, and confined spaces requiring extensive PPE, gas monitoring, and work permits. Manual inspection programs cover 15-25% of facility assets monthly due to access limitations, shift coverage gaps, and inspector availability, missing failures occurring on uninspected equipment or between inspection cycles. Handheld thermal camera surveys generate static images lacking trend analysis or automated anomaly detection, requiring manual review of hundreds of images per survey with subjective interpretation varying between inspectors and missing subtle temperature changes indicating early degradation.
Thermal inspection data, vibration monitoring, process control systems, and maintenance management operate as isolated systems preventing integrated equipment health analysis. SCADA historians capture process parameters (temperatures, pressures, flows) but lack correlation with thermal imaging detecting equipment degradation invisible to process sensors. Vibration monitoring systems identify mechanical issues but miss electrical failures and thermal process upsets detected through infrared inspection. CMMS tracks maintenance history but receives inspection findings through manual data entry weeks after thermal surveys complete, preventing timely work order generation and delaying corrective actions until next planned maintenance window rather than addressing findings immediately based on criticality.
Traditional thermal inspection programs capture point-in-time temperature measurements without historical trending, baseline comparison, or predictive analytics forecasting time-to-failure. Static thermal images from quarterly surveys show current conditions but provide no context whether observed temperatures represent normal operation, gradual degradation, or accelerating failure progression. Manual trending requires inspectors plotting temperature data in spreadsheets comparing current readings against previous surveys, consuming significant analysis time and missing opportunities for early intervention. Lack of predictive models prevents maintenance planning optimization: work orders generated reactively after failures occur rather than proactively scheduling repairs during planned outages based on predicted failure timelines.
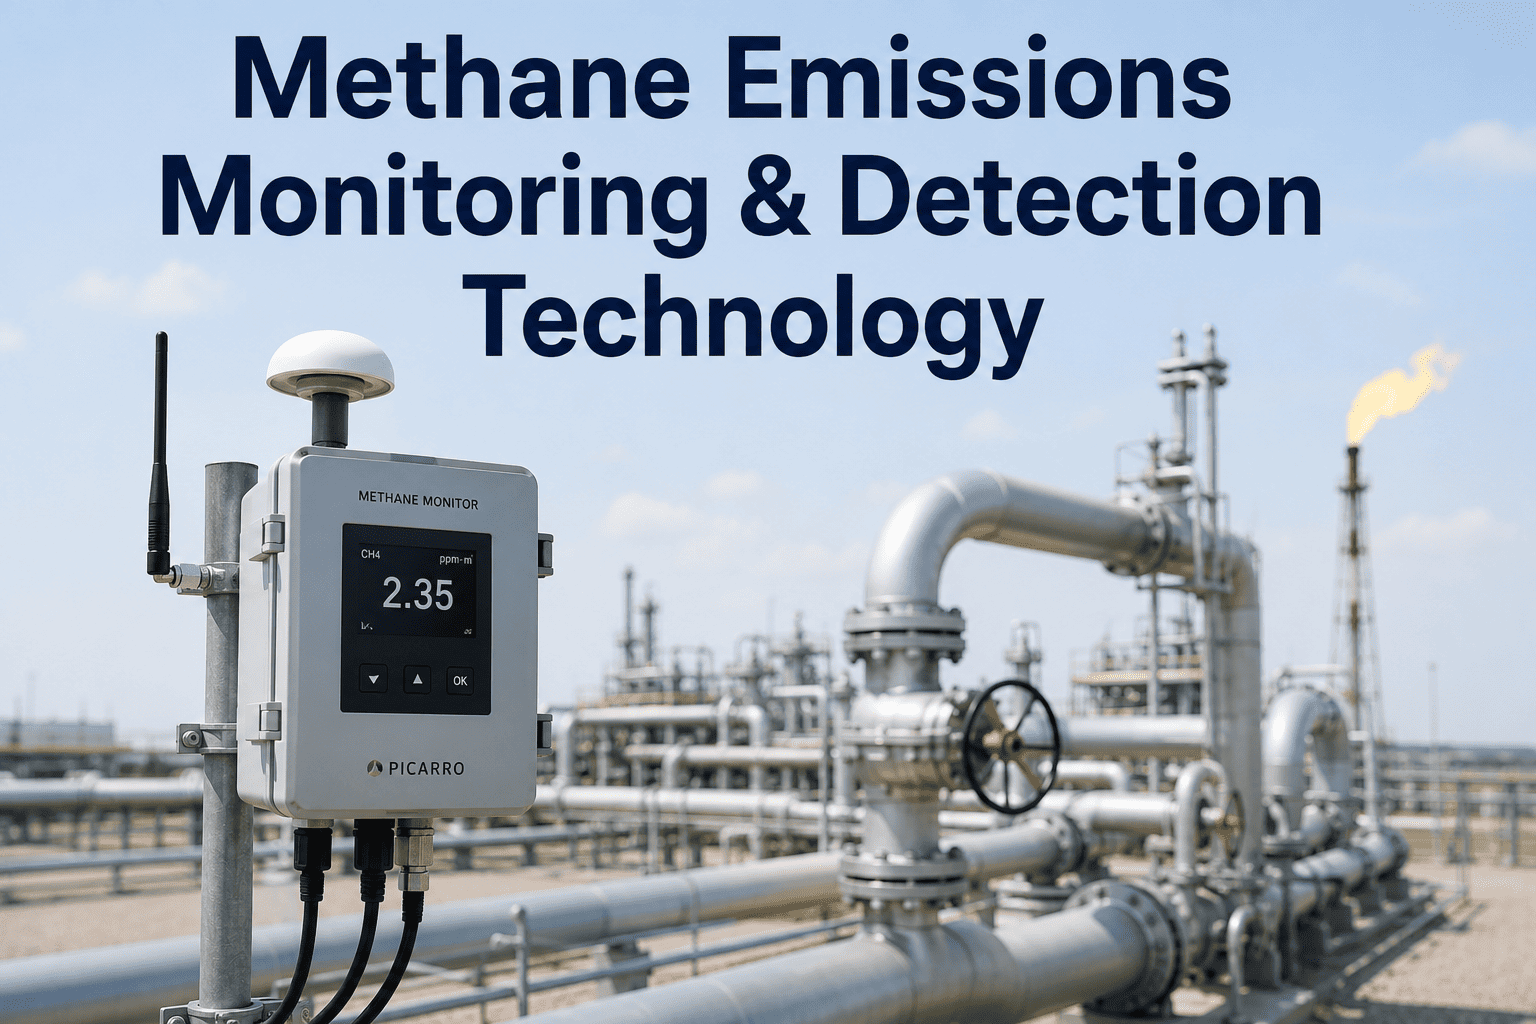
Methane emissions from equipment leaks, valve packing failures, and flange connections face increasing regulatory scrutiny under EPA methane regulations, state leak detection and repair (LDAR) programs, and voluntary ESG commitments. Thermal cameras detect methane leaks through temperature differentials but manual surveys provide snapshot data insufficient for continuous emissions monitoring and regulatory reporting. ESG reporting requires documented inspection frequencies, leak detection methodologies, repair timelines, and emissions quantification from thermal survey data, currently compiled manually from inspection records, work orders, and engineering calculations consuming weeks of effort per reporting period and lacking audit trail verification demonstrating inspection program effectiveness.
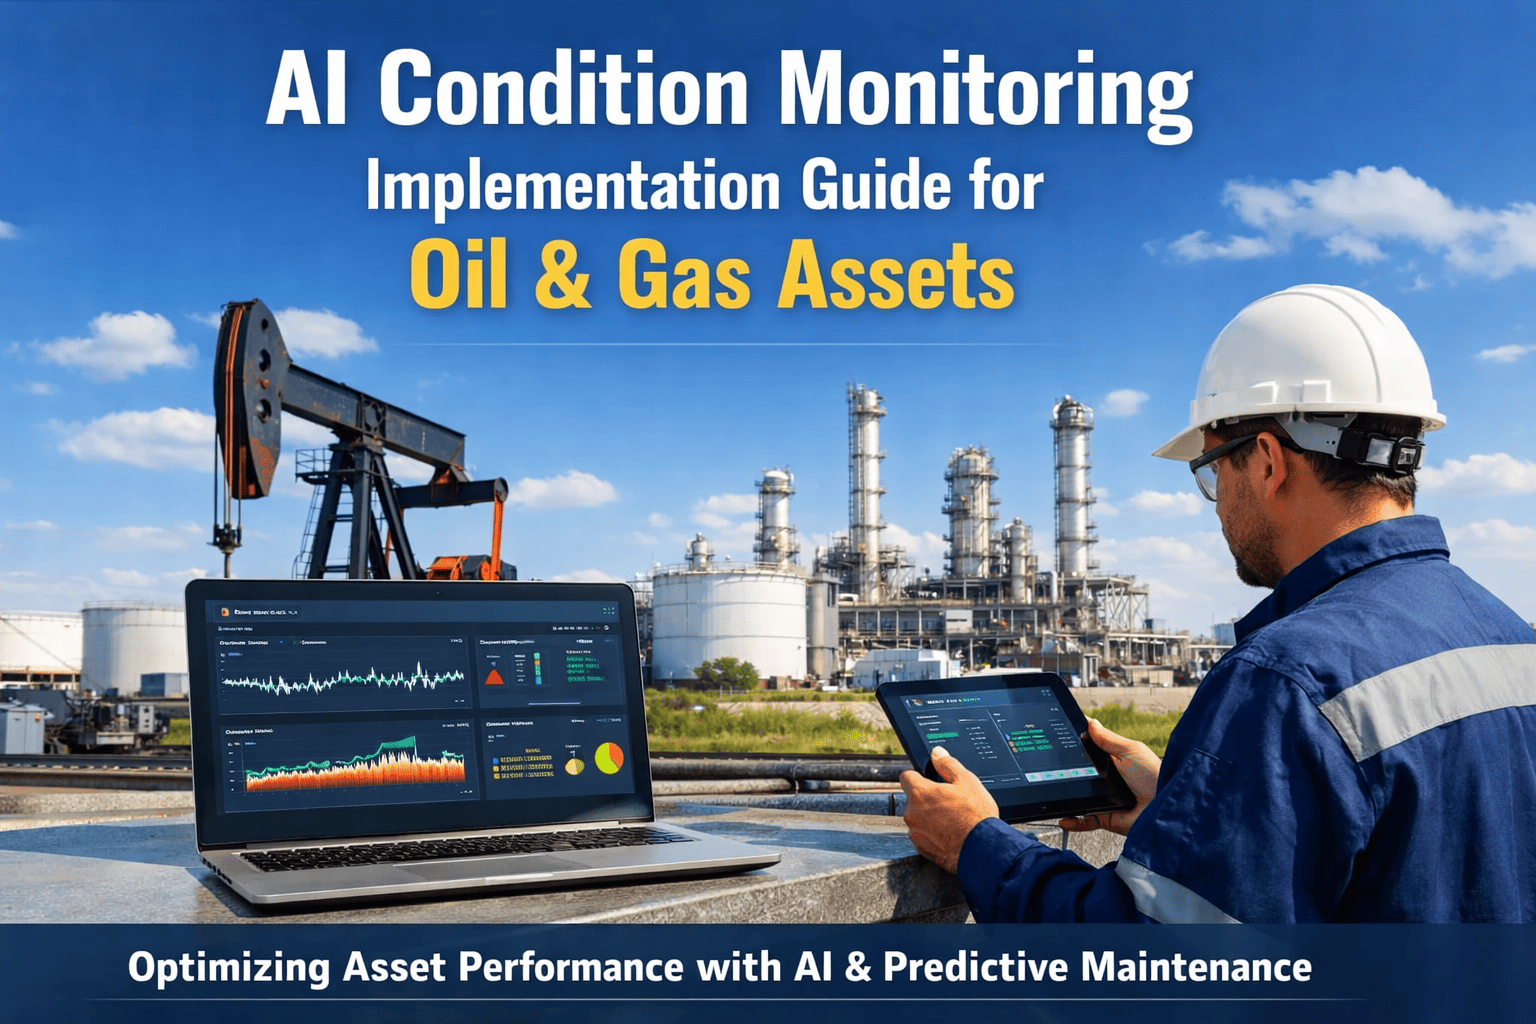
How iFactory Solves Thermal Inspection Challenges
One Platform, Every Segment: 8 AI-Powered Modules for Complete Oil and Gas Operations. iFactory integrates thermal imaging with predictive analytics, automated work orders, and compliance documentation into unified platform addressing interconnected operational challenges.
AI Vision and Inspection
Fixed-mount thermal cameras with edge AI analytics continuously monitor critical equipment, automatically detecting temperature anomalies through machine learning models trained on facility-specific operating baselines. System accounts for ambient temperature variations, process load changes, equipment cycling patterns, and seasonal effects, reducing false positive alerts 82% versus threshold-based systems while detecting genuine anomalies missed by manual inspections occurring between survey cycles.
Robots That Inspect Where Humans Cannot Safely Go
Autonomous robots and drones equipped with thermal cameras inspect elevated equipment, confined spaces, and hazardous areas eliminating human exposure to H2S, explosive atmospheres, and fall hazards. Robotic inspections operate during normal production without hot work permits, confined space entry procedures, or scaffolding erection, completing facility surveys 75% faster than manual inspections while capturing consistent image quality from repeatable inspection routes enabling accurate period-to-period comparison for trend analysis.
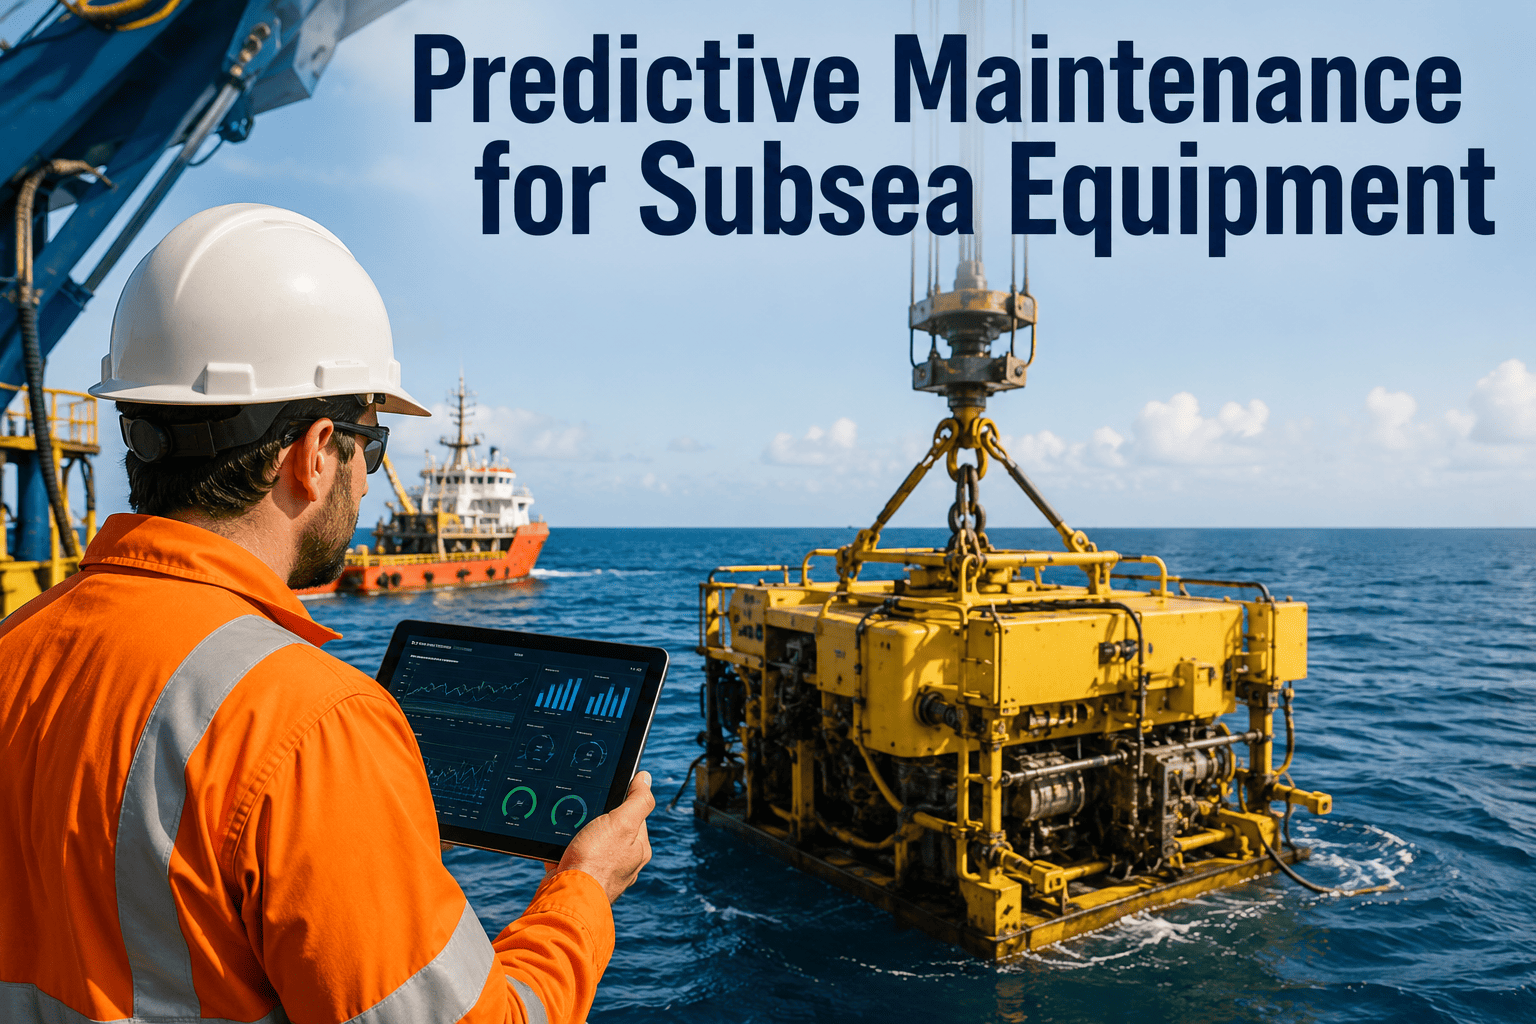
Predictive Maintenance with Failure Forecasting
Machine learning models analyze thermal trend data predicting equipment failures 30-60 days in advance with 94% accuracy, calculating remaining useful life based on temperature progression rates, equipment criticality, and historical failure patterns. Predictions integrate with maintenance planning systems scheduling repairs during planned outages rather than emergency response to catastrophic failures, optimizing labor utilization, parts procurement, and production scheduling while reducing unplanned downtime 62% and eliminating 45% of unnecessary time-based preventive maintenance tasks performed on healthy equipment.
Work Order Automation
Thermal anomalies automatically generate CMMS work orders including defect location, severity classification, thermal images, trend charts, and recommended corrective actions eliminating manual data entry and reducing finding-to-repair cycle time from 14-30 days (manual workflow) to 2-5 days (automated workflow). Work order prioritization algorithms consider equipment criticality, predicted time-to-failure, production impact, and resource availability, optimizing maintenance schedules balancing failure risk against operational constraints and labor capacity ensuring highest-risk equipment receives attention before lower-priority items.
Asset Lifecycle Management
Complete equipment history tracking from installation through operation to replacement including thermal inspection records, failure events, repair actions, and performance trends enabling data-driven asset replacement decisions. Analytics identify chronic problem equipment requiring capital replacement versus repair, optimize spare parts inventory based on failure frequency analysis, and support regulatory compliance demonstrating inspection program effectiveness through documented findings, corrective actions, and verification of repairs completed. Asset health scoring algorithms aggregate thermal data, vibration monitoring, process performance, and maintenance history into unified equipment condition assessment guiding capital planning and reliability improvement initiatives.
Connects to Your Existing DCS/SCADA and Historians
Bidirectional integration with DCS, SCADA, and process historians correlates thermal imaging data with process parameters (temperatures, pressures, flows, compositions) enabling root cause analysis of equipment degradation. Thermal anomalies trigger DCS alarms notifying operators of developing equipment issues, while process upsets automatically initiate thermal inspection reviews verifying equipment integrity after transient conditions. Historian data provides context for thermal trends: elevated bearing temperature correlation with increased throughput indicates inadequate lubrication or wear from operating above design capacity requiring process adjustment or equipment upgrade.
OT Data Stays Inside Your Security Perimeter
Edge AI processing analyzes thermal images locally on-premises without transmitting raw camera feeds to cloud services, maintaining OT network air-gap security requirements and preventing operational data exposure. Encrypted connections use TLS 1.3 with certificate-based authentication, role-based access controls limit thermal data visibility to authorized personnel, and comprehensive audit logs track all system access for cybersecurity compliance. Deployment options include fully on-premises installation, hybrid architectures with local processing and cloud analytics, or air-gapped configurations for critical infrastructure facilities requiring complete network isolation.
Methane, VOC and Flaring: From Sensor to ESG Report
Optical gas imaging cameras detect methane, VOC, and hydrocarbon leaks invisible to standard thermal cameras, automatically quantifying emissions using EPA-approved calculation methodologies and generating regulatory reports for LDAR programs, greenhouse gas inventories, and ESG disclosures. Continuous leak monitoring replaces quarterly manual surveys providing real-time emissions visibility, automated leak repair tracking verifies corrective actions completed within regulatory timeframes, and historical leak databases support emissions reduction initiatives identifying chronic leak sources requiring equipment upgrades or process modifications. Flare monitoring analyzes combustion efficiency through thermal imaging detecting incomplete combustion (smoking, poor flame structure) indicating flare tip damage or pilot system failures requiring repair.
Predictive vs Reactive Thermal Inspection Programs
Traditional reactive programs using quarterly manual surveys versus iFactory AI-powered continuous monitoring with predictive analytics demonstrate measurable operational improvements across safety, reliability, and cost metrics.
| Capability |
iFactory AI Platform |
Reactive Manual Program |
Traditional Fixed Cameras |
| Inspection Coverage |
| Equipment coverage percentage |
100% critical assets 24/7 |
15-25% monthly coverage |
Selected equipment only |
| Inspection frequency |
Continuous real-time |
Monthly or quarterly |
Continuous imaging |
| Off-shift monitoring |
24/7 automated |
Limited to dayshift inspections |
Images captured, manual review |
| Anomaly Detection |
| Detection methodology |
AI models with baseline learning |
Inspector visual judgment |
Threshold-based alerts |
| False positive rate |
Under 8% with context analysis |
15-25% interpretation variation |
35-45% threshold alerts |
| Failure prediction accuracy |
94% with 30-60 day lead time |
Reactive after failure occurs |
70-80% threshold-based |
| Operational Integration |
| CMMS work order automation |
Automatic generation with priority |
Manual data entry post-survey |
Manual review and entry |
| SCADA/DCS integration |
Bidirectional data correlation |
Separate isolated systems |
No integration |
| Historical trend analysis |
Automated with AI forecasting |
Manual spreadsheet tracking |
Basic trending available |
| Safety and Efficiency |
| Inspector safety exposure |
Minimal with remote monitoring |
High hazard exposure |
Reduced field inspections |
| Inspection labor hours |
70% reduction automated |
Baseline manual effort |
40% reduction |
| Finding-to-repair cycle time |
2-5 days automated workflow |
14-30 days manual process |
7-14 days review process |
Performance metrics based on typical refinery and gas plant implementations comparing AI-powered continuous monitoring versus traditional inspection programs.
Platform Capability Comparison
iFactory's integrated thermal imaging AI platform differentiates from traditional CMMS vendors and specialized monitoring systems through unified architecture combining predictive analytics, automated workflows, and compliance documentation. Book a comparison demo.
| Capability |
iFactory |
IBM Maximo |
SAP EAM |
QAD Redzone |
Fiix CMMS |
| AI Predictive Maintenance |
| Thermal imaging AI |
Native with edge analytics |
Third-party integration |
Third-party integration |
Not available |
Not available |
| Failure prediction models |
94% accuracy 30-60 days |
Basic analytics module |
Predictive maintenance add-on |
Reactive monitoring only |
Basic condition monitoring |
| SCADA/DCS Integration |
| Process data correlation |
Real-time bidirectional |
Limited integration |
Custom development required |
Manufacturing focus |
Not available |
| Historian connectivity |
OSIsoft PI, Honeywell PHD |
Enterprise integration |
SAP ecosystem integration |
Limited historian support |
Not available |
| Oil and Gas Specialization |
| Pipeline integrity monitoring |
Dedicated module |
Asset management focus |
Generic asset tracking |
Manufacturing focus |
General CMMS |
| Methane leak detection |
Optical gas imaging AI |
Not available |
Not available |
Not available |
Not available |
| ESG emissions reporting |
Automated compliance reports |
Custom reporting required |
Manual data compilation |
Not available |
Not available |
| Deployment and Security |
| Edge AI security |
On-premises processing |
Hybrid deployment |
Cloud or on-premises |
Cloud-based platform |
Cloud-based platform |
| Implementation timeline |
6-8 weeks typical |
6-12 months enterprise |
9-18 months SAP integration |
4-8 weeks |
4-6 weeks |
Based on publicly available product specifications and typical deployment experiences in oil and gas operations.
Regional Compliance and Safety Standards
iFactory's thermal imaging platform supports compliance documentation requirements across global oil and gas jurisdictions, automatically generating inspection records, anomaly reports, and corrective action verification meeting regional regulatory frameworks.
| Standard Category |
United States |
United Kingdom |
United Arab Emirates |
Canada |
Europe (EU) |
| Safety Regulations |
OSHA 1910 process safety, API RP 576 inspection |
HSE offshore safety, COMAH major hazards |
OSHAD occupational safety, ADNOC standards |
OHS provincial regulations, CAPP guidelines |
Seveso III major accidents, ATEX hazardous areas |
| Environmental Standards |
EPA methane rule, LDAR programs, GHG reporting |
Environment Agency permits, Net Zero commitments |
EAD environmental regulations, ISO 14001 |
ECCC GHG regulations, provincial environmental |
IED emissions, EU ETS carbon trading, methane strategy |
| Industrial Standards |
API 580 RBI, ASME B31.3 piping, NFPA codes |
BS EN ISO standards, PED pressure equipment |
ADNOC codes of practice, ISO 55000 asset management |
CSA standards, NEBB thermal imaging certification |
EN ISO certifications, CEN European standards |
| Oil and Gas Compliance |
DOT pipeline safety, PHMSA integrity management |
UKOPA pipeline, BEIS upstream regulation |
ADNOC asset integrity, Dubai Municipality codes |
NEB/CER pipeline regulations, Alberta Energy |
Offshore Safety Directive, Pipeline Directive |
iFactory maintains compliance with evolving regional standards through regular software updates and regulatory monitoring services.
Regional Platform Fit Analysis
iFactory addresses region-specific operational challenges through configurable modules supporting local compliance requirements, environmental conditions, and infrastructure characteristics across global oil and gas markets.
| Region |
Key Operational Challenges |
How iFactory Solves |
| United States |
OSHA inspection compliance, EPA methane regulations, aging refinery infrastructure requiring frequent inspection, PHMSA pipeline integrity management programs |
Automated OSHA 1910 inspection documentation, EPA-approved methane quantification methodologies, predictive maintenance extending aging asset life 40%, API 580 RBI integration with thermal data supporting inspection interval optimization, DOT pipeline inspection records with automated anomaly tracking |
| United Arab Emirates |
Extreme ambient temperatures affecting equipment cooling, harsh desert conditions with dust and sand erosion, ADNOC asset integrity requirements, remote facility locations limiting inspection access |
Thermal baselines accounting for 120°F+ ambient temperatures and diurnal variations, ruggedized cameras rated IP67 for dust/moisture protection, ADNOC-compliant inspection documentation and corrective action tracking, autonomous drone inspections covering remote desert facilities without personnel deployment, real-time monitoring compensating for limited on-site staffing |
| United Kingdom |
Stringent ESG emissions reporting requirements, Net Zero carbon reduction commitments, offshore platform inspection logistics, HSE compliance demonstration for major hazards |
Automated ESG reporting with Scope 1 methane emissions quantification, continuous leak monitoring supporting carbon reduction initiatives, offshore-certified equipment for platform installations, robotic inspections eliminating helicopter transport for routine surveys, HSE-compliant documentation demonstrating systematic inspection programs preventing major accidents |
| Canada |
Remote pipeline networks in extreme cold climates, seasonal temperature variations affecting baseline comparisons, vast geographic coverage areas, provincial regulatory variations across jurisdictions |
Cold-weather camera specifications rated -40°C operation, seasonal baseline models accounting for winter/summer temperature swings, satellite connectivity for remote pipeline monitoring locations lacking fiber infrastructure, multi-jurisdiction compliance templates supporting provincial regulatory variations (Alberta Energy Regulator, BC Oil and Gas Commission, Saskatchewan regulations), automated freeze protection monitoring for equipment in arctic conditions |
| Europe (EU) |
Carbon border adjustment mechanisms requiring emissions verification, circular economy asset lifecycle tracking, strict worker safety protections, energy efficiency optimization mandates |
EU ETS-compliant emissions monitoring with verified leak detection methodologies, asset lifecycle tracking supporting circular economy equipment reuse and recycling decisions, robotic inspections eliminating confined space and elevated work hazards, energy efficiency analytics identifying heat loss opportunities reducing facility carbon footprint, Seveso III compliance documentation for major accident prevention, multi-language support across EU member states |
Platform configurations adapt to local requirements while maintaining consistent core functionality across global deployments.
AI-Driven Integrity for Every Mile of Pipeline
Reduce Unplanned Downtime 62% with Predictive Thermal Analytics
Deploy continuous thermal monitoring across critical oil and gas assets with AI-powered failure prediction achieving 94% accuracy 30-60 days in advance, eliminating manual inspection gaps while automating compliance documentation for OSHA, EPA, and regional regulatory requirements.
Measured Results from Oil and Gas Facilities
94%
Equipment Failure Prediction Accuracy
62%
Reduction in Unplanned Downtime Events
45%
Elimination of Unnecessary PM Tasks
30-60
Days Advance Failure Warning Average
$4.2M
Annual Savings Per Major Facility
70%
Reduction in Inspection Labor Hours
Implementation Roadmap
Typical thermal imaging AI deployment for oil and gas facilities completes within 6-8 weeks from project kickoff to full production operation, following phased approach minimizing operational disruption.
Week 1-2
Site Assessment and Planning
Engineering team surveys facility identifying critical equipment requiring thermal monitoring, evaluating camera mounting locations, assessing network infrastructure, and defining integration points with existing CMMS, DCS, and historian systems. Deliverables include equipment criticality matrix, camera placement drawings, network architecture diagrams, and project implementation schedule.
Week 3-4
Hardware Installation and Network Configuration
Install fixed-mount thermal cameras, edge computing servers, and network infrastructure during planned maintenance windows or concurrent with normal operations using hot-tap techniques. Configure secure network connections, establish baseline thermal imaging for normal operating conditions, and integrate with CMMS work order systems enabling automated anomaly notification workflows.
Week 5-6
AI Model Training and Validation
Collect 2-4 weeks thermal data under varied operating conditions training machine learning models recognizing normal equipment signatures accounting for process load changes, ambient temperature variations, and operational cycling patterns. Validate model accuracy comparing AI predictions against known equipment issues and historical failure events, tuning detection thresholds balancing sensitivity versus false positive rates achieving target 8% false alarm performance.
Week 7-8
Production Deployment and Training
Activate automated anomaly detection with work order generation, train maintenance technicians on thermal data interpretation and corrective action workflows, establish key performance indicators tracking downtime reduction and maintenance optimization, and configure ESG compliance reporting for regulatory submissions. System enters continuous improvement mode with weekly model retraining incorporating new operating data and failure feedback.
Frequently Asked Questions
QHow does AI-powered thermal imaging achieve 94% failure prediction accuracy in oil and gas equipment?
Machine learning models train on facility-specific equipment baselines incorporating normal temperature variations from process loads, ambient conditions, and operational cycling patterns. AI algorithms detect subtle temperature trends invisible to threshold-based systems or manual inspection, predicting failures 30-60 days in advance by recognizing characteristic degradation signatures (gradual bearing temperature increase, electrical hotspot development, insulation breakdown patterns) validated against historical failure data. Continuous model retraining improves accuracy incorporating new operating conditions and failure feedback.
Book a demo to see prediction validation reports.
QCan thermal cameras operate reliably in harsh oil and gas environments including extreme temperatures and hazardous areas?
Industrial thermal cameras meet IP67 dust/moisture protection ratings, operate across -40°C to +60°C ambient temperature ranges, and achieve Class I Division 2 or ATEX Zone 2 hazardous area certifications suitable for most oil and gas locations. Specialized enclosures provide additional environmental protection for extreme conditions including desert heat, arctic cold, offshore salt spray, and corrosive atmospheres. Cameras mount externally to hazardous zones viewing equipment through windows or barriers maintaining electrical area classification compliance while enabling comprehensive thermal monitoring coverage.
QHow does the system integrate with existing CMMS, SCADA, and historian infrastructure?
Bidirectional API integration connects thermal imaging platform with major CMMS systems (SAP PM, IBM Maximo, Infor EAM) enabling automated work order generation when anomalies detected, parts availability checking, and maintenance execution feedback. Real-time connections to DCS/SCADA and process historians (OSIsoft PI, Honeywell PHD, Emerson DeltaV) correlate thermal data with process parameters identifying root causes: elevated motor temperature correlation with increased load indicates bearing wear or mechanical binding requiring maintenance. Standard OPC UA and Modbus protocols support legacy system integration.
Book a demo for integration architecture review.
QWhat is the typical ROI timeline for thermal imaging AI deployment in oil and gas facilities?
Typical ROI achievement: 12-16 months for major refinery or gas plant. Cost savings sources: avoided unplanned downtime (62% reduction in failures worth $250K-$850K per hour production loss), reduced maintenance costs (45% elimination of unnecessary scheduled tasks), extended equipment life (condition-based operation vs time-based replacement), improved safety (early detection preventing catastrophic failures). Investment includes thermal cameras, edge servers, software licensing, and 6-8 week deployment services. Larger facilities achieve faster payback from higher downtime cost avoidance.
QDoes the platform support methane leak detection and ESG emissions reporting requirements?
Optical gas imaging cameras detect methane, VOC, and hydrocarbon leaks invisible to standard thermal cameras, automatically quantifying emissions using EPA Method 21 equivalent calculation methodologies. Continuous monitoring provides real-time leak detection versus quarterly manual LDAR surveys, automated repair tracking verifies corrective actions completed within regulatory timeframes (15 days first attempt, 30 days final repair typical), and compliance reports generate automatically for EPA GHGRP, state programs, and voluntary ESG disclosures including TCFD, CDP, and GRI frameworks. Historical leak databases support emissions reduction initiatives identifying chronic sources requiring equipment upgrades.
Deploy AI-Powered Thermal Imaging Across Your Oil and Gas Operations
iFactory's thermal imaging AI platform delivers 94% equipment failure prediction accuracy with 30-60 days advance warning, reducing unplanned downtime 62%, eliminating 45% of unnecessary preventive maintenance, and providing automated compliance documentation for OSHA, EPA, PHMSA, and regional regulatory requirements governing oil and gas asset integrity management programs globally.
94% Prediction Accuracy
Continuous Monitoring
CMMS Integration
Methane Detection
30-60 Days Early Warning