Every year, hospitals hemorrhage millions in preventable operational costs — not from clinical failures, but from analytics blind spots. CFOs allocate budgets based on gut instinct, department heads fight for capital without ROI evidence, and boards approve CapEx without benchmarks. The result: deferred analytics investments that silently compound into revenue leakage, staff attrition, and regulatory exposure. This guide delivers the financial architecture your leadership team needs — cost-per-bed benchmarks, capital vs. operating splits, and a model for quantifying what deferred analytics is actually costing you today.
Is Your Hospital Analytics Budget Optimized for ROI?
iFactory benchmarks your analytics spend against peer institutions and builds a capital planning roadmap that maximizes clinical and financial outcomes.
The Financial Reality of Hospital Analytics Underinvestment
Analytics underinvestment is not a technology problem — it is a balance-sheet problem. Hospitals that defer analytics modernization face compounding costs across three domains: clinical quality penalties, workforce inefficiency, and capital misallocation. The CFO's challenge is translating these risks into budget language that boards and payers will act on.
Revenue Leakage
- Undercoded encounters missed by manual charge review
- Denial rates 2–4x higher without real-time eligibility analytics
- Average leakage: $1.2M–$3.8M per 100 beds annually
Operational Hemorrhage
- Length-of-stay 18% above benchmark without predictive discharge tools
- OR utilization below 70% without block-scheduling analytics
- Staff overtime costs $280K–$620K per 100 beds annually
Patient Safety Risk
- HAC penalties averaging $1.4M for non-compliant facilities
- Sepsis mortality 22% higher without early-warning analytics
- CMS star rating drops cost $900K–$2.1M in referral volume
Analytics Budget Benchmarks by Facility Size & Tier
Cost-per-bed is the most reliable normalization metric for hospital analytics budgeting. Industry benchmarks vary significantly by facility tier, EMR complexity, and payer mix. Use the table below to position your current spend and identify optimization gaps.
| Facility Tier | Bed Count | Analytics Cost/Bed/Year | CapEx Share | OpEx Share | ROI Benchmark |
|---|---|---|---|---|---|
| Critical Access | <25 | $4,200–$6,800 | 30% | 70% | 1.8x–2.4x |
| Community Hospital | 25–199 | $6,800–$11,400 | 40% | 60% | 2.4x–3.8x |
| Regional Medical Center | 200–499 | $11,400–$18,200 | 45% | 55% | 3.8x–5.2x |
| Academic / Health System | 500+ | $18,200–$28,600 | 50% | 50% | 5.2x–7.4x |
CapEx vs. OpEx: The Optimal Analytics Budget Architecture
Misclassifying analytics spend between capital and operating budgets is one of the most common errors in hospital financial planning. The correct split depends on your depreciation strategy, vendor contract structure, and tax position. Below is iFactory's recommended allocation framework by investment category.
Platform Infrastructure (CapEx — Depreciate 5–7 Years)
- Core analytics platform licensing and implementation
- Data warehouse architecture and ETL pipeline build
- EMR integration middleware and API development
- Cybersecurity and HIPAA-compliant cloud migration
Operational Analytics (OpEx — Annual Budget Line)
- SaaS subscription fees and per-seat licensing
- Ongoing model training and AI revalidation costs
- Analytics team FTEs, training, and certification
- Vendor support, SLA maintenance, and upgrade cycles
Strategic Transformation (Hybrid — Board-Approved Program)
- Value-based care analytics infrastructure buildout
- Predictive population health and risk-stratification tools
- Executive and clinical leadership dashboard deployment
- Multi-site health system analytics unification programs
Quantifying the Hidden Cost of Deferred Analytics Investment
Every quarter a hospital defers analytics modernization, the compounding cost grows. iFactory's Deferred Analytics Quantification Model breaks this into four measurable loss categories that CFOs can present to boards as a business case for immediate investment.
- Avg. 4.2-hour delay per high-acuity case without predictive alerts
- Estimated cost: $1,800–$4,400 per delayed intervention
- CMS quality penalty exposure: $280K–$1.6M annually
- Manual coding error rate: 12–18% without AI-assisted capture
- Average denial cost: $118 per claim rework cycle
- Net revenue impact: $2.1M–$5.4M per 100 beds
- Nursing overtime: 22% above benchmark without demand forecasting
- Turnover cost per RN: $46,000–$88,000 replacement cycle
- Avoidable agency spend: $640K–$1.8M per 100 beds annually
- HIPAA audit readiness gap: $320K avg. remediation cost
- CMS IPPS payment reduction risk: up to 3% of DRG revenue
- Accreditation citation cost: $180K–$420K per survey cycle
- Budget decisions without data: 34% higher project overrun rate
- Asset lifecycle errors: $1.1M avg. early-replacement cost
- Deferred maintenance penalty: 2.8x cost vs. predictive schedule
- Value-based contract underperformance: $800K–$2.2M annual gap
- Physician alignment friction from lack of performance dashboards
- Market share loss: 3–7% in competitive metro markets
Comparison Matrix: Legacy Friction vs. iFactory Optimized Excellence
| Operational Domain | Legacy Friction State | iFactory Optimized State | Financial Delta |
|---|---|---|---|
| Budget Planning | Spreadsheet-based, static annual cycle | Real-time dashboard, rolling 90-day forecasting | +$1.4M accuracy gain |
| Revenue Capture | Manual charge review, 14% error rate | AI-assisted coding, 99.1% accuracy | +$2.8M per 100 beds |
| Staffing Models | Fixed ratios, reactive scheduling | Predictive demand forecasting, dynamic allocation | −$820K overtime spend |
| Clinical Outcomes | Retrospective reporting, 30-day lag | Real-time alerts, predictive sepsis/readmission | −$1.6M penalty exposure |
| Capital Decisions | Gut-instinct CapEx, 34% overrun rate | Data-driven lifecycle modeling, ROI gating | −$1.1M misallocation |
| Compliance Posture | Manual audit prep, reactive remediation | Continuous monitoring, automated audit trail | −$320K audit cost |
Clinical Impact Grid: Staff Burnout Reduction & Patient Throughput
Burnout Prevention
- Predictive staffing reduces overtime by 28%
- Automated documentation cuts charting time 40 min/shift
- Early-warning alerts eliminate reactive crisis response
- Result: 31% reduction in 90-day RN turnover rate
Throughput Optimization
- Predictive discharge reduces LOS by 1.4 days average
- ED boarding time reduced 34% via capacity analytics
- OR block optimization increases case volume 12–18%
- Result: $3.2M–$6.8M additional contribution margin
Quality & Safety Outcomes
- Sepsis early-warning reduces mortality by 19–24%
- HAC rate drops 38% with real-time surveillance alerts
- Readmission reduction: 14–22% within 12 months
- Result: Top-decile CMS star rating trajectory
Stop Budgeting Blind. Start Benchmarking with iFactory.
Book a Demo to see your cost-per-bed analytics benchmark and receive a personalized Operational Gap Audit for your facility tier.
Hospital Analytics Budgeting — Executive FAQ
What is a realistic analytics budget for a 200-bed community hospital?
Based on iFactory benchmarks, a 200-bed facility should allocate $2.3M–$3.6M annually in total analytics spend — approximately 45% CapEx for platform infrastructure and 55% OpEx for licensing, staffing, and ongoing model maintenance. Facilities below this threshold typically show a 34% higher denial rate and 22% longer length of stay than optimized peers.
How do we build a board-ready business case for analytics investment?
iFactory's Operational Gap Audit quantifies your current leakage across six loss categories — revenue cycle, clinical outcomes, workforce, compliance, capital allocation, and strategic positioning — and translates each into a dollar figure your board can evaluate against the investment ask. Book a Demo to receive your facility-specific model.
Should analytics platforms be capitalized or expensed?
Core infrastructure — data warehouses, integration middleware, and platform implementation — qualifies for capitalization under ASC 350-40 with a 5–7 year depreciation schedule. Ongoing SaaS subscriptions, per-seat fees, and maintenance contracts are operating expenses. iFactory provides your finance team with a pre-structured CapEx/OpEx allocation template aligned to your auditor requirements.
What is the typical payback period for hospital analytics investment?
Most iFactory client facilities achieve full payback within 14–22 months. The fastest recovery drivers are revenue cycle AI (avg. 6-month payback) and predictive staffing (avg. 9-month payback). Longer-horizon returns come from quality improvement programs that reduce CMS penalty exposure and improve star ratings over 24–36 months.
Get Your Hospital Analytics Budget Assessment Today
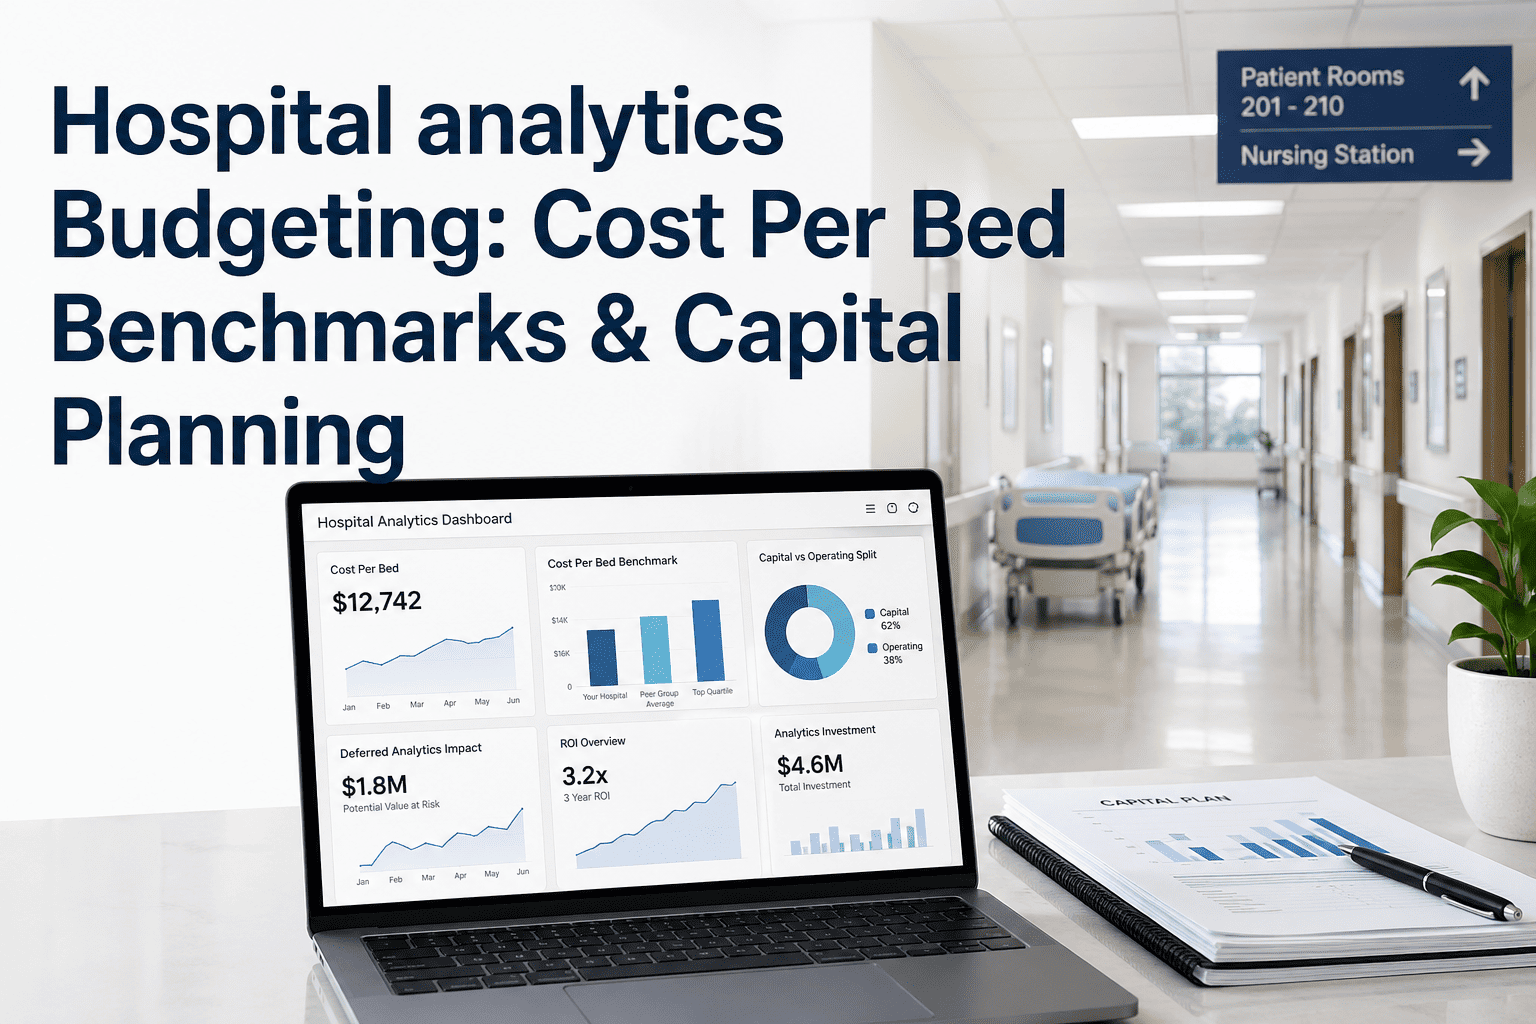
iFactory's Analytics Dashboard delivers real-time cost-per-bed benchmarking, capital planning models, and ROI tracking — purpose-built for hospital finance and operations leaders.