Every 60 seconds a hospital operates without unified analytics, it bleeds an average of $1,200 in preventable revenue leakage — and no executive ever sees it on a dashboard. The fracture between clinical outcomes and operational data is not a technology problem. It is a leadership liability. iFactory's Analytics Dashboard was engineered specifically for healthcare VPs who cannot afford another quarter of avoidable readmissions, CMS penalties, and staff attrition masking itself as "system complexity." This is the operational reckoning your board has been demanding.
Is Your Hospital Operating at the Speed of Outcomes — or the Speed of Yesterday's Reports?
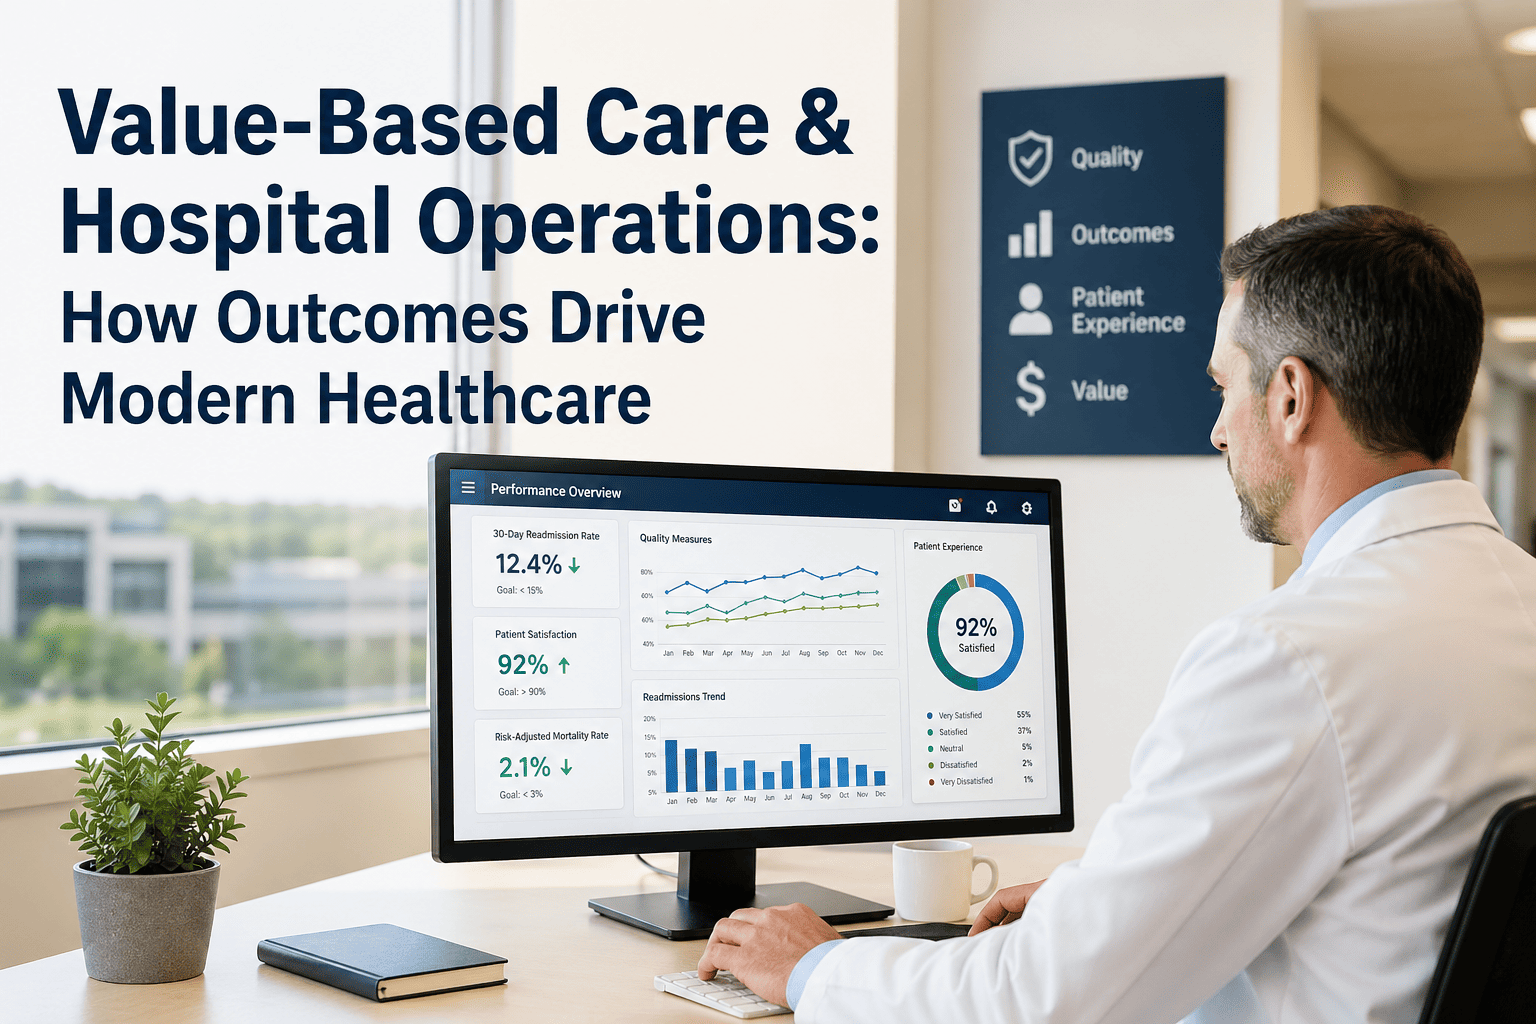
iFactory's Analytics Dashboard translates real-time operational data into financial clarity, quality compliance, and patient safety intelligence — designed exclusively for health system leadership.
Value-Based Care Is Not a Clinical Initiative. It Is a Financial Mandate.
CMS reimbursement models now tie 30% or more of hospital payment to quality metrics, readmission rates, and patient experience scores. Yet most health systems continue to manage these variables through fragmented EMR exports, weekly spreadsheet reconciliations, and departmental silos that contradict each other by Monday morning. iFactory's Analytics Dashboard replaces this operational debt with a single, unified intelligence layer — translating charge capture, throughput, HCAHPS, and clinical quality data into one executive-ready view. The result is not a better report. It is a fundamentally different decision-making environment for health system leadership.
Revenue Integrity
Real-time charge capture monitoring closes the gap between clinical documentation and billing, reducing revenue leakage by an average of 18% in the first operational quarter.
Readmission Reduction
Predictive discharge analytics flag high-risk patients 72 hours before release, enabling care coordination interventions that directly protect your CMS value-based reimbursement score.
Throughput Optimization
Capacity modeling identifies bottlenecks in ED-to-admission flow, surgical suite scheduling, and discharge planning — adding recoverable bed-days without capital expansion.
Quality Score Protection
Automated HEDIS, TJC, and CMS quality measure tracking ensures your hospital never misses a compliance window — preventing the penalty exposure that erodes net margin silently.
Legacy Friction vs. iFactory Optimized Excellence
The operational gap between where most health systems are and where value-based contracts require them to be is not a technology gap — it is a visibility gap. The following matrix illustrates the financial and clinical cost of legacy fragmentation versus the strategic advantage of unified intelligence.
| Operational Domain | Legacy Friction State | iFactory Optimized Excellence | Executive Impact |
|---|---|---|---|
| Revenue Reporting | Weekly spreadsheets, 5-day lag | Real-time charge capture dashboard | +18% Revenue Recovery |
| Readmission Risk | Retrospective case review | 72-hour predictive patient flagging | CMS Penalty Protection |
| Quality Compliance | Manual measure abstraction | Automated HEDIS & TJC tracking | Zero Missed Windows |
| Staff Utilization | Siloed department scheduling | Cross-unit capacity intelligence | −22% Overtime Spend |
| Patient Experience | HCAHPS reviewed post-discharge | Real-time HCAHPS signal monitoring | Top-Quartile Scores |
| Board Reporting | 3-week preparation cycle | One-click executive narrative export | Strategic Agility |
Three Systemic Crises. One Unified Platform Response.
Staff burnout, patient throughput collapse, and quality score erosion are not isolated problems — they are symptoms of the same operational fracture: the absence of real-time, cross-functional intelligence. iFactory does not layer another tool on top of your existing workflows. It replaces the void at the center of your operational architecture.
Staff Burnout Reversal
Clinical staff spend an average of 4.3 hours per shift on documentation and manual data reconciliation tasks that deliver no direct patient care. iFactory's automated workflow intelligence eliminates this administrative burden, restoring clinical capacity and measurably reducing 90-day RN attrition — one of the highest-cost line items in health system operations today.
Patient Throughput Acceleration
Capacity modeling powered by iFactory's Analytics Dashboard identifies ED boarding events, surgical suite idle windows, and discharge bottlenecks in real time — allowing charge nurses and administrators to intervene before delay cascades. Health systems using unified throughput intelligence report a 14% improvement in average length of stay within the first two operational cycles.
Quality Score Elevation
Composite quality scores — including HEDIS, HCAHPS, and CMS Star Ratings — are the new currency of value-based reimbursement. iFactory's continuous measure tracking ensures that your performance data is always audit-ready, always trending upward, and always visible to leadership before a regulatory deadline forces a reactive response. Quality is no longer a retrospective event.
Implementation Roadmap for Enterprise Health Systems
iFactory is not a rip-and-replace initiative. It is a precision integration layer designed to surface value from the data your health system is already generating — in your existing EMR, ERP, and quality management environments. The roadmap below outlines how enterprise deployments achieve measurable ROI within 90 days.
Operational Gap Audit
A dedicated iFactory implementation architect maps your current data flows, identifies the specific revenue leakage and quality risk points costing your system today, and delivers a quantified gap analysis — before any contract is signed.
Integration & Data Unification
iFactory connects to Epic, Cerner, Meditech, and custom ERP environments via secure HL7 FHIR APIs. All clinical, financial, and operational data streams converge into a single, HIPAA-compliant analytics environment within 30 days.
Executive Dashboard Activation
C-Suite and VP-level dashboards are configured to your specific quality measures, financial KPIs, and regulatory obligations — providing a real-time executive command center calibrated to your strategic priorities, not generic templates.
Predictive Intelligence Deployment
Readmission risk models, throughput forecasting engines, and quality measure predictors are activated and validated against your historical baseline — establishing the performance benchmarks that will govern your value-based contract performance.
Continuous ROI Monitoring
A dedicated Customer Success Executive reviews quarterly performance against your pre-deployment gap audit, ensuring your health system captures every dollar of recoverable revenue and every quality point of CMS reimbursement protection available.
Your Competitors Are Already Operating With Unified Intelligence. Your Board Will Ask Why You Are Not.
Schedule a 30-minute Strategic Demo or request a complimentary Operational Gap Audit. Our healthcare architects will quantify exactly what your current operational model is costing you — in dollars, quality points, and patient outcomes.
Questions Health System Leadership Ask Before Deploying iFactory
How does iFactory integrate with our existing Epic or Cerner environment without disrupting clinical workflows?
iFactory connects exclusively via certified HL7 FHIR APIs — a read-layer integration that requires no modification to your clinical workflows, no downtime, and no shadow IT risk. Your clinical staff will not notice the integration exists. Your executive team will immediately notice the intelligence it produces. Implementation architects manage the entire technical onboarding process within a 30-day deployment window.
What is the measurable ROI timeline for a health system of 400 or more beds?
Health systems in the 400-800 bed range typically identify recoverable revenue equivalent to their full platform investment within the first operational quarter — primarily through charge capture gap closure and averted CMS readmission penalties. Year-two ROI is driven by length-of-stay optimization and quality-based reimbursement uplift. Your Operational Gap Audit will produce a system-specific ROI projection before you commit to deployment.
Is the platform compliant with HIPAA, CMS interoperability mandates, and state-level data sovereignty requirements?
Yes. iFactory operates exclusively within HIPAA-compliant, AES-256-encrypted cloud environments with configurable data residency controls for state-specific sovereignty requirements. Every data access event is logged to an immutable audit trail, ensuring full defensibility for CMS audits, Joint Commission reviews, and board-level reporting. Book a Demo to review our full compliance architecture with your legal and compliance team.
Can iFactory's dashboards be configured for different executive roles — CMO, CNO, CFO, and Board reporting?
Role-based dashboard configuration is a core platform feature. Your CMO sees quality measure performance and patient safety signals. Your CFO sees charge capture integrity, payer mix analysis, and value-based contract performance. Your CNO sees staffing utilization, burnout indicators, and throughput bottlenecks. Your Board sees a single, narrative-driven performance summary exportable in one click. Each view is governed by enterprise-grade role permissions.
Request Your Complimentary Operational Gap Audit Today
Our healthcare architects will map your current operational model, quantify your revenue leakage exposure, and deliver a board-ready performance gap report — at no cost and with no obligation. This is the conversation your CFO has been waiting for.