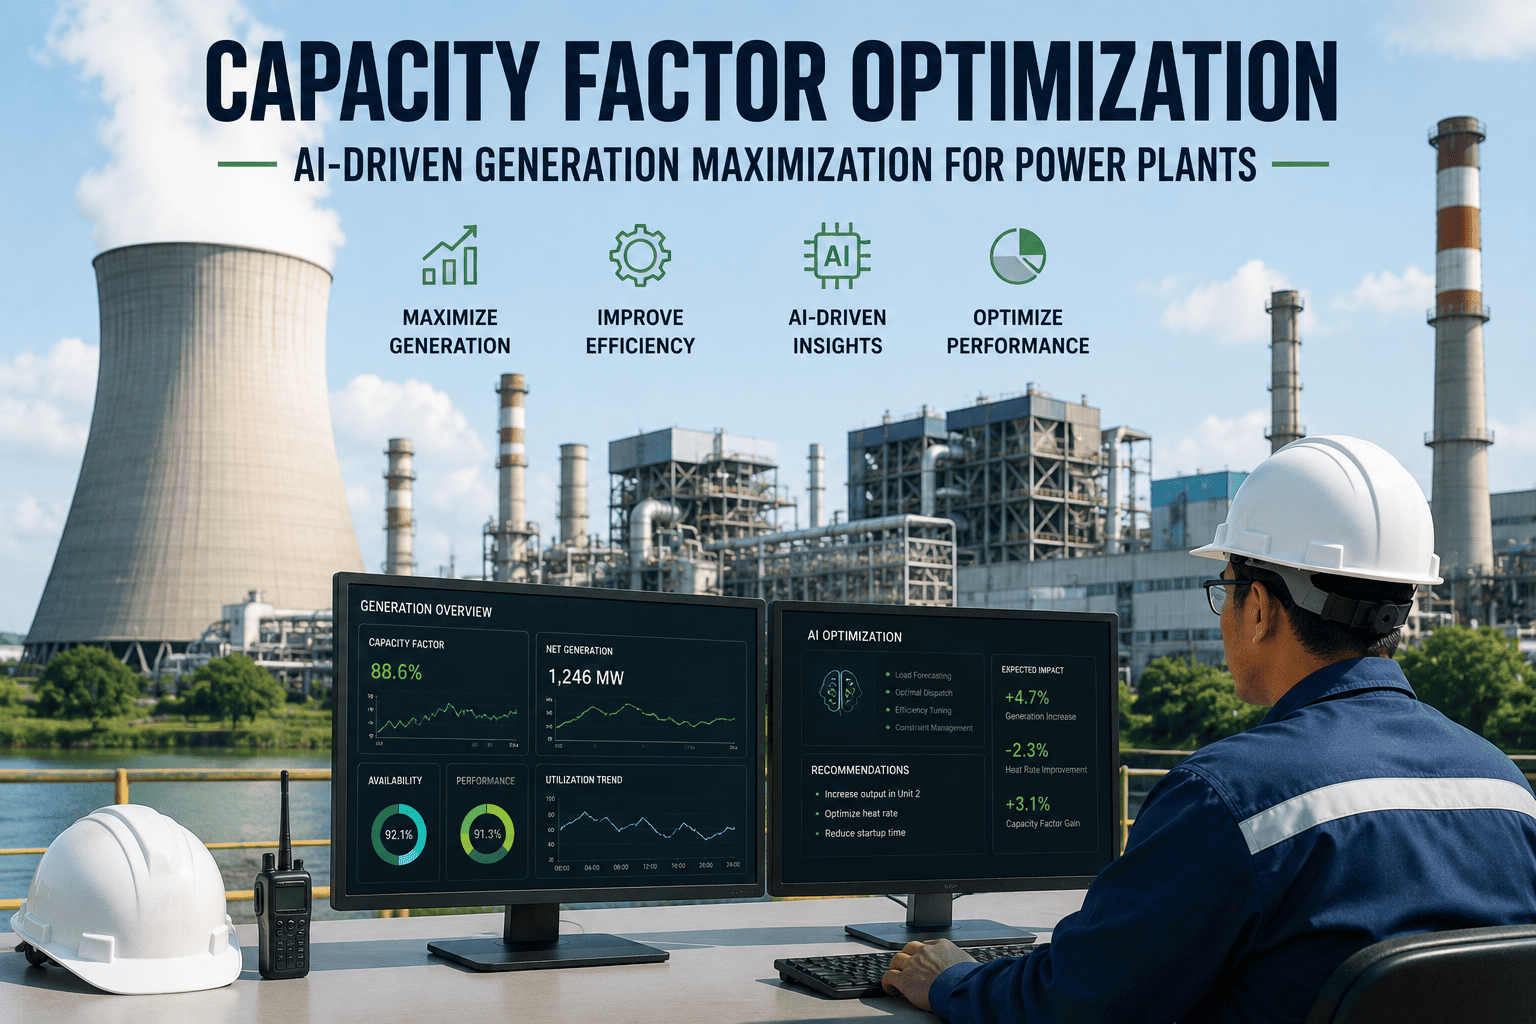
Capacity factor is the number that tells the real story behind a nameplate rating: how much a plant actually generated against how much it could have generated running flat out, every hour, all year. Coal, gas, and geothermal units commonly average around 50% capacity factor industry-wide, and the gap between that figure and a unit's realistic ceiling is rarely one dramatic failure — it is a stack of small, recurring deratings that never individually looked worth escalating. High cooling water temperatures, gradual equipment degradation, and conservative dispatch decisions during peak demand periods all chip away at output long before a forced outage ever appears on a report. Closing that gap starts with knowing exactly which derating events are recurring, and AI-powered capacity factor optimization for power generation assets is built to surface them automatically.
Capacity Factor OptimizationAI-driven generation maximization for power plants
Prevent derating, manage availability proactively, and optimize load dispatch with a system that flags the specific losses keeping your plant below design output.
Actual generation against theoretical maximum output — the remaining 38% is where recoverable capacity lives.
Capacity Factor Is Not the Same as Availability
The two metrics get used interchangeably, but they measure different things — and confusing them is one of the fastest ways to misdiagnose a generation shortfall.
Capacity Factor
Actual energy generated over a period divided by the maximum possible energy at full nameplate output for that entire period. It reflects both availability and how the unit is dispatched.
Availability Factor
The percentage of scheduled time the unit was physically capable of running, regardless of whether it was actually dispatched at full load during that time.
Unit Capability Factor
Maximum energy a plant is capable of supplying, limited only by factors within management's control — a cleaner read on operational effectiveness.
Equivalent Availability Factor
Availability adjusted for partial deratings, converting them into equivalent full-outage hours so partial losses are not hidden inside a healthy-looking uptime number.
What Actually Causes Derating Events
A derating is a partial reduction in dependable capacity — distinct from a forced outage — and it is almost always traceable to one of a small number of recurring root causes.
High Cooling Water Temperature
Elevated intake temperature reduces condenser and heat exchanger performance, forcing a reduction in dependable output during warm-weather months.
Equipment Degradation
Gradual wear in turbines, compressors, and rotating equipment lowers achievable output well before any single component actually fails.
Historical Peak Demand Performance
Some derates are set conservatively based on how a unit has performed during past peak periods, even when current condition would allow more.
Environmental and Regulatory Limits
Evolving emissions or grid stability requirements sometimes force a deliberate, planned reduction in maximum dependable capacity.
Small, Recurring Losses Add Up Faster Than One Big One
A single forced outage gets investigated immediately. A derating that shaves five percent off output every summer afternoon rarely gets the same scrutiny — even though it can cost more generation over a year.
A recurring afternoon derate from cooling water temperature quietly shaves output during the exact hours demand and prices are highest.
Conservative dispatch decisions based on outdated performance assumptions compound across every peak period in the week.
Warm-weather deratings stack across an entire season, becoming the single largest capacity factor drag most thermal plants carry.
Left unaddressed, these small recurring events routinely account for more lost generation over a year than any single forced outage event.
Stop Treating Deratings as Background Noise
A derate that happens every summer afternoon is not weather — it is a pattern with a root cause. iFactory tracks every derating event, links it to cooling water temperature, equipment condition, or dispatch history, and flags which recurring losses are worth fixing first.
Why Manual Derate Tracking Misses the Pattern
Most plants log deratings as they happen but rarely analyze them as a recurring dataset across seasons and units.
| Capability | Manual Logging | AI-Driven Optimization |
|---|---|---|
| Pattern recognition | Rarely analyzed across seasons | Automatic recurring-event detection |
| Root cause linkage | Logged without explanation | Linked to temperature, wear, or dispatch |
| Dispatch recommendations | Based on outdated assumptions | Updated against current asset condition |
| Fleet-wide comparison | Manual, inconsistent | Standardized across every unit |
| Capacity factor forecasting | Static, historical average | Dynamic, condition-based projection |
Five Steps to Higher Capacity Factor
Improving capacity factor is rarely one project. It is a sequence of disciplined checks applied consistently across every generating asset.
Separate Capacity Factor From Availability
Track both metrics independently so a healthy availability number never masks a mediocre capacity factor caused by dispatch or deratings.
Log Every Derating Event With Cause
Capture not just that a derate occurred, but the specific condition — cooling water temperature, wear, or dispatch decision — behind it.
Look for Seasonal and Time-of-Day Patterns
Recurring deratings tied to weather or peak-hour dispatch are usually the largest and most fixable capacity factor drag on the books.
Re-Test Conservative Dispatch Limits
Derates set years ago based on past peak performance may no longer reflect current equipment condition after upgrades or repairs.
Prioritize Fixes by Recoverable Megawatt-Hours
Rank every identified derating cause by its annual generation impact so capital and maintenance decisions follow the largest opportunity first.
Capacity Factor Optimization — Questions Answered
What Operations Directors ask most often when investigating why capacity factor lags nameplate expectations.
Q: What is considered a strong capacity factor for a thermal plant?
Coal, natural gas, and geothermal generation sources typically average around 50% capacity factor industry-wide, largely because these units are often dispatched to follow demand rather than run flat out continuously. Baseload combined-cycle units frequently run higher, while peaking units are expected to run lower by design. The more useful benchmark for any individual plant is its own historical capacity factor trend and how much of the gap to its realistic ceiling is explained by dispatch choice versus avoidable derating.
Q: How is a derating different from a forced outage?
A forced outage takes a unit fully offline, while a derating is a partial reduction in maximum dependable capacity while the unit continues running. Deratings are typically converted into equivalent full-outage hours for reliability reporting, which means a unit running at 90% capacity for a full week can carry the same reliability impact as being offline entirely for roughly seventeen hours. This conversion is exactly why recurring deratings deserve the same root-cause attention as an outright trip. Book a demo to see your own derating history converted this way.
Q: Can improving equipment condition alone raise capacity factor significantly?
Equipment condition is one lever, but dispatch decisions and environmental constraints often matter just as much. A unit in excellent mechanical condition can still show a low capacity factor if it is dispatched conservatively, curtailed by the grid operator, or limited by outdated derate settings from years earlier. A complete capacity factor improvement program addresses equipment, dispatch logic, and derate assumptions together rather than focusing on any single one in isolation.
Q: Why do cooling water temperature derates get treated as unavoidable?
Many plants accept warm-weather derating as simply the cost of summer operation, but the actual magnitude of the derate is often set conservatively and rarely re-tested as cooling systems are maintained or upgraded. Comparing derate settings against actual measured performance during peak temperature conditions frequently reveals that some portion of the assumed loss can be recovered without any capital investment at all, simply by updating the assumption.
Q: How quickly can a capacity factor optimization program show results?
Because much of the initial work involves analyzing existing historian data for derating patterns rather than installing new equipment, most plants identify at least one recoverable pattern — often a seasonal or dispatch-related one — within the first few weeks of connecting their data. Larger equipment-condition fixes naturally take longer, but the pattern identification itself is usually the fastest part of the process. Reach out to our support team to discuss your rollout timeline.
Turn Recurring Deratings Into Recovered Megawatt-Hours
The generation you are missing is usually not hiding in a single dramatic failure — it is stacked up across small, repeating deratings nobody has connected yet. Let iFactory find the pattern, attribute the cause, and rank the fix by how much capacity factor it will actually recover.