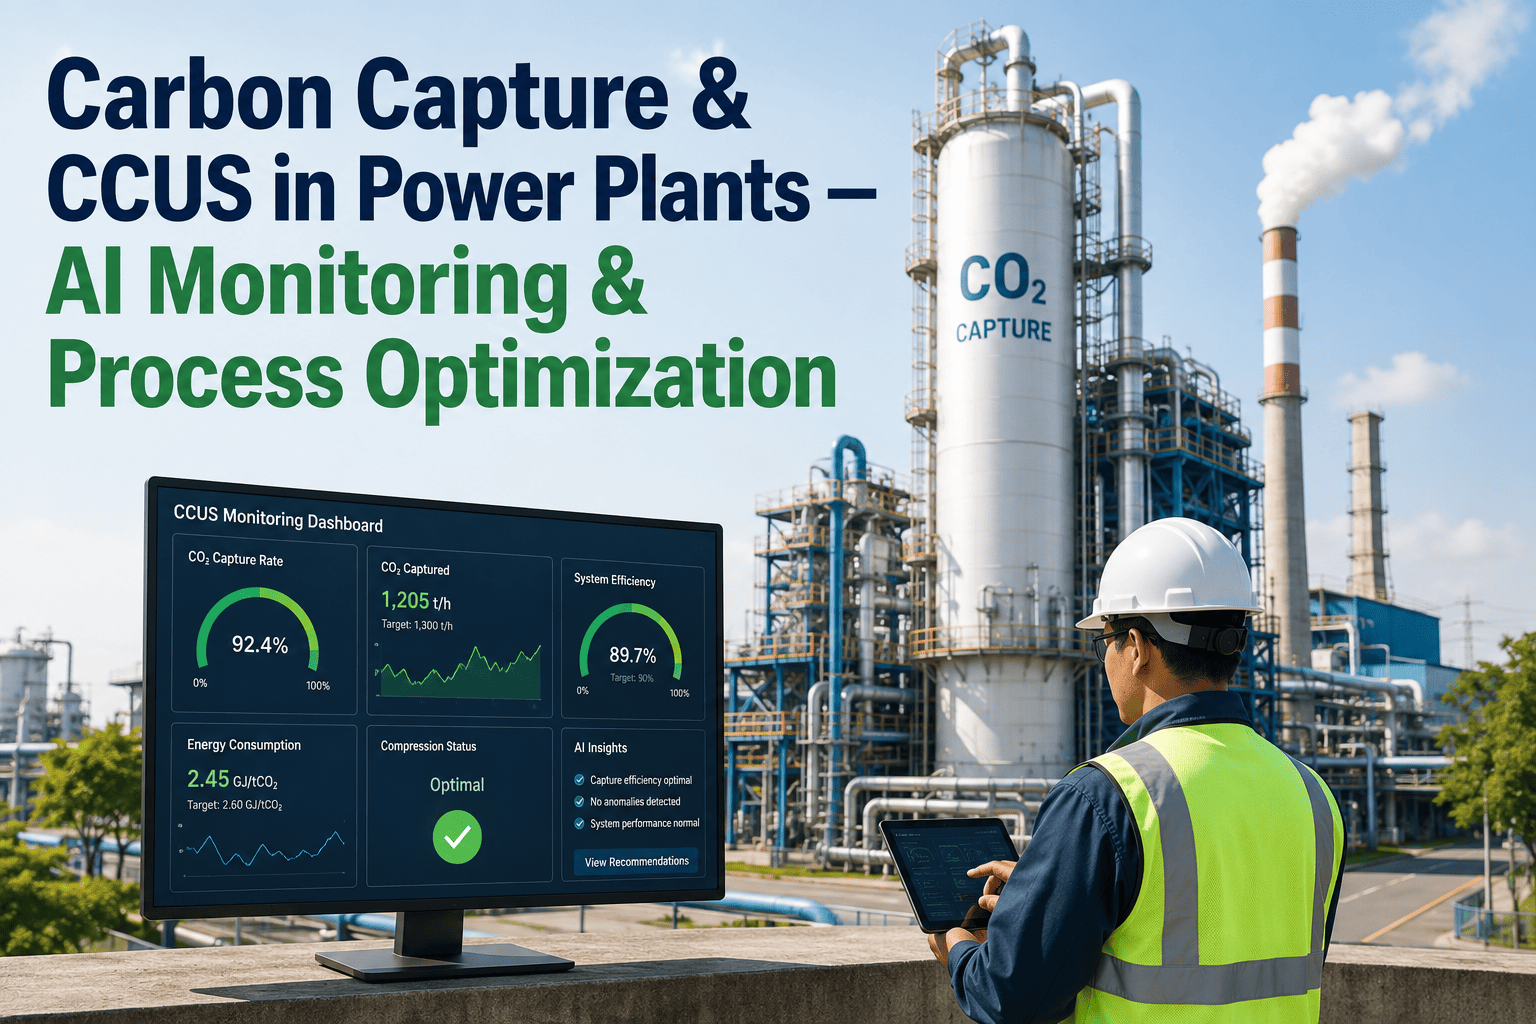
Carbon capture is one of the few decarbonization levers a power plant can install without waiting on a new grid interconnection, but the technology carries an operating penalty that most plants underestimate until it is running. Amine-based post-combustion capture alone can consume 25-40% of a plant's total energy output for solvent regeneration, and that penalty grows further whenever solvent degrades faster than expected or absorber chemistry drifts out of its optimal window. Flue gas impurities like SO2 and NO2 accelerate amine breakdown, corrosion creeps into piping long before it is visible on a inspection sheet, and capture efficiency can fall well below its design target while the control room dashboard still looks unremarkable. iFactory AI CCUS Monitoring gives plant and sustainability teams continuous visibility into capture rate, energy penalty, and solvent health together, instead of piecing that picture together after the fact. Book a Demo to see how iFactory keeps a carbon capture system running at its designed efficiency, not just its designed capacity.
Carbon Capture & CCUS Monitoring
Carbon Capture Only Pays Off When It Runs at Its Designed Efficiency
AI-powered process analytics for amine-based, membrane, and oxy-combustion CCUS systems, tracking capture efficiency, energy penalty, and solvent degradation in real time.
90%+
Sustained CO2 capture rate achievable with continuous process optimization
25-40%
Typical energy penalty of amine-based post-combustion capture
8%+
Energy penalty reduction reported from AI-optimized solvent circulation
The Capture Process, Stage by Stage
Post-combustion capture is a chain of chemical and mechanical steps, and a small inefficiency at any single stage compounds into a much larger loss in captured CO2 and wasted steam by the time it reaches compression.
1
Absorption
Flue gas contacts amine solvent in the absorber column, where CO2 chemically binds to form carbamates. Absorption efficiency depends heavily on solvent concentration and column temperature.
→
2
Regeneration
Rich solvent is heated in the stripper to release concentrated CO2 and regenerate lean solvent. This reboiler duty is the single largest source of the capture energy penalty.
→
3
Compression
Captured CO2 is compressed for transport or storage. Compressor efficiency and inlet gas purity both directly affect the net energy cost of the entire capture chain.
→
4
Solvent Recovery
Lean solvent is cooled and recirculated to the absorber. Degradation products and reclaimer performance at this stage determine how much makeup solvent the plant needs to purchase.
Why Capture Efficiency Erodes Between Turnarounds
A
Solvent degradation from flue gas impurities
SO2 and NO2 carried over from upstream emissions controls react with amine solvent, forming heat-stable salts that reduce CO2 loading capacity and increase corrosion risk in absorber and stripper piping.
B
Reboiler duty creeping upward
As solvent quality degrades, more steam is needed to achieve the same regeneration, pushing specific reboiler duty higher and widening the energy penalty without any single alarm condition being triggered.
C
Foaming and flooding in the absorber column
Degradation byproducts and particulate carryover can trigger foaming that reduces vapor-liquid contact area, silently lowering capture rate well before it becomes visible in column differential pressure.
D
Amine emissions and reclaimer strain
Nitrosamine formation from degraded solvent creates its own emissions concern, and an overloaded reclaimer system struggles to keep pace, compounding both cost and environmental exposure together.
Which Capture Technology Is iFactory Built to Monitor
iFactory's analytics models adapt to the capture technology your plant runs, since each approach fails and drifts in a different way.
Amine-Based Post-Combustion
The most widely deployed capture method. iFactory tracks solvent loading, heat-stable salt concentration, reboiler duty, and corrosion indicators to extend solvent life and hold reboiler steam demand near design levels.
Membrane Separation
Membrane fouling and permeability decline reduce CO2 selectivity over time. iFactory correlates pressure differential and permeate purity trends to flag membrane modules approaching replacement thresholds early.
Oxy-Combustion Systems
Air separation unit performance and flue gas recirculation ratios directly determine combustion stability and CO2 purity. iFactory monitors ASU output quality alongside combustion parameters for consistent capture-ready gas.
Manual Monitoring vs. AI-Driven Capture Analytics
What a Small Efficiency Swing Actually Costs
Capture efficiency is not just an operating metric, it is directly tied to tax credit qualification, ESG disclosure accuracy, and the cost basis your finance team reports to regulators and investors.
1
45Q tax credit qualification depends on measured, not assumed, capture
Federal 45Q credits are calculated against verified tonnage of CO2 actually captured and stored, not nameplate design capacity. A capture rate that quietly slips from 90% to 82% over a quarter translates directly into fewer qualifying tons and a smaller credit, even though the unit never technically shut down.
2
ESG disclosures rely on the same underlying capture data
Sustainability teams often report avoided emissions figures pulled from the same capture rate calculations used for internal operations. When that number is built on monthly aggregates instead of continuous monitoring, a material restatement risk sits quietly inside the annual sustainability report.
3
Energy penalty growth erodes the plant's net output silently
Every incremental increase in reboiler steam demand is steam that is not generating exportable power. A creeping energy penalty from degraded solvent can shave measurable megawatt-hours off net plant output over a year without ever appearing as a distinct line item anyone reviews.
4
Unplanned reclaimer campaigns cost more than planned ones
Solvent reclamation done reactively, after heat-stable salt concentration has already impaired absorption capacity, typically requires a larger batch, more downtime, and more replacement solvent than a reclaim campaign scheduled from an early degradation trend.
Turn Carbon Capture From a Cost Center Into a Managed Asset
iFactory connects to your existing DCS and process historian to start surfacing capture efficiency and solvent health signals without new hardware in most deployments.
From Data Audit to Live Optimization in Six Weeks
Weeks 1-2
Process & Data Audit
Map absorber, stripper, and compression instrumentation and connect to DCS and historian data feeds.
Weeks 3-4
Baseline & Pilot
Build a plant-specific efficiency baseline and activate live alerts on capture rate and energy penalty.
Weeks 5-6
Full Optimization
Expand coverage to solvent health and corrosion modeling with automated reporting for sustainability teams.
Natural Gas Plant Case Study: Holding Capture Rate Above Target
Case Study — Gulf Coast Combined Cycle Facility
A combined cycle plant running a post-combustion amine capture unit was seeing capture efficiency swing between 82% and 91% month to month, without a clear operational explanation. After deploying iFactory's CCUS analytics, the team traced the swings to a combination of gradual solvent degradation and a reboiler steam control loop that was not compensating for load changes quickly enough. Both issues were corrected through targeted maintenance and control tuning, and the facility has held capture efficiency above 90% for five consecutive months since.
90%+
Capture efficiency sustained over five months
6%
Reduction in specific reboiler steam duty
3 mo
Extended solvent life before next reclaim cycle
What Plant Teams Say
Before iFactory, we found out about capture efficiency drops from a monthly report that was already three weeks stale. Now our process engineers see reboiler duty and solvent condition trending together, in real time, and we can act on a drift the same shift it starts. Our capture rate has been the most stable it has ever been since startup.
Plant Operations Manager
Combined Cycle Facility with Post-Combustion CCUS, Texas
Frequently Asked Questions
Does iFactory work with capture systems already in operation, or only new installations?
iFactory is designed to be deployed on existing operating capture units without requiring a shutdown or new process equipment. The platform connects to your current DCS, historian, and solvent analysis data to establish a baseline and begin surfacing performance insight within the first weeks of deployment.
Book a Demo to see this mapped against your specific capture configuration.
How does the platform estimate solvent degradation without constant lab sampling?
iFactory correlates process indicators such as pH, heat-stable salt trend estimates, and reclaimer throughput against periodic lab results to build a continuous degradation model between sample points. This narrows the gap between scheduled lab analysis dates rather than replacing lab testing entirely.
Can this help reduce the energy penalty of our amine-based capture unit?
Yes. By correlating reboiler duty against solvent condition and load, iFactory identifies when steam demand is rising due to degraded solvent versus normal operating variation, allowing targeted intervention rather than a blanket increase in reboiler steam that wastes energy across the board.
Does iFactory support membrane and oxy-combustion capture, or only amine systems?
The platform supports amine-based, membrane, and oxy-combustion capture technologies, with monitoring models adapted to the specific failure and degradation patterns relevant to each process.
Talk to Support about the configuration appropriate for your capture technology.
How long before our team sees a measurable improvement in capture performance?
Most plants identify their first actionable inefficiency, commonly a reboiler control tuning issue or an early solvent degradation trend, within the first month of live monitoring. Measurable capture rate stability typically follows within the following one to two months as corrective actions take effect.
Make Your Carbon Capture Investment Perform Like It Was Designed To
iFactory gives sustainability and operations teams continuous visibility into capture efficiency, solvent health, and energy penalty, with reporting ready for your ESG and regulatory obligations.
Continuous capture rate and energy penalty tracking
Solvent degradation modeling between lab samples
Support for amine, membrane, and oxy-combustion systems
Six-week deployment using existing DCS and historian data

.png)