Identifying Bad-Actor Equipment in Power Plants with AI-driven
By Dahlia Jackson on May 25, 2026
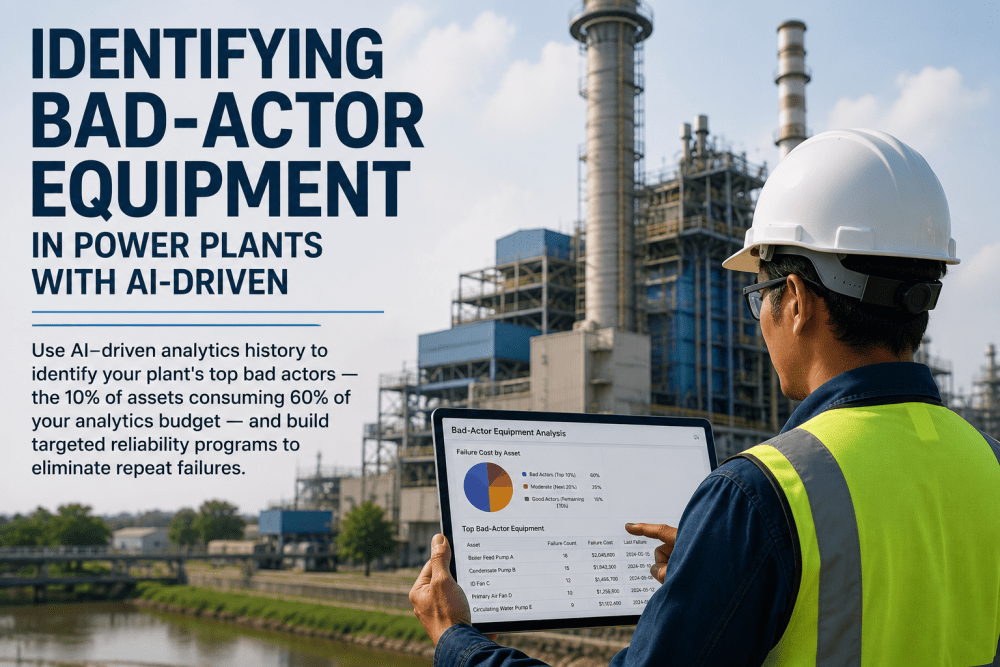
In most power plant maintenance budgets, the Pareto principle applies with uncomfortable precision: roughly 10% of the assets in the plant's CMMS account for 60% or more of the corrective maintenance spend, the unplanned downtime hours, the emergency parts procurement premiums, and the repeat failure events that consume the maintenance team's capacity and patience year after year. These are the plant's bad actors — the specific pieces of equipment whose failure pattern is the dominant driver of the maintenance cost problem, and whose systematic analysis is the highest-leverage reliability improvement activity available to the maintenance organization. The difficulty is not conceptual. Every experienced maintenance manager knows bad actors exist and knows intuitively which equipment categories are causing the most pain. The difficulty is analytical: without a connected AI-driven analytics platform that links CMMS work order history andhistorian condition data, parts cost records, and downtime impact data into a single sortable view, identifying the specific assets — not the categories, but the specific motor drives and pump trains and valve actuators — that are generating the repeat failure problem requires weeks of manual data assembly from disconnected systems. By the time the analysis is complete, the budget cycle has moved on and the findings drive another round of informal prioritization rather than systematic reliability program design. iFactory's AI-driven analytics platform automates the bad actor identification process — pulling CMMS work order history, failure mode classifications, parts spend data, downtime impact records, and condition monitoring trends into a ranked bad actor register that the reliability engineering team can act on in hours rather than weeks.
10%
of assets typically drive 60%+ of total corrective maintenance spend
3–5×
higher maintenance cost per bad actor vs. average fleet asset
68%
of repeat failures are attributable to the same root cause not permanently resolved
Weeks → Hours
bad actor identification time with AI-driven analytics vs. manual CMMS extraction
What Makes an Asset a Bad Actor — and Why the Distinction Matters for Reliability Program Design
A bad actor is not simply an asset with a long maintenance history or a high total lifetime maintenance cost. Bad actor classification requires distinguishing between three fundamentally different types of high-cost assets — because each requires a different reliability intervention, and applying the wrong intervention wastes resources without improving reliability.
Type 1: Repeat Failure Bad Actor
The same failure mode occurring on the same asset multiple times within 12 to 18 months — the classic bad actor pattern. Root cause was never permanently resolved: wrong repair specification, inadequate parts quality, operating condition that continues to drive the failure mode, or a design deficiency. Requires root cause elimination, not more maintenance frequency.
Type 2: High Unit-Cost Bad Actor
An asset with acceptable failure frequency but extremely high cost per failure event — large capital spare requirements, specialized contractor mobilization, or major consequential damage. Requires failure prevention through enhanced condition monitoring, not necessarily higher repair frequency.
Type 3: High Downtime Consequence Bad Actor
An asset whose failure frequency and unit cost may appear manageable but whose location in the production process or protection system architecture means that each failure produces disproportionate generation availability loss. Requires consequence reduction through redundancy, spares strategy enhancement, or process redesign.
Why the Classification Matters
A Type 1 bad actor treated as a Type 3 problem gets a redundancy investment that costs ten times more than a root cause fix. A Type 3 bad actor treated as a Type 1 problem gets a root cause investigation while the consequence-driving architecture goes unchanged. iFactory's bad actor analysis classifies each identified asset into the correct category automatically — directing the right intervention to each bad actor.
The iFactory Bad Actor Register: How AI Ranks Every Asset by True Failure Impact
The bad actor register is the output of iFactory's CMMS analytics module — a ranked list of every asset in the plant sorted by a composite bad actor score that weights repeat failure frequency, cost per failure event, downtime consequence, and failure mode classification consistency. The register is generated automatically from connected CMMS and historian data and updated on a configurable schedule — providing the reliability engineering team with a continuously current view of the plant's worst performers without manual data extraction. Book a Demo to see the bad actor register generated from your plant's CMMS history.
01
Repeat Failure Frequency Score
Number of work orders with the same failure mode classification on the same asset within a rolling 12-month window, weighted by the time between failures. Assets with decreasing MTBF receive amplified repeat failure scores — flagging deteriorating patterns before they reach critical frequency.
Aggregate labor hours, parts cost, contractor mobilization cost, and expedited freight premium attributed to each asset over the analysis period — normalized by asset replacement value to produce a maintenance cost ratio that enables comparison across different asset classes and sizes.
Labor + parts spendCost per failure eventMaintenance cost ratio
03
Generation Impact Score
Total megawatt-hours of generation impact attributable to each asset's failure events — combining forced outage hours, derated operation periods, and deferred load events. The generation impact score translates equipment failure into the financial language that plant management and corporate finance understand.
Forced outage hoursDerating impact MWhCapacity value lost
04
Failure Mode Consistency Analysis
Classification of whether repeat failures on the same asset share the same failure mode — distinguishing assets with a single unresolved root cause from assets with multiple independent failure modes that require different interventions. Single-mode repeaters are the highest-leverage root cause analysis candidates.
Failure mode mappingRoot cause candidatesSingle vs multi-mode classification
05
Condition Trend Correlation
Correlation between AI condition monitoring signals — vibration amplitude, bearing temperature, current signature deviation — and failure event timing for each bad actor. Assets where the condition signal reliably precedes failure events are flagged as condition-monitorable bad actors — candidates for predictive maintenance program enrollment rather than root cause redesign.
Pre-failure signal patternPredictive maintenance candidatesDetection lead time estimate
06
Composite Bad Actor Score & Ranking
The configurable composite score that combines the five component indices into a single ranked bad actor register — with weighting adjustable for each plant's specific priority balance between cost reduction, reliability improvement, and generation availability protection. The ranked register is the starting point for every bad actor reliability program.
Want to see a bad actor register generated from your plant's CMMS history? Book a 30-minute demonstration with iFactory's reliability analytics team.
From Bad Actor Register to Reliability Program: The 5-Stage Intervention Workflow
Identifying the bad actors is half the problem. The other half is designing and implementing the specific reliability interventions that eliminate or manage each bad actor's contribution to the maintenance cost and availability problem. iFactory's reliability workflow connects the bad actor register to a structured five-stage intervention process that produces documented root cause findings, implemented corrective actions, and verified performance improvement for each addressed bad actor.
Swipe to see full workflow
Stage 1
Bad Actor Register Generation
AI-driven CMMS analysis produces ranked bad actor register with composite scores, failure mode classifications, and cost impact quantification for each asset.
Automated output
Stage 2
Bad Actor Type Classification
Each ranked bad actor is classified as Type 1 (repeat failure), Type 2 (high unit cost), or Type 3 (high downtime consequence) — directing the correct intervention type.
Classification gate
Stage 3
Root Cause Analysis
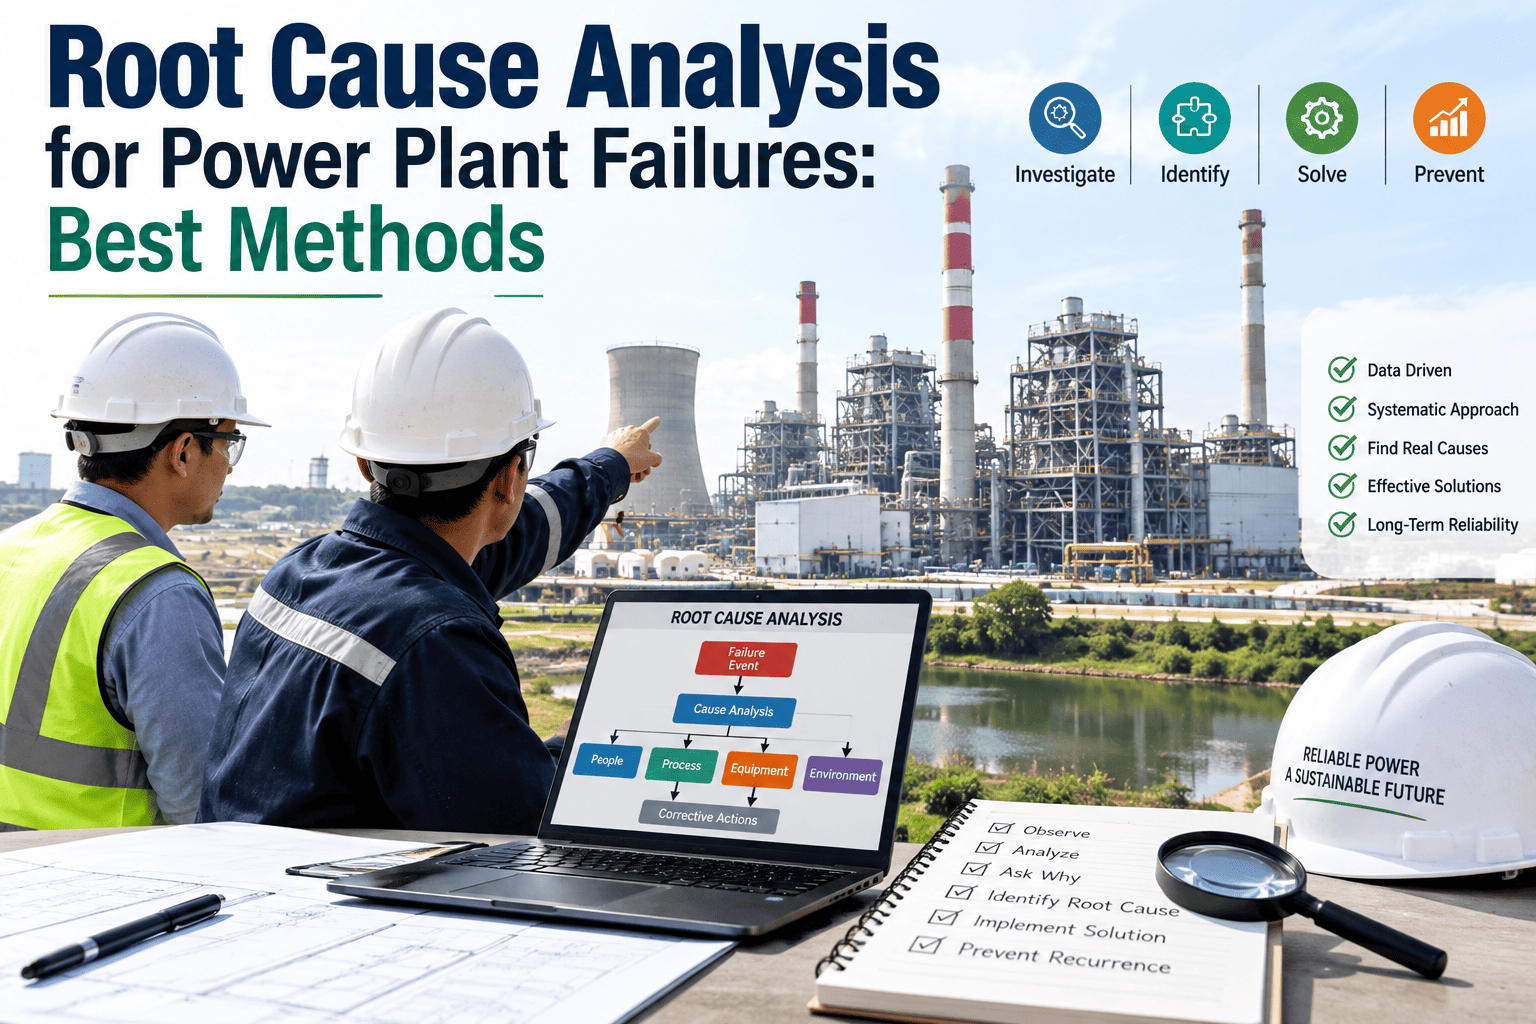
Structured root cause investigation for Type 1 bad actors using CMMS work order history, condition monitoring trends, maintenance procedure review, and operating condition analysis.
Engineering investigation
Stage 4
Corrective Action Implementation
Documented reliability improvement actions — design modification, procedure change, parts specification upgrade, or predictive monitoring enrollment — linked to each bad actor record with implementation timeline and responsibility assignment.
Intervention execution
Stage 5
Performance Verification
Post-intervention MTBF tracking, maintenance cost trending, and condition monitoring performance measured against pre-intervention baseline — confirming bad actor elimination or flagging for additional intervention.
Outcome validation
The 10% of Assets Causing 60% of Your Maintenance Cost Are Identifiable in Hours — Not Weeks
iFactory's bad actor register connects your CMMS history, condition monitoring data, and generation impact records into a ranked, actionable reliability priority list — with failure mode classification and intervention type direction built in from the first output.
Bad Actor Program Results: What Changes When Systematic Identification Replaces Intuitive Prioritization
The financial and operational impact of a structured bad actor program — one supported by AI-driven identification, failure mode classification, and post-intervention verification — is consistently measurable within two to three maintenance cycles on the addressed assets. The comparison below maps the before-and-after performance on the dimensions that matter most to power plant reliability engineering teams and plant management.
A
Maintenance Cost Concentration Visibility
Before: maintenance spend by asset category visible but individual asset cost concentration invisible without manual extraction. After: ranked bad actor register shows the specific assets consuming disproportionate maintenance budget — enabling targeted investment rather than category-level budget decisions.
B
Root Cause vs. Symptom Treatment
Before: repeat failures on the same asset addressed with the same repair scope each time — never escalating to the root cause investigation that would eliminate the recurrence. After: failure mode consistency analysis automatically flags single-mode repeaters for root cause investigation — separating assets that need engineering intervention from assets that need better maintenance execution.
C
Reliability Program ROI Documentation
Before: reliability improvement activities difficult to connect to financial outcomes because pre-intervention cost baselines were not systematically documented. After: bad actor register generates pre-intervention cost baseline for each addressed asset — enabling post-intervention verification that produces the documented ROI evidence that justifies continued reliability program investment to plant management.
D
Predictive Maintenance Program Targeting
Before: predictive maintenance sensor deployment based on asset criticality rankings set at commissioning — not updated from actual failure history. After: condition trend correlation analysis identifies which bad actors have reliable pre-failure condition signals — targeting predictive maintenance investment at the assets where it will prevent real failures, not just monitor assets that haven't failed recently.
Expert Perspective: What Reliability Engineers Say About AI-Driven Bad Actor Analysis
"I had a condensate pump train that I knew intuitively was a bad actor — the maintenance team was in it every four to six months, always with a bearing failure. We kept doing the same repair and it kept coming back. When I finally ran a systematic analysis after deploying connected analytics, I found three things the intuitive picture had missed completely. First, this was not our worst bad actor by total annual cost — there were two valve actuator populations consuming more maintenance budget but spread across enough individual assets that no single one looked terrible. Second, the condensate pump failures were all within eight months of each shaft realignment — which pointed directly at a piping stress problem we had never investigated. Third, the two valve actuator populations had completely different failure mode patterns: one was a lubrication frequency issue that operations could resolve, and one was a vendor design problem that required a fleet modification. Without the failure mode consistency analysis the AI system produces, we would have spent another year treating all three problems the same way. With it, we eliminated two of the three root causes within six months and dropped our top-ten bad actor maintenance spend by 34 percent in the first year."
— Reliability Engineer, 420 MW Combined Cycle Plant, U.S. Mid-Atlantic — 9 Years in Power Plant Reliability — CMRP Certified, RCA Practitioner
34%
top-10 bad actor spend reduction in year one of systematic program
6 mo
to eliminate two of three root causes after AI-driven classification
3 types
of bad actors found — invisible without failure mode consistency analysis
Conclusion: Bad Actor Identification as the Foundation of Every Reliability Investment Decision
The bad actor register is not a one-time analysis — it is the continuously updated foundation on which every subsequent reliability investment decision should be built. The predictive maintenance sensors you add next quarter should go on the bad actors where condition trend correlation confirms pre-failure signal reliability. The root cause investigations your reliability engineer conducts next month should start with the single-mode repeat failure bad actors that the failure mode consistency analysis has already identified as highest-probability RCA candidates. The capital spares you stock for next year's outage should be sized against the failure frequency and consequence data the bad actor register already contains.
What iFactory's AI-driven bad actor analysis delivers is not a new management philosophy — it is the data infrastructure that makes the reliability management principles every power plant reliability team already believes in actually executable at the speed and specificity that creates measurable results. The 10% of assets driving 60% of your maintenance cost are already in your CMMS. iFactory makes them visible, classifies them correctly, and connects them to the interventions that eliminate or manage their contribution to the problem. Book a Demo to see your plant's bad actor register generated from your existing CMMS history.
Frequently Asked Questions
How much CMMS history does iFactory need to generate a meaningful bad actor register?
A minimum of 18 to 24 months of work order history produces a statistically meaningful bad actor ranking — enough data to distinguish genuine repeat failure patterns from random variation, establish cost baselines per asset, and identify failure mode consistency trends. Longer histories (3 to 5 years) enable more reliable MTBF calculations and provide the pre-intervention baselines needed for post-program ROI verification. For plants with shorter CMMS history — for example, after a CMMS migration — iFactory can supplement the digital record with manual entry of paper-based maintenance histories for the highest-priority asset categories, focusing the historical data quality effort where it matters most. Plants with multiple units can also use fleet-level analysis to extend the effective history by pooling failure data across identical or similar equipment populations on different units. Book a Demo to review your CMMS history completeness against the bad actor analysis requirements.
Can the bad actor register identify bad actors within an asset population — for example, specific pump serial numbers within a fleet of identical pumps?
Yes — individual asset identification within a population of identical equipment is one of the bad actor register's most practically valuable outputs. When a plant operates twelve identical circulating water pumps, and three of them account for 70% of the pump fleet's maintenance spend, the fleet-level analysis that misses this individual asset variation is providing incomplete information for reliability investment decisions. iFactory's bad actor analysis identifies individual asset serial numbers as the unit of analysis — so the three problematic pumps are specifically identified against the nine healthy-condition peers, and the comparison between failure histories of structurally identical assets provides the strongest possible evidence for root cause investigation. Individual within-population bad actors are particularly common in power plants because operating position, process fluid quality, and installation quality vary significantly between nominally identical assets.
How does the platform handle failure mode classification when work order descriptions in the CMMS are inconsistent or incomplete?
Inconsistent CMMS work order descriptions — a pervasive data quality issue in virtually every power plant CMMS — are addressed through iFactory's natural language processing classification layer, which applies machine learning to extract probable failure mode classifications from free-text work order descriptions. The NLP engine is trained on power plant maintenance vocabulary and can classify work orders with descriptions as varied as "replaced bearing — vibration high," "BB fail," and "bearing failure rotating equipment" to the same failure mode category. Classification confidence scores are shown alongside each work order's assigned failure mode — allowing the reliability engineer to review and correct low-confidence classifications before they influence the bad actor scoring. Over time, the platform learns from the reliability engineer's corrections and improves classification accuracy for the plant's specific work order description vocabulary. Book a Demo to see the NLP classification applied to a sample of your plant's work order data.
How does the bad actor program connect to predictive maintenance deployment — should we do predictive maintenance first, or bad actor analysis first?
Bad actor analysis should precede predictive maintenance deployment for two reasons. First, bad actor analysis identifies which specific assets have demonstrated failure patterns that predictive maintenance can interrupt — targeting sensor deployment at the assets where condition monitoring will prevent real failures rather than simply monitoring assets that happen to be classified as critical. Second, the condition trend correlation analysis in the bad actor register identifies which specific bad actors have reliable pre-failure condition signals — the essential prerequisite for predictive maintenance effectiveness. Deploying vibration monitoring on every bad actor is wasteful; deploying it on the bad actors where the failure is demonstrably preceded by a detectable vibration signature is targeted and ROI-positive. In practice, the two programs run in parallel: bad actor analysis identifies the priority targets, and predictive maintenance is deployed sequentially on the bad actors where condition monitorability is confirmed by the platform's analysis.
What does a complete bad actor elimination program look like at a power plant, and what are realistic outcome benchmarks?
A complete bad actor program at a 300 to 500 MW thermal plant typically runs in two phases over 18 to 24 months. Phase 1 (months 1–6) focuses on the top 5 to 10 bad actors by composite score — completing root cause investigations, implementing corrective actions, and verifying MTBF improvement. Phase 2 (months 7–18) expands to the next tier of bad actors, integrates predictive maintenance enrollment for condition-monitorable assets, and establishes the ongoing monitoring cycle that keeps the bad actor register current. Realistic outcome benchmarks from power plant reliability programs structured this way: 25 to 40% reduction in top-10 bad actor maintenance spend within 12 months, 30 to 50% reduction in repeat failure frequency on specifically addressed bad actors, and 10 to 20% improvement in overall corrective maintenance work order volume from the plant-level spillover effect of eliminating the high-frequency repeaters. The specific outcomes depend heavily on the original bad actor severity and the availability of root cause elimination options — which iFactory can model from your CMMS history before the program investment is committed. Book a Demo to see a site-specific bad actor program outcome projection for your plant.
Your Plant's Top Bad Actors Are Already in Your CMMS. iFactory Makes Them Visible.
iFactory's AI-driven bad actor register pulls CMMS history, condition monitoring data, and generation impact records into a ranked, classified, actionable reliability priority list — with intervention type direction and pre-intervention cost baselines built in from the first output. Book a 30-minute demonstration.