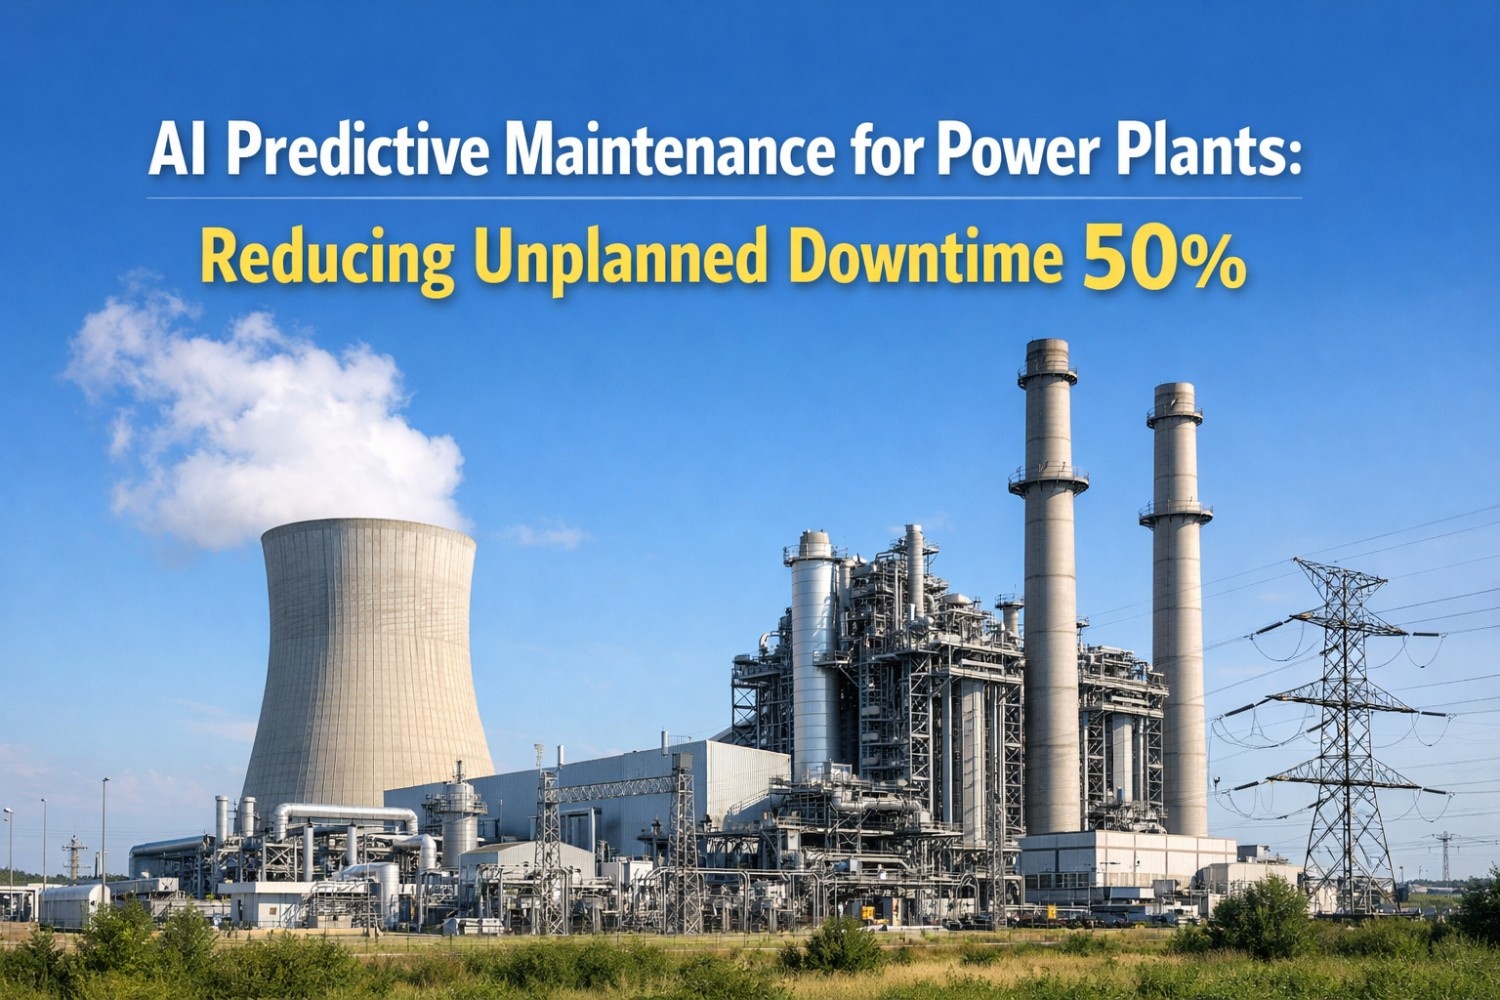
Reactive to Predictive analytics Roadmap: Power Plants
By James Shakespeare on May 26, 2026
Most power plant maintenance programs are not failing because they lack good engineers. They are failing because the information architecture those engineers depend on was designed for different era — one where equipment condition was assessed through scheduled inspections, failure was accepted as an operational cost, and maintenance planning meant coordinating a calendar rather than responding to an asset's actual condition signal. The result is reactive maintenance cycle that most plant managers recognize immediately: something fails, the response is mobilized, the repair costs three to five times what a planned intervention would have cost, and the production loss compounds the damage. The irony is that every modern power plant generates the sensor data that would have flagged the failure coming. The vibration signature that precedes a bearing failure develops over weeks. The temperature gradient that indicates an insulation problem evolves over months. The efficiency degradation that signals an impending forced outage is visible in heat rate data long before the protection system trips. The information is there. The architecture to act on it systematically is what most plants do not yet have. This roadmap lays out the four-stage journey from reactive maintenance to AI-driven predictive analytics — with 90-day milestones, measurable ROI at each stage, and a practical framework for how iFactory's platform supports every step of the transformation. For a conversation about where your plant sits on this roadmap today,
Analytics Maturity · Power Plant · Roadmap 2026
Reactive to Predictive Analytics Roadmap: The 4-Stage Journey Every Power Plant Must Navigate
A proven progression from reactive crisis management to AI-driven predictive analytics — with 90-day milestones, measurable ROI benchmarks, and the iFactory platform capabilities that support each stage of the transformation.
Reactive — most plants start here: breakdown-driven, no systematic condition data
Stage 2
Condition monitoring — sensors connected, but data siloed and manually reviewed
Stage 3
Predictive analytics — AI models flag failures 2–8 weeks before they occur
Stage 4
Prescriptive intelligence — AI recommends and schedules interventions automatically
Why Most Plants Are Stuck at Stage 1
The Four Structural Barriers That Keep Power Plants Reactive
Understanding why plants remain reactive despite having monitoring infrastructure is the first step in building a credible path forward. The barriers are not technical — they are organizational and architectural.
Data Silos
Vibration data in the predictive maintenance vendor's system. Temperature data in the DCS historian. Work orders in the CMMS. No integration layer connects these systems — so the cross-parameter patterns that precede failures are invisible to any individual reviewer.
Most common barrier
Alert Fatigue
Monitoring systems generate hundreds of alerts per day at most plants. Without prioritization and context, maintenance teams habituate to alerts — the real early-warning signals are buried in the noise of nuisance alarms that have triggered without consequence dozens of times before.
Second most common
Analyst Bottleneck
Interpreting condition monitoring data requires specialist knowledge that most plants concentrate in one or two engineers. When those specialists are unavailable — on leave, on outage support, managing multiple facilities — the data goes unreviewed and the maintenance program effectively reverts to reactive.
Workforce vulnerability
Planning Gap
Even when a condition problem is identified, the path from alert to planned maintenance work order requires manual steps — work order creation, parts identification, scheduling, contractor coordination — that are slow enough that the planning window closes before the intervention is scheduled.
Execution failure point
The Cost of Staying Reactive
Emergency maintenance in power generation costs 3–5× more than planned maintenance for the same scope — in parts, labor, contractor mobilization, and outage duration. A single unplanned forced outage on a 500 MW unit at $50/MWh replacement power costs $600,000 per day. Plants running 30–40% unplanned versus planned maintenance ratios — the industry average — are paying a premium of $2–8 million annually that the predictive analytics transformation directly recovers. The ROI of moving from Stage 1 to Stage 3 is not incremental — it is structural. The question is not whether to make the transition. It is how fast and in what sequence.
Reactive Operations vs. Predictive Intelligence: What Actually Changes
The difference between reactive and predictive is not just about catching failures earlier. It changes the entire operational posture of the maintenance organization — from firefighting to planning, from cost to investment, from variability to consistency.
Reactive Operations — Stage 1
Firefighting, Cost Overruns, and Unpredictable Availability
Maintenance is triggered by failure or fixed-interval schedules disconnected from actual equipment condition. Emergency repair costs consume 60–70% of the maintenance budget. Outage planning is disrupted by unplanned events. Leadership cannot predict reliability with confidence. Experienced technicians spend their careers responding to failures that the data — if organized — would have predicted weeks earlier.
Emergency repair cost 3–5× plannedUnpredictable forced outagesTechnicians as firefightersData exists but goes unanalyzed
Predictive Intelligence — Stage 3–4
Planned Interventions, Budget Predictability, and Confident Reliability
AI analytics flags developing equipment problems 2–8 weeks before threshold breach. Maintenance is planned to align with operational windows, confirmed parts, and available specialists. Emergency repairs drop to 10–15% of maintenance activity. Leadership can commit to availability targets with data-backed confidence. Technicians operate as diagnosticians and planners — using their expertise where it adds the most value.
2–8 week failure advance warningPlanned maintenance 85%+ of workPredictable budget and availabilityTechnicians as strategic planners
The 4-Stage Roadmap
Stage-by-Stage: How Power Plants Move from Reactive to Predictive with iFactory
Each stage builds on the previous one — delivering measurable ROI before the next investment is required. Most plants complete Stages 1 through 3 within 12–18 months. Book a demo to see how iFactory accelerates each stage transition for your facility.
01
Stage 1 → 2: Data Integration and Baseline Establishment (Days 1–90)
The foundational move from reactive to condition-aware. Connect existing SCADA historian, DCS data, and CMMS work order records into iFactory's unified analytics layer. Establish performance baselines for priority assets — the turbine-generators, boiler feed pumps, air compressors, and fans that account for 80% of forced outage risk. Deploy standardized downtime categorization so that every work order begins building the historical record that AI models need. At the end of Day 90, the plant has — for the first time — a single view of all equipment condition data, a documented baseline for each critical asset, and a work order history that can be analyzed for patterns. This stage alone typically reduces unplanned overtime by 15–20% simply by improving visibility into what is actually failing and when.
90-day milestone: Unified data view + asset baselines established
02
Stage 2 → 3: AI Model Deployment and Predictive Alert Activation (Days 91–180)
With baselines established and historical data accumulating, AI anomaly detection models are trained on each priority asset's operating profile. The models learn what normal looks like for that specific machine at that plant — accounting for load variations, seasonal temperature effects, and unit-specific characteristics that generic fleet models miss. Predictive alerts are configured to generate maintenance recommendations at the specific lead time required for planning — typically 2–6 weeks before projected threshold breach. Each alert generates a draft CMMS work order with the indicated scope, required parts, and scheduling parameters. In this stage, the maintenance team's role shifts from responding to failures to validating and scheduling AI-generated recommendations. First-pass validation rates above 80% — where the maintenance team confirms the alert is actionable without modification — are typically achieved within 60 days of model activation.
180-day milestone: Predictive alerts live on priority assets, 40–60% unplanned reduction
03
Stage 3 Optimization: Coverage Expansion and Model Refinement (Days 181–365)
The predictive model is performing on priority assets. In the second half of Year 1, coverage expands to balance-of-plant equipment — auxiliary systems, cooling towers, heat exchangers, and electrical infrastructure — where condition-based maintenance can prevent the secondary failures that compound primary outage events. Model performance is continuously measured against actual maintenance outcomes: alerts that correctly predicted failures are reinforced, false positive patterns are corrected, and lead time accuracy improves with each completed maintenance event. By end of Year 1, most iFactory deployments achieve 70–80% planned versus unplanned maintenance ratios, reduction in maintenance cost per MWh in the 20–35% range, and availability improvements of 0.5–1.5 percentage points — each of which represents significant revenue and cost impact at scale.
Stage 4: Prescriptive Intelligence and Autonomous Optimization (Year 2+)
The final stage moves beyond detecting what is going wrong to recommending the optimal intervention — when to act, at what scope, with what resources, and how to sequence interventions to minimize total outage time while maximizing equipment life. Prescriptive intelligence integrates maintenance recommendations with outage planning, parts inventory, contractor scheduling, and budget cycles. The maintenance organization shifts from a reactive response function to a strategic asset management program — making long-range capital and maintenance investment decisions based on AI-modeled equipment life projections and risk-ranked condition data. Plants at Stage 4 consistently achieve 85–90%+ planned maintenance ratios, maintenance cost reductions of 30–45%, and availability improvements of 1–2 percentage points above Stage 1 baselines.
Year 2+ milestone: 85–90% planned ratio, autonomous work order generation
See Your Plant's Roadmap
Where Does Your Plant Sit on the Reactive-to-Predictive Journey? Get a Stage Assessment in 30 Minutes.
We evaluate your current data infrastructure, monitoring coverage, CMMS maturity, and maintenance ratio to identify exactly which stage you are at — and the specific interventions that will move you to the next stage fastest. Most plants leave with a prioritized 90-day action plan.
ROI at Each Stage: What the Numbers Look Like for a 500 MW Plant
These benchmarks reflect documented outcomes from iFactory deployments and industry research on maintenance program transformation. Values are illustrative for a 500 MW combined cycle plant operating 6,000 hours per year at $50/MWh replacement power cost.
Stage-by-Stage ROI Benchmark — 500 MW Combined Cycle Reference Plant
Metric
Stage 1: Reactive
Stage 2: Condition-Aware
Stage 3: Predictive
Stage 4: Prescriptive
Planned vs. Unplanned Ratio
30–40% planned
50–60% planned
70–80% planned
85–90% planned
Emergency Repair Cost Premium
3–5× planned cost
2–3× (fewer events)
1.3–1.8× (rare events)
Near parity
Forced Outage Rate
Baseline (high)
10–20% reduction
35–55% reduction
60–75% reduction
Maintenance Cost per MWh
Baseline (100%)
85–92% of baseline
65–80% of baseline
55–70% of baseline
Availability Factor Improvement
0%
+0.2–0.5%
+0.5–1.5%
+1.0–2.0%
Annual Revenue Recovered (500 MW)
Baseline
$0.5–1.5M
$1.5–4.5M
$3–6M+
iFactory Deployment Timeline
—
Days 1–90
Days 91–180
Year 2+
Expert Perspective: What Plant Managers Say About the Transformation
Senior power plant operations professionals who have completed the reactive-to-predictive journey consistently identify the same inflection points — and the same barriers that delayed the transition.
We had condition monitoring equipment on all of our critical rotating machines and had for over a decade. But we still had a 35% unplanned maintenance ratio and we were spending close to $4 million a year in emergency repair premiums and replacement power costs. When we finally sat down and asked why, the answer was embarrassingly simple: the vibration data was in one system, the temperature data was in another, the work orders were in a third, and nobody was looking at all three together. Our best reliability engineer could do it — when he had time, which was rarely. When we deployed iFactory and connected all three data streams, we identified seven assets in the first two weeks that had developing problems we hadn't seen. Four of them would have caused forced outages within 60 days based on the trend velocity. The total avoidance value from those four events alone exceeded our annual platform cost. That was before we even got to the systematic improvements. The insight I would give to any plant manager considering this: the barrier is not the technology and it is not the data. You already have the data. The barrier is the integration architecture that lets you see what your data is telling you. Once that architecture exists, the decisions become obvious.
Plant Manager, 750 MW Combined Cycle Power Station22 Years Power Generation Operations · Former Fleet Reliability Director, Major U.S. Utility · ASME Turbomachinery Committee Member · EPRI Generation Asset Management Program Advisor
50%
Reduction in unplanned maintenance events within 6 months of Stage 3 activation
70%
Planned vs. unplanned maintenance ratio achieved at Stage 3 — vs. 35% average at Stage 1
30%
Maintenance cost per MWh reduction documented at Stage 3 vs. Stage 1 baseline
6 mo
Average time from iFactory deployment to measurable ROI exceeding platform investment
Book a Demo to see iFactory's stage-by-stage deployment approach applied to your plant's specific equipment configuration and current analytics maturity level.
Conclusion
Every Power Plant Has the Data to Be Predictive. The Missing Piece Is Integration.
The Reality
The Data Is Already There
Every power plant that has been operating for more than five years has a condition monitoring data history that, properly organized and analyzed, contains the patterns that predict its most costly failures. The sensor data, the work order records, and the DCS historian data collectively tell the story of every piece of equipment on site. The story is written — but for most plants, no one is reading it systematically.
The Cost
Staying Reactive Is a Choice With a Measurable Price
The reactive maintenance premium — emergency cost multipliers, replacement power costs during forced outages, component damage from run-to-failure that extends repair scope — is not accidental. It is the measurable financial consequence of a specific organizational choice: to manage equipment by response rather than by condition. That choice becomes increasingly expensive as equipment ages and as capacity margins tighten.
The Path
The Transition Is Staged, Not Overnight
The reactive-to-predictive transformation is not a single technology purchase — it is a staged capability building exercise that delivers measurable ROI at every step. Stage 1 to Stage 2 delivers data visibility and baseline establishment within 90 days. Stage 2 to Stage 3 delivers predictive alerts within 180 days. The ROI at each stage funds the investment in the next. Most plants see total platform cost recovery within 6–12 months of Stage 3 activation — from a single avoided forced outage.
The Decision
The Best Time to Start Was Last Year. The Second Best Time Is Now.
Every month a plant operates in reactive mode is a month of maintenance premium payments that the predictive analytics transformation would have eliminated. The 90-day path to Stage 2 — data integration and baseline establishment — requires no new sensors, no hardware investment, and minimal IT involvement. It requires connecting the data sources that already exist to an analytics layer that reads them systematically. Book a Demo to see iFactory's Stage 1-to-2 activation path for your specific plant configuration and begin the transition that every reactive plant eventually makes — ideally before the next forced outage rather than after.
iFactory Capabilities at Each Roadmap Stage
iFactory's platform delivers the specific capability needed at each stage of the transformation — not a monolithic deployment, but a staged rollout that matches investment to readiness and delivers ROI before the next phase begins.
Multi-Source Data Integration
SCADA, DCS historian, CMMS work orders, vibration monitoring, and process data connected into a single unified analytics layer via OPC-UA, MQTT, and API connections.
Stage 1→2
Asset Baseline Modeling
Unit-specific performance baselines established for each critical asset from historical operating data — corrected for load, temperature, and seasonal variation to isolate true condition trends from operating variation.
Stage 1→2
AI Anomaly Detection
Machine learning models trained on each asset's operating profile detect developing problems from cross-parameter patterns 2–8 weeks before threshold breach — with configurable lead times matched to planning requirements.
Stage 2→3
Automated Work Order Generation
Predictive alerts automatically generate CMMS work orders with scope definition, required parts, scheduling windows, and specialist requirements — converting detection into planned action without manual intervention.
Stage 2→3
Maintenance KPI Dashboard
Real-time planned vs. unplanned ratio, maintenance cost per MWh, mean time between failures, and alert-to-work-order lead time — giving management the visibility to measure and drive the transformation.
All Stages
Prescriptive Optimization
Stage 4 capability: AI recommends optimal intervention timing, scope, and sequencing — integrating with outage planning, parts inventory, contractor scheduling, and budget cycles for fully autonomous maintenance optimization.
Stage 3→4
Start Your Roadmap Today
iFactory's Reactive-to-Predictive Roadmap — Staged, ROI-Driven, Built for Power Plants
iFactory's platform connects your existing data sources, establishes asset-specific baselines, activates AI predictive alerts, and integrates with your CMMS — delivering measurable ROI at every stage of the transformation without requiring new sensors, hardware replacement, or long IT implementation cycles.
Stage 1→2 live in 90 days, no new hardware
Predictive alerts active at Stage 3, 180 days
ROI typically exceeds platform cost within 6 months
Reactive to Predictive Analytics Roadmap — Frequently Asked Questions
How do we assess which stage our plant is currently at before starting the roadmap?
iFactory's stage assessment evaluates four dimensions: data infrastructure maturity (what data is collected, how it is stored, and whether it is integrated); monitoring coverage (which asset classes have condition monitoring and at what fidelity); CMMS utilization (whether work orders are being used systematically and whether maintenance history is captured consistently); and maintenance ratio (what percentage of maintenance work is planned versus unplanned). Most plants can complete a preliminary self-assessment in under an hour — and iFactory's 30-minute stage assessment call produces a more detailed evaluation with specific gap identification and prioritization. Book a Demo to schedule your stage assessment with iFactory's power generation analytics team.
Does the roadmap require replacing our existing CMMS or condition monitoring systems?
No. iFactory is designed to integrate with existing plant systems rather than replace them. The Stage 1-to-2 transition connects existing data sources — DCS historians, existing CMMS platforms (IBM Maximo, SAP PM, Infor EAM, and others), existing vibration monitoring systems, and SCADA data — into iFactory's unified analytics layer via standard OPC-UA, MQTT, and REST API connections. The existing systems continue to operate as they do today; iFactory adds the integration layer that makes cross-system analysis possible. Only in cases where the existing CMMS lacks basic functionality does iFactory's own work order module serve as an alternative — and even then, migration is gradual and optional.
How long does it realistically take to see ROI from the Stage 2-to-3 transition?
The ROI timeline depends on the plant's starting failure frequency and the value of the outages the predictive analytics prevents. For plants with regular unplanned forced outages — which characterize most Stage 1 operations — the first avoided outage typically delivers ROI that exceeds the platform's annual cost. In iFactory's power generation deployments, the average time from Stage 3 activation to first documented ROI event (an avoided outage or an early intervention that prevented escalation) is 6–10 weeks. Full platform cost recovery, measured against the documented cost of avoided outages and maintenance cost reductions, typically occurs within 6–12 months of Stage 3 activation. The specific timeline depends on how frequently the plant was experiencing unplanned events at Stage 1 — higher reactive frequency means faster ROI from the transition.
What happens if our plant has limited historical data because we recently commissioned or recently changed systems?
Limited historical data affects the AI model's initial accuracy but does not prevent Stage 2 or Stage 3 activation. iFactory uses two complementary approaches for plants with limited history. First, fleet-level knowledge bases for common power plant equipment types (gas turbines, steam turbines, boiler feed pumps, air compressors) provide pre-trained baseline models that deliver meaningful anomaly detection immediately, even before plant-specific history has accumulated. Second, the integration period — typically 8–16 weeks — rapidly builds unit-specific baseline data from the plant's actual operating profile, progressively replacing the fleet-level models with plant-specific models as confidence intervals improve. Both model types display confidence level indicators in the alert interface, so the maintenance team understands whether an alert is from a mature plant-specific model or a newer fleet-level model — and calibrates their response threshold accordingly.
How does iFactory help manage the cultural change from reactive to predictive — not just the technology?
The technology transition is typically easier than the organizational one. Maintenance teams that have operated reactively for years have developed work patterns, priority systems, and decision reflexes that are optimized for firefighting — and those patterns do not automatically change when a new platform is deployed. iFactory addresses the organizational dimension through three integrated approaches: structured alert validation workflows that require maintenance engineers to engage with each predictive alert and record their decision (accept, defer, or reject) — which builds familiarity with the AI recommendations and creates the feedback loop that improves model accuracy; KPI dashboards that make the planned-vs.-unplanned ratio visible to both maintenance teams and management — creating accountability for the transition progress; and staged deployment that proves ROI through documented avoided events before asking the organization to fully commit to the new operating model. The most successful deployments involve early identification of a maintenance champion — typically a reliability engineer — who validates alerts, builds credibility with the maintenance team, and becomes the internal advocate for the predictive analytics program as it matures.