Steel production cost per tonne is the single most important competitive indicator in the industry — and maintenance is one of its largest controllable components. When hot-rolled coil prices soften and integrated mills face margin compression, the production cost per tonne determines who can price competitively and who cannot. Maintenance spending typically accounts for 10 to 15% of total steel production cost — $12 to $22 per tonne at most U.S. facilities — making it the third-largest cost driver behind raw materials and energy, and the one where the gap between top-quartile and bottom-quartile performers is widest. A top-quartile U.S. integrated mill operates at $11.40 to $13.80 per tonne in maintenance cost. A bottom-quartile facility operating on reactive maintenance with unoptimized PM intervals and poor contractor performance management runs $18.20 to $24.60 per tonne — a $6 to $11 per tonne disadvantage that compounds directly into every competitive pricing decision the facility makes. The challenge is not understanding that maintenance costs too much. Every steel plant maintenance manager knows that. The challenge is having the cost analytics infrastructure to see, at the asset level and production process level, exactly where the maintenance dollar is being consumed relative to the tonne of steel being produced — and to connect that visibility to the specific PM optimization, contractor management, and predictive maintenance decisions that reduce the cost-per-tonne number without the reliability deterioration that turns today's cost saving into tomorrow's unplanned downtime. iFactory's cost analytics and KPI dashboard delivers that infrastructure. Steel facilities deploying iFactory's cost per tonne analytics platform reduce maintenance cost per tonne by $3.80 to $7.20 within 18 months — moving from the industry median to top-quartile performance — while simultaneously improving asset availability and reducing unplanned downtime hours.
The Steel Production Cost Per Tonne Anatomy: Where Maintenance Fits and Why It's the Most Actionable Variable
Understanding maintenance cost per tonne in the context of total steel production cost requires breaking down the full cost stack and identifying where maintenance sits relative to other cost drivers. Raw materials — iron ore, scrap, coke, and alloys — typically account for 55 to 65% of production cost per tonne and are largely determined by global commodity markets that individual facilities cannot control in the short term. Energy — natural gas, electricity, and oxygen — represents 12 to 18% of production cost and is influenced by procurement strategy but also by market rates outside the plant's immediate control. Labor represents 8 to 12% and is constrained by collective bargaining agreements and local market rates. Maintenance — at 10 to 15% — is the production cost category where the combination of management discipline, technology deployment, and analytical rigor has the largest and fastest impact. A plant cannot unilaterally change its iron ore cost or its electricity tariff, but it can move from the bottom quartile to the top quartile of maintenance cost performance within 18 months through analytically driven PM optimization, contractor performance management, and reactive maintenance reduction. That move saves $6 to $11 per tonne — which in a 2-million-tonne facility represents $12 to $22 million in annual cost reduction.
The iFactory Cost Per Tonne KPI Dashboard: Making Maintenance Cost Visible at Every Level
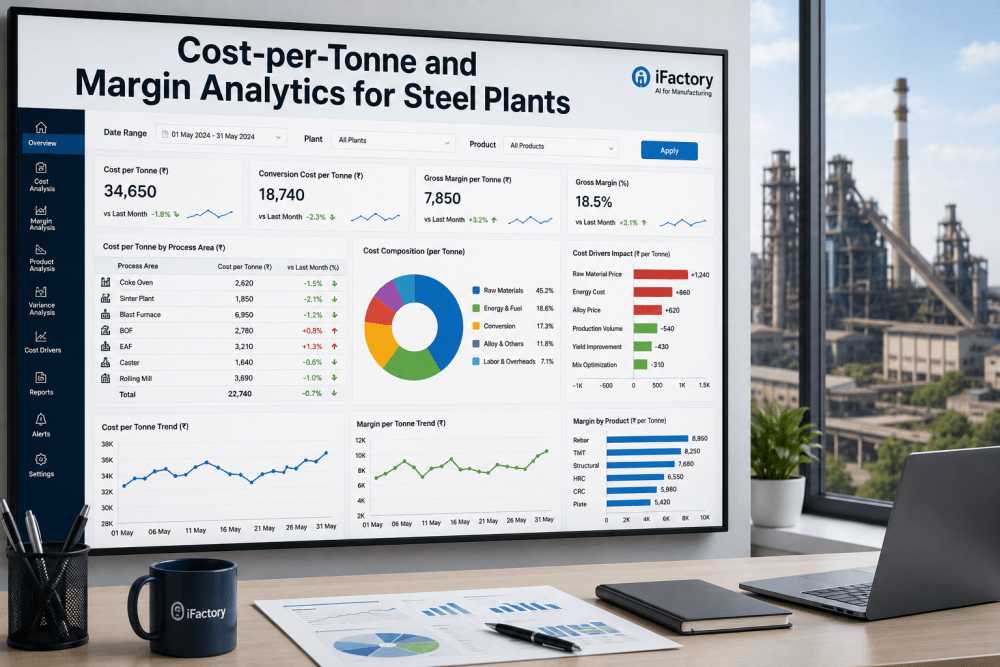
The fundamental problem with maintenance cost per tonne as a management metric is that most facilities can calculate it at the total plant level but cannot see it at the process area, asset class, or individual asset level — which means they know they have a cost problem but cannot identify where the problem is concentrated. iFactory's cost per tonne KPI dashboard disaggregates the total maintenance cost into the hierarchical views that make cost reduction decisions possible: by production process, by asset class, by maintenance type, and by individual asset. Book a Demo to see the cost per tonne dashboard built on your facility's actual production and maintenance data.
Process Area Cost Per Tonne — Finding the Concentration
The process area view allocates total maintenance cost to the production processes that consumed it — melt shop (EAF or BOF and blast furnace), continuous casting, rolling mill, finishing, and utilities — normalized by the tonnes produced through each process area. This view reveals the process areas where maintenance cost per tonne is disproportionately high relative to the complexity and asset intensity of the process, identifying the highest-leverage improvement targets. In most U.S. steel facilities, one or two process areas account for 40 to 55% of total maintenance cost while representing a smaller fraction of installed asset value — a concentration that is invisible in the total facility cost number but visible immediately in the process area breakdown.
Maintenance Type Cost Per Tonne — The Planned vs. Reactive Split
The maintenance type view is the most actionable breakdown for cost reduction — it shows the cost per tonne contribution of planned preventive maintenance, planned corrective maintenance, unplanned emergency maintenance, and contracted maintenance services. Emergency maintenance consistently contributes 3 to 5 times its "fair share" of cost per tonne relative to its work order volume — because each emergency event carries labor premiums, expedited parts costs, and contractor mobilization fees that planned events do not. Facilities with 45 to 65% reactive maintenance rates are paying the emergency premium on nearly half their total maintenance events, generating $4 to $8 per tonne in avoidable cost premium above what the same maintenance activities would cost if performed as planned work.
Asset Class Cost Per Tonne — Identifying the Bad Actor Cost Drivers
The asset class view identifies which equipment categories are generating disproportionate maintenance cost relative to their production value contribution — the rotating equipment that produces 18% of total maintenance cost while representing 8% of installed asset value, or the refractory systems whose campaign management accounts for 22% of melt shop maintenance cost per tonne. This breakdown is the foundation of the asset-level bad actor analysis — the specific equipment within each category generating the highest repeat failure frequency and the highest emergency maintenance cost per tonne. iFactory's asset class cost per tonne dashboard is updated monthly from CMMS work order data, giving the maintenance engineering team the specific data needed to target reliability improvement investment at the highest-value opportunities.
Trend Tracking and Benchmark Comparison — The Continuous Improvement Engine
The trend and benchmark view converts the point-in-time cost per tonne snapshot into the continuous improvement tracking tool that makes month-over-month cost reduction visible and measurable. iFactory tracks the rolling 12-month maintenance cost per tonne against the pre-intervention baseline established at platform deployment, showing the cumulative cost reduction achieved by each improvement initiative. The benchmark comparison overlays the facility's current performance against the top-quartile and median benchmarks for its production type — providing context for the absolute cost level and the gap remaining to top-quartile performance. This view is the CFO-ready dashboard that demonstrates maintenance cost reduction program ROI without requiring manual report assembly.
The Cost Per Tonne Reduction Pathway: Five Steps From Visibility to Top-Quartile Performance
Reducing maintenance cost per tonne from the industry median to the top quartile is not a single initiative — it is a structured five-step program where each step produces both immediate cost savings and the data required to execute the next step effectively. iFactory's cost analytics platform structures and tracks each step, ensuring that the progress from visibility to benchmark performance is systematic rather than opportunistic.
Establish the Cost Per Tonne Baseline by Process Area and Maintenance Type
iFactory extracts 24 months of CMMS work order cost data and normalizes it against MES production volumes to produce the first cost per tonne baseline at the process area, maintenance type, and asset class level. This baseline is the starting point for all subsequent cost reduction decisions — and typically the first time most facilities have seen their maintenance cost at this level of granularity. The baseline identifies the two or three process areas or maintenance type categories where cost concentration is highest, directing the cost reduction program at the highest-value opportunities from day one rather than spreading effort evenly across all areas.
Quantify the Reactive Maintenance Cost Premium and Identify Conversion Targets
Using the maintenance type breakdown, iFactory calculates the emergency maintenance cost premium — the additional cost per tonne generated by emergency work orders relative to the equivalent planned maintenance cost. It then identifies the specific assets and failure modes driving the highest emergency event frequency, ranking them by their per-tonne cost contribution. These are the predictive maintenance conversion candidates — the assets where deploying condition monitoring converts the highest-cost emergency events into planned work at the lowest investment per dollar of cost reduction achieved.
PM Frequency Optimization — Reducing Over-Maintained Assets' Cost Per Tonne Contribution
iFactory's PM optimization module compares each PM task interval against the actual failure rate for the covered failure mode, identifying tasks where the current interval is shorter than failure data justifies. Each optimized interval produces a measurable reduction in PM labor and parts cost per tonne — and the aggregate of all interval optimizations across the facility typically produces an 18 to 26% reduction in total PM cost per tonne within the first two planning cycles. This is pure cost reduction with no reliability trade-off, because the optimized intervals are still shorter than the MTBF for the covered failure mode.
Contractor and Materials Cost Per Tonne Rationalization
iFactory's contractor performance analytics identifies which contracted maintenance scopes are generating poor first-time-fix rates and high recall frequency — the specific performance gaps that inflate contractor cost per tonne above what the scope work should cost. Performance-based contract renegotiation targeting these gaps typically reduces contractor cost per tonne by 12 to 22%. Simultaneously, the MRO inventory optimization module identifies slow-moving stock and over-stocked items whose carrying cost contributes to maintenance cost per tonne without corresponding reliability benefit — releasing $380,000 to $920,000 per facility in capital and ongoing carrying cost.
Monthly KPI Tracking and Benchmark Convergence Verification
Once all cost reduction initiatives are running, iFactory's monthly cost per tonne dashboard tracks the convergence toward top-quartile benchmark performance — showing the cumulative reduction achieved, the annualized savings rate, and the projected arrival at the target benchmark. This tracking converts the cost reduction program from a one-time initiative into a continuous management discipline — with the CFO-ready cost per tonne dashboard making the business case for sustained reliability investment visible to leadership every month rather than once a year at budget time.
Cost Per Tonne Benchmark Matrix: Where U.S. Steel Plants Stand Across Six Cost Categories
The benchmark table below presents the current distribution of U.S. integrated and EAF steel maintenance cost performance across the six categories that collectively determine total maintenance cost per tonne. Each row shows the bottom-quartile (high cost), median, and top-quartile (low cost) performance levels — and the specific iFactory capability that drives movement toward top-quartile performance. Book a Demo to see your facility's current cost per tonne positioned against these benchmarks using your CMMS and production data.
| Cost Category | Bottom Quartile | Median | Top Quartile | Primary iFactory Lever |
|---|---|---|---|---|
| Total Maintenance Cost/Tonne | $18.20–$24.60/t | $14.80–$18.20/t | $11.40–$13.80/t | All six levers combined — cost analytics and KPI dashboard |
| Emergency/Reactive Cost/Tonne | $6.80–$9.40/t — 55–70% reactive rate | $3.60–$6.80/t — 40–55% reactive | $1.60–$2.40/t — below 20% reactive | Predictive maintenance conversion of repeat failure bad actors |
| PM Labor & Materials/Tonne | $3.20–$4.80/t — over-interval PM tasks | $2.40–$3.20/t — partial optimization | $1.60–$2.20/t — failure-rate validated intervals | PM frequency optimization against actual MTBF data |
| Contracted Services/Tonne | $4.20–$6.80/t — untracked performance | $2.80–$4.20/t — partial management | $1.80–$2.60/t — performance-managed | Contractor performance analytics and recall/rework elimination |
| MRO Inventory Carrying Cost/Tonne | $1.40–$2.20/t — 30%+ slow-movers | $0.90–$1.40/t — partial optimization | $0.48–$0.78/t — consumption-based stocking | Slow-mover reduction and safety stock right-sizing |
| Labor Efficiency Cost/Tonne | $2.60–$3.80/t — 25–35% wrench time | $1.80–$2.60/t — 38–48% wrench time | $1.10–$1.60/t — 52–62% wrench time | Work order planning, scheduling, and execution analytics |
Expert Review: What Steel Mill Financial and Maintenance Leaders Say About Cost Per Tonne Analytics
After 23 years in U.S. steel plant operations — across melt shops, hot mills, and cold mills — the most significant management change I have seen in the last five years is not a technology change. It is a measurement change. The facilities that have moved to top-quartile maintenance cost per tonne performance in the last three years are the ones that started measuring maintenance cost at the process area and asset level — not just at the total plant level. When you can only see total maintenance cost per tonne, you are managing a number. When you can see melt shop maintenance cost per tonne, you can see that it is running 40% above the mill average and investigate why. When you drill further and see that 62% of that melt shop cost is emergency maintenance on three specific equipment categories, you can build a targeted reliability program. When you drill further still and see that those three categories have detectable condition signals 3 to 4 weeks before their failure events, you can make the investment case for predictive monitoring with a specific cost per tonne reduction number attached to it. The technology to do all of this has existed for years. What changed is having a platform that automatically calculates the cost per tonne hierarchy from your CMMS and production data without requiring a month of manual spreadsheet work each time you want to look at it. When the number is available every month at every level of the hierarchy, it gets used. When it requires weeks of work to produce, it gets produced once a year and then ignored until the next budget cycle. That difference — between a metric you use continuously and a metric you produce annually — is the entire gap between top-quartile and median maintenance cost performance at most facilities I have worked with.
— VP of Operations and Maintenance, U.S. Integrated Steel Operations — 2.4 Million Ton Annual Production — 23 Years — CMRP Certified, Lean Six Sigma Black BeltConclusion
Maintenance cost per tonne in steel is not a metric that improves because someone decides to spend less on maintenance. It improves because the facility gains the analytical visibility to identify where each maintenance dollar is generating insufficient reliability or production value return — and redirects those dollars to the spend that protects asset availability and production throughput at the lowest cost per tonne. The $6 to $11 per tonne gap between bottom-quartile and top-quartile U.S. steel maintenance performance represents the difference between facilities that are competitive during price pressure cycles and facilities that are not — and it is a gap that is entirely attributable to the quality of cost analytics and management discipline applied to the maintenance function.
iFactory's cost analytics and KPI dashboard provides the measurement infrastructure that makes that management discipline executable: monthly cost per tonne by process area, maintenance type, and asset class; benchmark comparison that contextualizes the performance level; initiative ROI tracking that proves the cost reduction is real; and the continuous improvement framework that converts one-time cost reduction wins into a sustained top-quartile competitive position. Book a Demo to see the cost per tonne dashboard built on your facility's actual production and maintenance data.
Frequently Asked Questions
iFactory requires two data streams: total maintenance cost per period from CMMS work order records (labor hours × rate + parts + contractor costs), and steel production volume per period from the MES or production reporting system. Cost is allocated to process areas by the work order's asset location in the asset hierarchy, and divided by the production volume through that process area. Most facilities can provide both streams via API from existing SAP, Maximo, or MES systems within the first week of deployment. Book a Demo to review your specific data structure.
iFactory's benchmark database segments by production type (integrated mill vs. EAF mini mill), capacity range (below 1M, 1–3M, and above 3M tonnes per year), and product mix complexity (flat-rolled, long products, specialty). The benchmark comparison in the iFactory dashboard automatically selects the peer group that matches the facility's production type and capacity — so a 1.8M tonne EAF flat-rolled mill is benchmarked against comparable EAF flat-rolled operations, not against larger integrated mills with fundamentally different cost structures.
iFactory calculates cost per tonne on a rolling 12-month basis rather than a monthly point-in-time basis — which smooths the cost spike that occurs during major shutdown months when maintenance spend is high and production volume is low. Shutdown months are also tagged in the dashboard, enabling the facility to display the 12-month rolling trend alongside the individual monthly cost per tonne and understand which months represent shutdown concentration. This presentation gives management the accurate ongoing cost per tonne picture without the distortion of shutdown-month outliers masking the underlying cost performance trend.
iFactory's KPI dashboard has a dedicated executive reporting view that displays cost per tonne trends, benchmark position, and initiative ROI tracking without exposing the full CMMS work order detail that finance and leadership do not need. The executive view is accessible via browser with read-only credentials — shareable with corporate finance, operations directors, and executive leadership without licensing additional CMMS users. Monthly summary reports are also auto-generated as PDF exports on a configurable schedule, enabling the cost per tonne report to be distributed automatically to leadership without any manual report assembly.
For a U.S. steel facility producing 1 to 3 million tonnes annually, iFactory's cost analytics and KPI dashboard deployment runs $72,000 to $155,000 over 6 to 10 weeks, covering CMMS and MES data integration, cost per tonne baseline calculation, benchmark calibration, and dashboard configuration. Against the $3.80 to $7.20 per tonne reduction documented at comparable facilities, a 2-million-tonne plant achieves $7.6 to $14.4 million in annual maintenance cost savings — generating payback on total program investment within 2 to 4 months of first savings realization. Book a Demo to see a site-specific payback model for your facility.