Overall Equipment Effectiveness is the most comprehensive single metric available to steel plant operations management — and the most consistently misunderstood. Most U.S. steel facilities track OEE in some form, but the majority are tracking a simplified version that misses the nuance that makes OEE useful: the disaggregation of the number into its three component factors — Availability, Performance and Quality — each of which points to a different class of operational problem and a different category of improvement investment. A rolling mill with 82% OEE that is dragged down by a 91% Availability rate has a maintenance and reliability problem. The same 82% OEE driven by a 90% Performance rate has a scheduling and setpoint optimization problem. Driven by a 94% Quality rate, it has a process control and raw material management problem. The aggregate OEE number looks the same in all three cases. The management response required is completely different. iFactory's OEE dashboard and analytics platform delivers not just the aggregate OEE number but the real-time component breakdown — Availability, Performance, and Quality — by production unit, by shift, and by product grade, connected to the work order, condition monitoring, and process data that explains each component's losses and drives the specific improvement actions that compound into sustained OEE gain. Steel facilities deploying iFactory's OEE analytics platform achieve average OEE improvement of 8 to 14 percentage points within 12 months — from an industry median near 65% toward the world-class target of 85% — with the majority of improvement captured in the first 90 days from loss identification and focused intervention on the highest-OEE-impact equipment and production units.
OEE Fundamentals for Steel Manufacturing: Calculation, Components, and What World-Class Looks Like
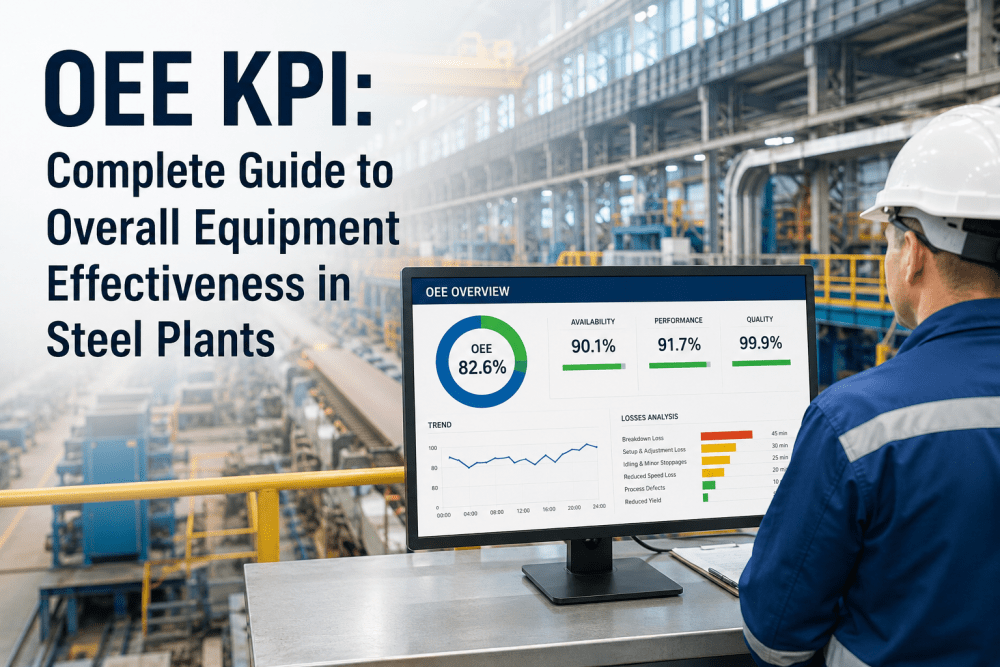
OEE is defined as Availability × Performance × Quality — the product of three factors, each expressed as a percentage, producing a composite metric that measures how effectively a production asset is being utilized relative to its theoretical maximum. The calculation is straightforward in concept; the challenge in steel manufacturing is applying it correctly to assets with complex operating profiles, scheduled production downtime, and quality rejection modes that differ fundamentally from discrete manufacturing.
In steel manufacturing, OEE calculation requires careful definition of the three components for each production unit. A blast furnace's planned production time excludes the campaign-end reline window but includes minor stops for tap hole maintenance and burden distribution adjustment — which are Availability losses, not planned downtime exclusions. A rolling mill's Performance rate is calculated against the design rolling speed for the current product grade — not the theoretical maximum speed, which produces misleadingly low Performance figures for specialty grades with lower design speeds. A caster's Quality rate must account for both prime yield and internally graded material that meets lower-specification orders — not just the scrap and reprocess weight. Getting these definitions right is the prerequisite for OEE numbers that drive improvement rather than create confusion. Book a Demo to see iFactory's OEE calculation framework configured for your specific production units.
- Including planned maintenance windows in planned production time — understates Availability
- Using theoretical maximum speed for Performance vs. grade-specific design speed
- Excluding minor stops under 5 minutes — the largest single source of steel mill Performance loss
- Including internally graded "prime B" material as Quality losses — overstates Quality loss
- Aggregating OEE across dissimilar assets — masks the individual unit where loss is concentrated
- Measuring OEE monthly rather than shift-by-shift — delays loss visibility by weeks
- Planned production time correctly excludes scheduled maintenance, relines, and planned changeovers
- Performance calculated against grade-specific ideal run rate from production schedule
- Minor stops captured from PLC pulse data — all stoppages regardless of duration recorded
- Quality losses defined as prime rejects and scrap only — ordered downgrade excluded
- OEE calculated per production unit, per product family, per shift, per crew
- Real-time OEE updated at every production hour — losses visible same shift they occur
The Six Big Losses in Steel Manufacturing: Where OEE Points in Each Production Unit
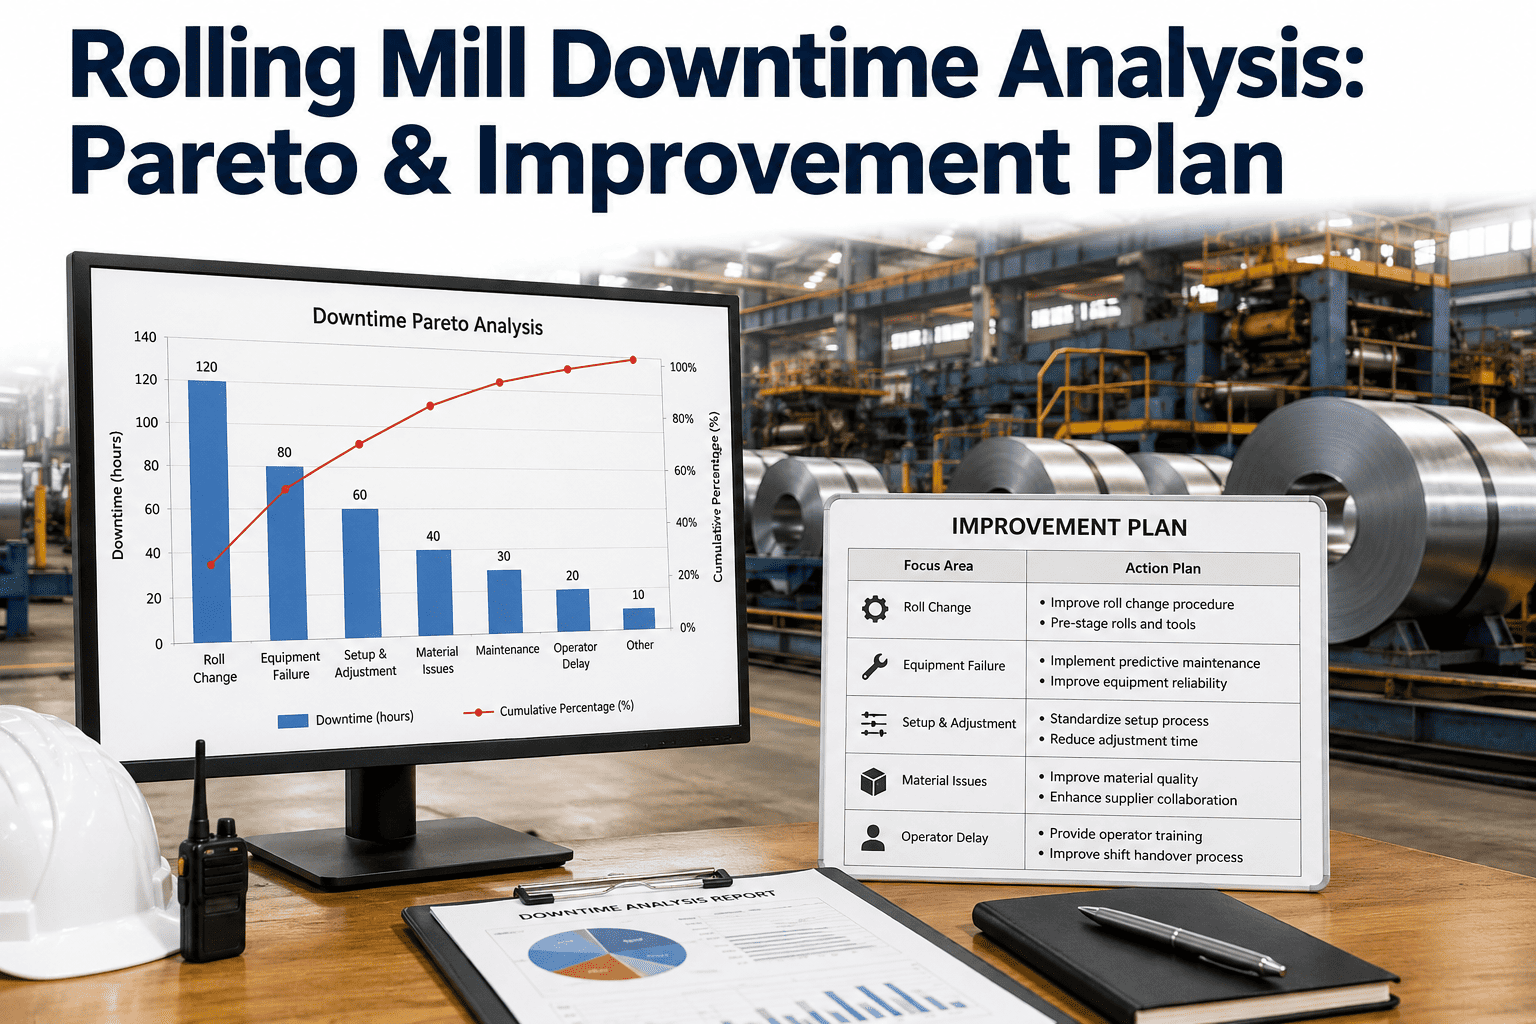
OEE improvement in steel manufacturing requires identifying which of the Six Big Losses is the dominant drag on each production unit's OEE — because the intervention that eliminates a breakdown loss is fundamentally different from the one that eliminates a speed loss or a startup quality loss. iFactory's OEE dashboard categorizes every production hour loss into the Six Big Losses framework automatically, producing the loss Pareto by production unit that directs improvement resources at the highest-OEE-impact categories.
OEE by Production Unit: Benchmarks and Loss Profiles Across Steel Plant Equipment Classes
OEE performance and loss profile differ significantly across steel plant production units — a blast furnace's OEE is dominated by Availability (campaign continuity) in a way that a cold rolling mill's is not, while a finishing line's OEE is most sensitive to Quality rate. Understanding the expected OEE range and dominant loss category for each production unit is the starting point for setting realistic improvement targets and directing resources at the highest-value improvement opportunities. Book a Demo to see iFactory's OEE benchmark dashboard compared against your specific production unit configuration and current performance data.
| Production Unit | Typical OEE Range | World-Class Target | Dominant Loss Category | Primary iFactory Capability | Typical OEE Improvement |
|---|---|---|---|---|---|
| Blast Furnace | 72–84% (campaign-dependent) | 90%+ on running campaign | Availability — tap hole maintenance, burden irregularities | Hearth condition monitoring, tap hole analytics, campaign remaining life | +6–9 points Availability |
| EAF / BOF Converter | 68–79% | 86%+ | Performance — heat time variability, power-off delays | Heat time tracking, power-off time analysis, vessel condition monitoring | +7–12 points Performance |
| Continuous Caster | 71–82% | 88%+ | Availability + Quality — breakouts, spray cooling defects | Breakout prediction, segment condition, spray cooling balance, slab quality tracking | +8–14 points combined |
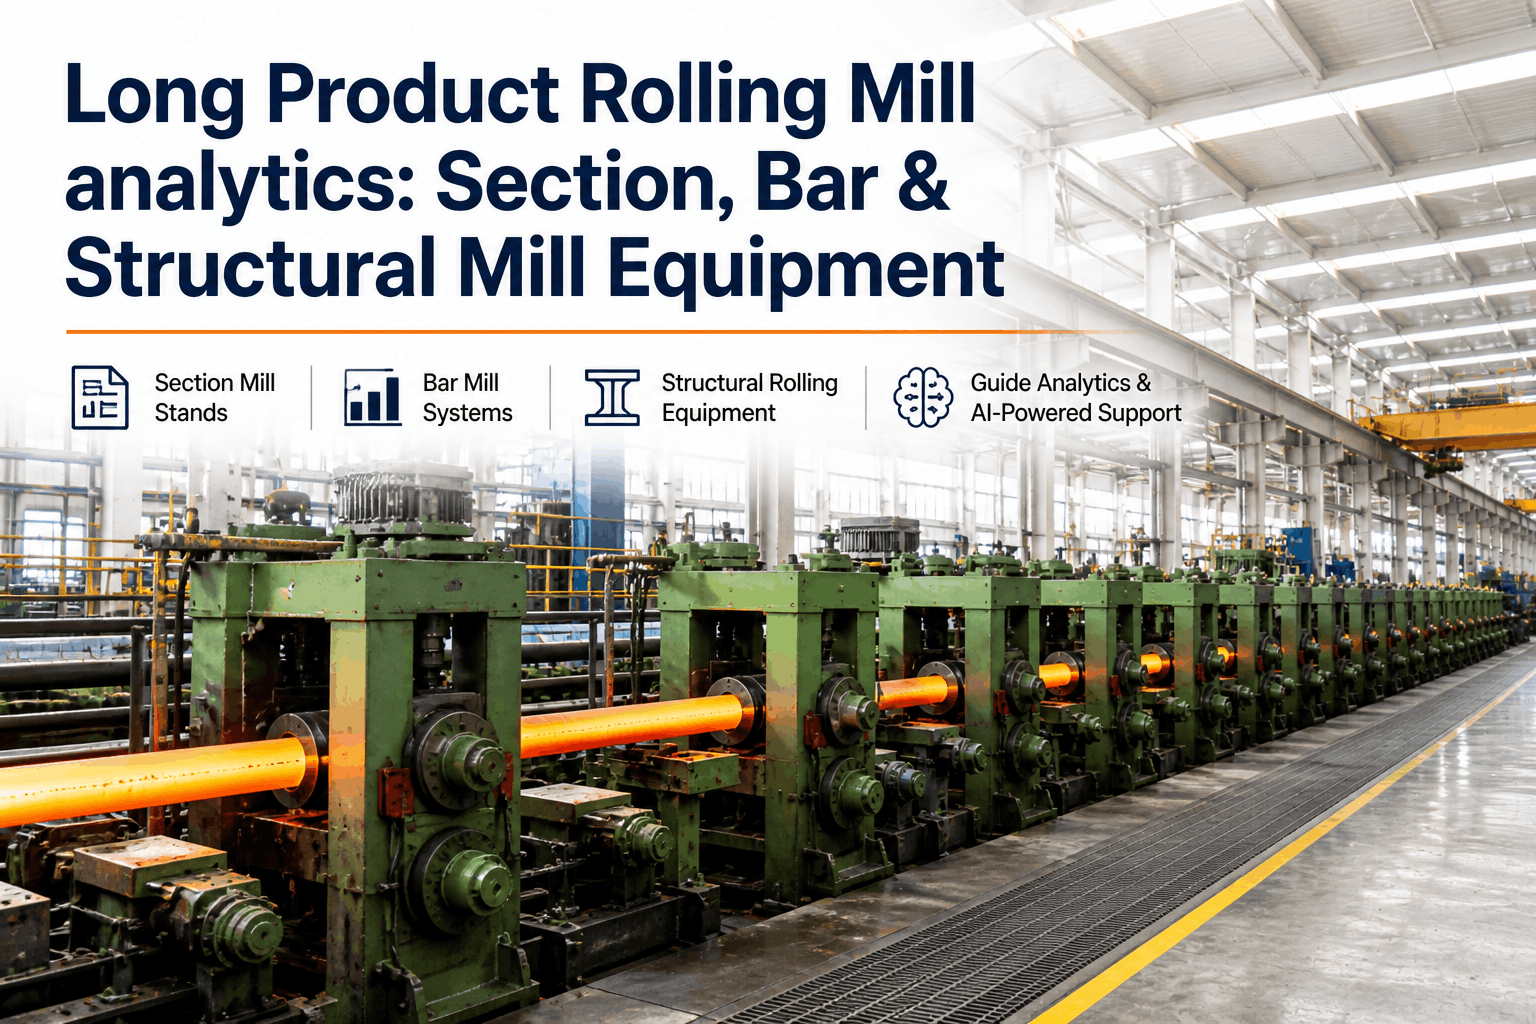
| Hot Rolling Mill | 68–78% | 85%+ | Performance — cobbles, speed reductions, minor stops | Cobble prediction, roll wear tracking, drive condition monitoring, speed loss attribution | +8–12 points Performance |
| Cold Rolling Mill | 65–76% | 83%+ | Performance + Availability — strip breaks, roll changes, AGC drift | Strip break prediction, roll change optimization, AGC condition tracking | +9–13 points |
| Finishing Line (Galvanizing / Coating) | 62–74% | 82%+ | Quality — coating weight variation, surface defects | Coating weight control analytics, surface inspection data integration, equipment-quality correlation | +10–14 points Quality |
How iFactory's OEE Dashboard Connects Loss Data to Improvement Actions
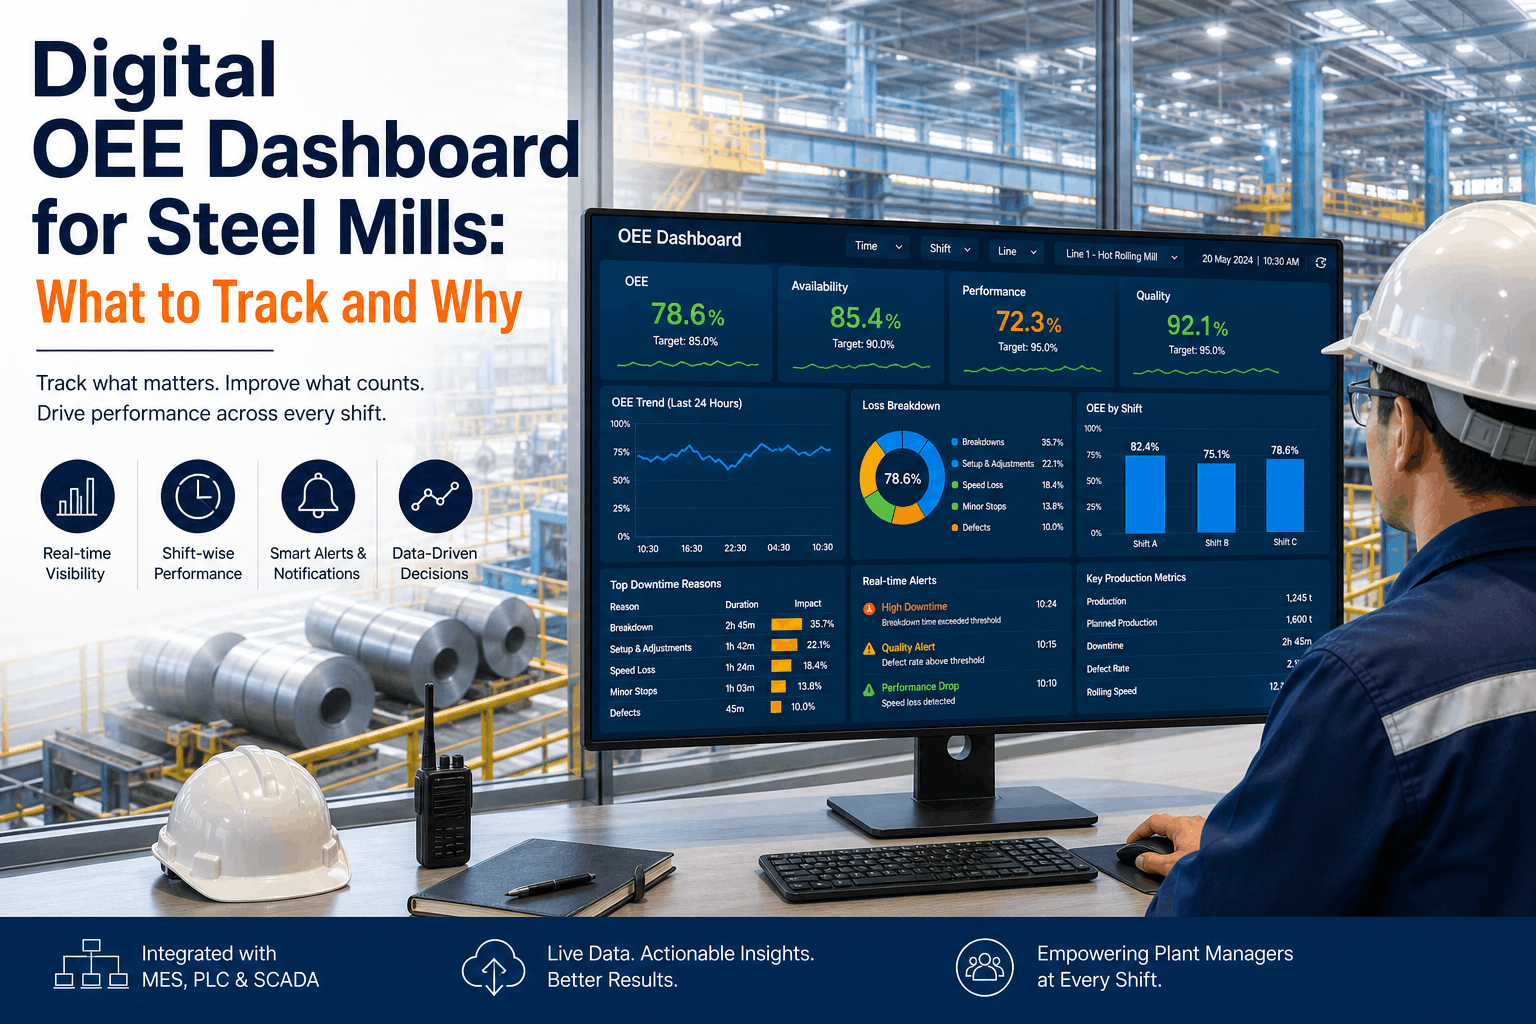
The OEE number itself is a diagnostic, not an answer — the value of the iFactory platform is not in calculating OEE but in connecting each OEE loss category to the specific equipment condition, process deviation, or scheduling decision that caused it. This connection is what converts OEE from a reporting metric into an improvement engine.
Expert Perspective: Why OEE Programs Fail in Steel — and What Top-Performing Facilities Do Differently
I have implemented OEE programs at eleven U.S. steel facilities over the past sixteen years — integrated mills, EAF mini mills, and cold rolling operations — and the failure pattern is remarkably consistent. The facility launches an OEE initiative, invests in a dashboard, and watches the number go from unknown to 64% in the first month. Leadership is energized. The number is visible. And then nothing happens to the OEE for six months, and the initiative quietly fades. The reason it fades is almost always the same: the OEE number was made visible, but the losses were not made actionable. Knowing that Availability is 89% tells a shift supervisor nothing about what to do differently. Knowing that Availability is 89% because 6.2% of planned production time was lost to unplanned breakdowns on the number 3 cooling water pump, that the pump generated three CMMS work orders in the last 45 days each coded to a different failure mode, and that the last condition monitoring route on that pump showed elevated bearing temperature — that tells the maintenance engineer exactly what conversation to have with the reliability team tomorrow morning. The OEE number is the alarm. The loss attribution is the diagnosis. The facilities that sustain OEE improvement are the ones that treat OEE as a diagnostic system rather than a reporting system — where every OEE event below target generates a specific question with a specific owner and a specific response deadline. iFactory builds that diagnostic connection automatically — every OEE loss is hyperlinked to the condition data, work order history, and process parameter record that explains it. That connection is what converts OEE from a KPI that gets discussed at monthly reviews into a management discipline that drives daily improvement actions."
Conclusion
OEE is the gold standard KPI in steel manufacturing for one reason: it is simultaneously a financial metric, a maintenance metric, a production metric, and a quality metric — compressing the operational complexity of a steel plant into a number that communicates across all management functions. The challenge is that the number is only as useful as the loss attribution system that explains it. An OEE number without attribution is a report. An OEE number with real-time loss attribution by production unit, shift, and loss category — connected to the maintenance, process, and scheduling data that explains each loss — is an improvement engine.
iFactory's OEE dashboard and analytics platform delivers the improvement engine: real-time OEE by unit, shift, and grade; Six Big Losses categorization by PLC fault code and process deviation; Availability loss linked to CMMS work orders and condition monitoring data; Performance loss attributed to equipment condition versus process condition versus operating practice; Quality loss correlated with concurrent equipment condition. The 8 to 14 percentage point OEE improvement documented at comparable steel plant deployments is the result of having that attribution system and acting on it — shift by shift, production unit by production unit — until the loss patterns that were invisible become the improvement targets that are systematically eliminated. Book a Demo to see iFactory's OEE dashboard built on your specific production unit configuration and shift data.
Frequently Asked Questions
World-class OEE in steel manufacturing is 85% — achieved by top-quartile U.S. facilities. The industry median is approximately 65%, meaning a typical facility has 20 percentage points of improvement potential. A realistic 12-month target is 8 to 14 percentage points of improvement from the starting baseline — moving a 65% facility to 73 to 79% in the first year and continuing toward 85% in years two and three. Facilities with well-defined loss categories and strong maintenance data integration reach the higher end of this range. Book a Demo for a site-specific OEE improvement projection.
Blast furnace OEE is calculated on a campaign-normalized basis — planned production time is the design campaign duration minus scheduled tap hole maintenance windows. Availability losses include unplanned stockline delays, tap hole equipment failures, and burden handling stoppages. Performance is calculated as actual hot metal production rate against the design production rate for the current burden mix and blast parameters. Quality is calculated as prime hot metal yield. iFactory pre-configures the blast furnace OEE calculation template to handle these differences from discrete manufacturing correctly at deployment.
iFactory's OEE dashboard requires three data streams: planned production schedule data from the MES or scheduling system (for Planned Production Time calculation), actual production output and downtime events from the MES or SCADA historian (for Availability and Performance calculation), and quality rejection and grading data from the quality management system or manual entry (for Quality rate). iFactory connects to all major MES platforms, PI/Wonderware historians, and PLC systems via standard OPC-UA or REST API, and to SAP production order data for facilities using SAP PP. Minor stop capture requires PLC cycle time data from the production line PLCs.
Prioritize by loss value, not loss percentage — the component with the lowest absolute OEE contribution is the improvement priority regardless of which percentage is lowest. Calculate each component's OEE point contribution: a 90% Availability × 88% Performance × 96% Quality facility gets more improvement from a 5-point Availability gain (to 95%) than a 5-point Quality gain (to 100%) because Availability multiplies all downstream components. iFactory's loss Pareto automatically ranks improvement opportunities by OEE point value, directing resources at the highest-leverage interventions first.
For a U.S. steel facility with 5 to 12 primary production units and existing MES and historian connectivity, iFactory's OEE dashboard deploys for $58,000 to $128,000 over 5 to 8 weeks. This covers MES and PLC data integration, OEE calculation template configuration per production unit, Six Big Losses categorization setup, CMMS linkage for Availability loss attribution, and shift management dashboards. Against $6.4M annual value recovered per 5-point OEE improvement at a 2M tonne mill, payback on the platform investment occurs within 2 to 4 weeks of the first loss-driven improvement action. Book a Demo for a site-specific deployment plan.