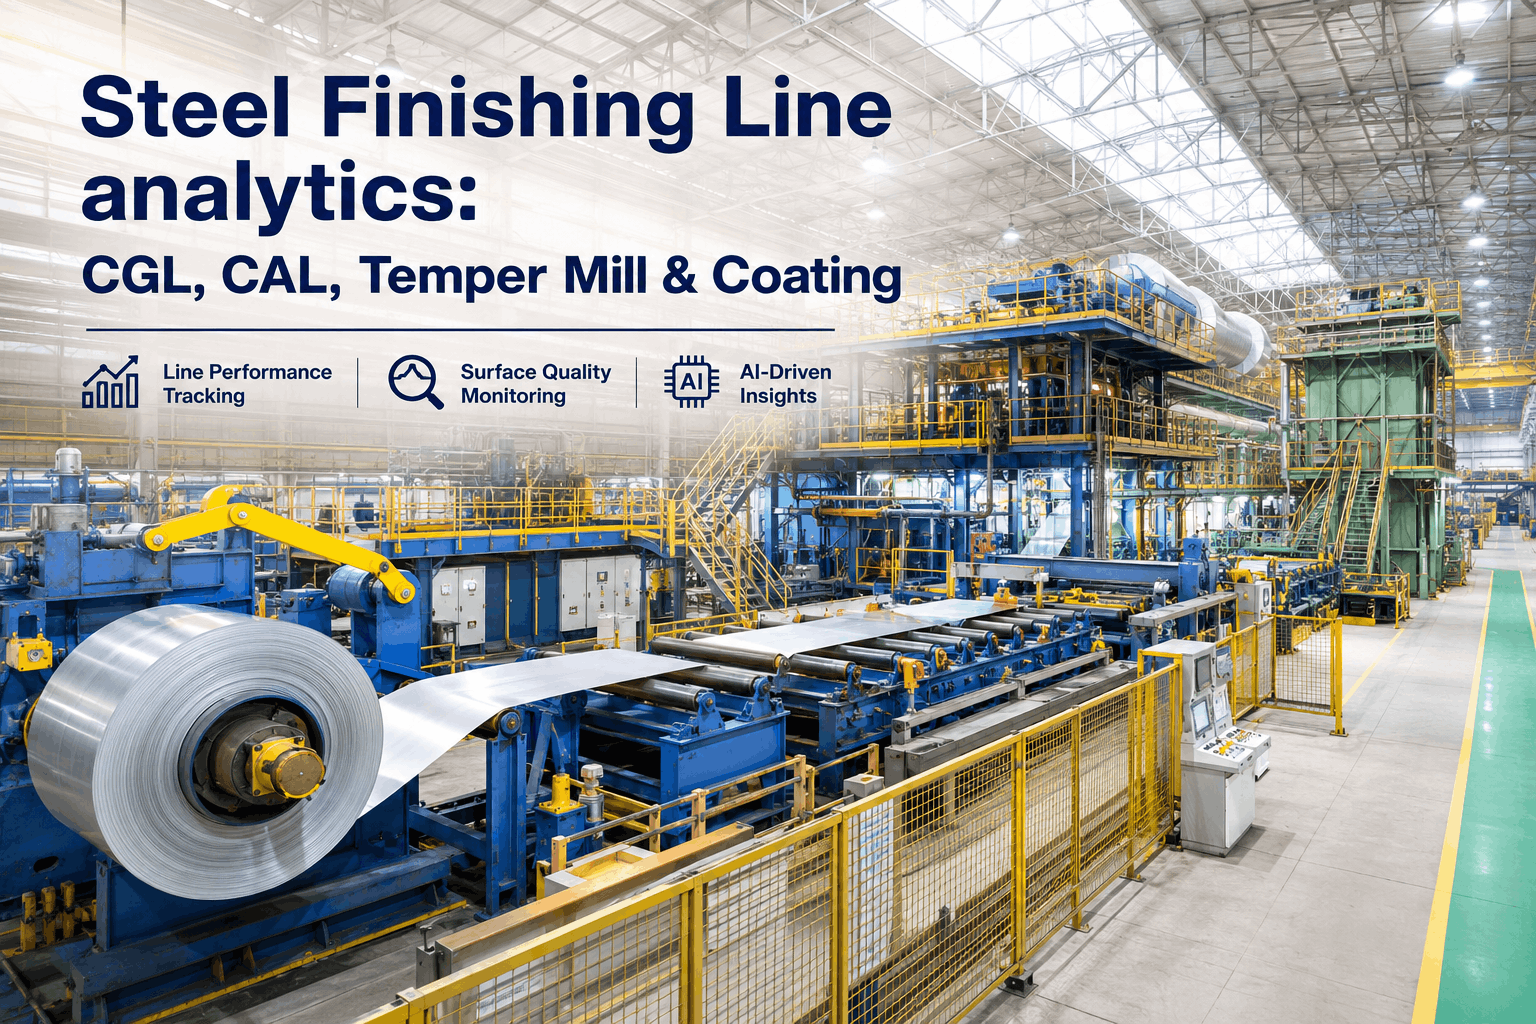
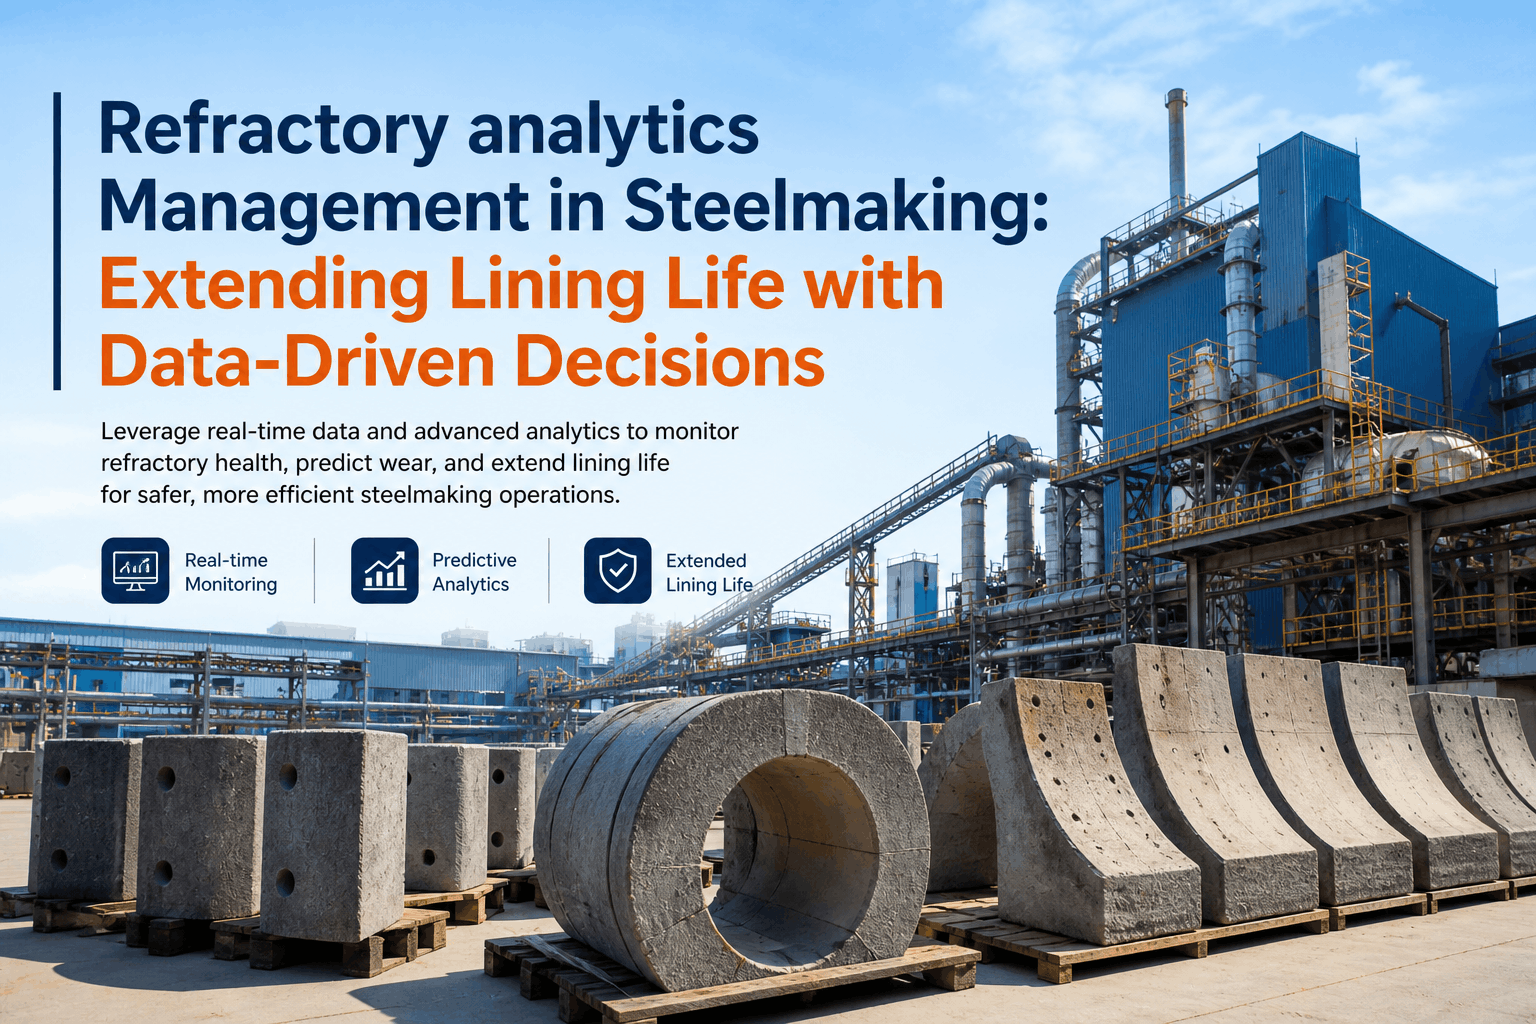
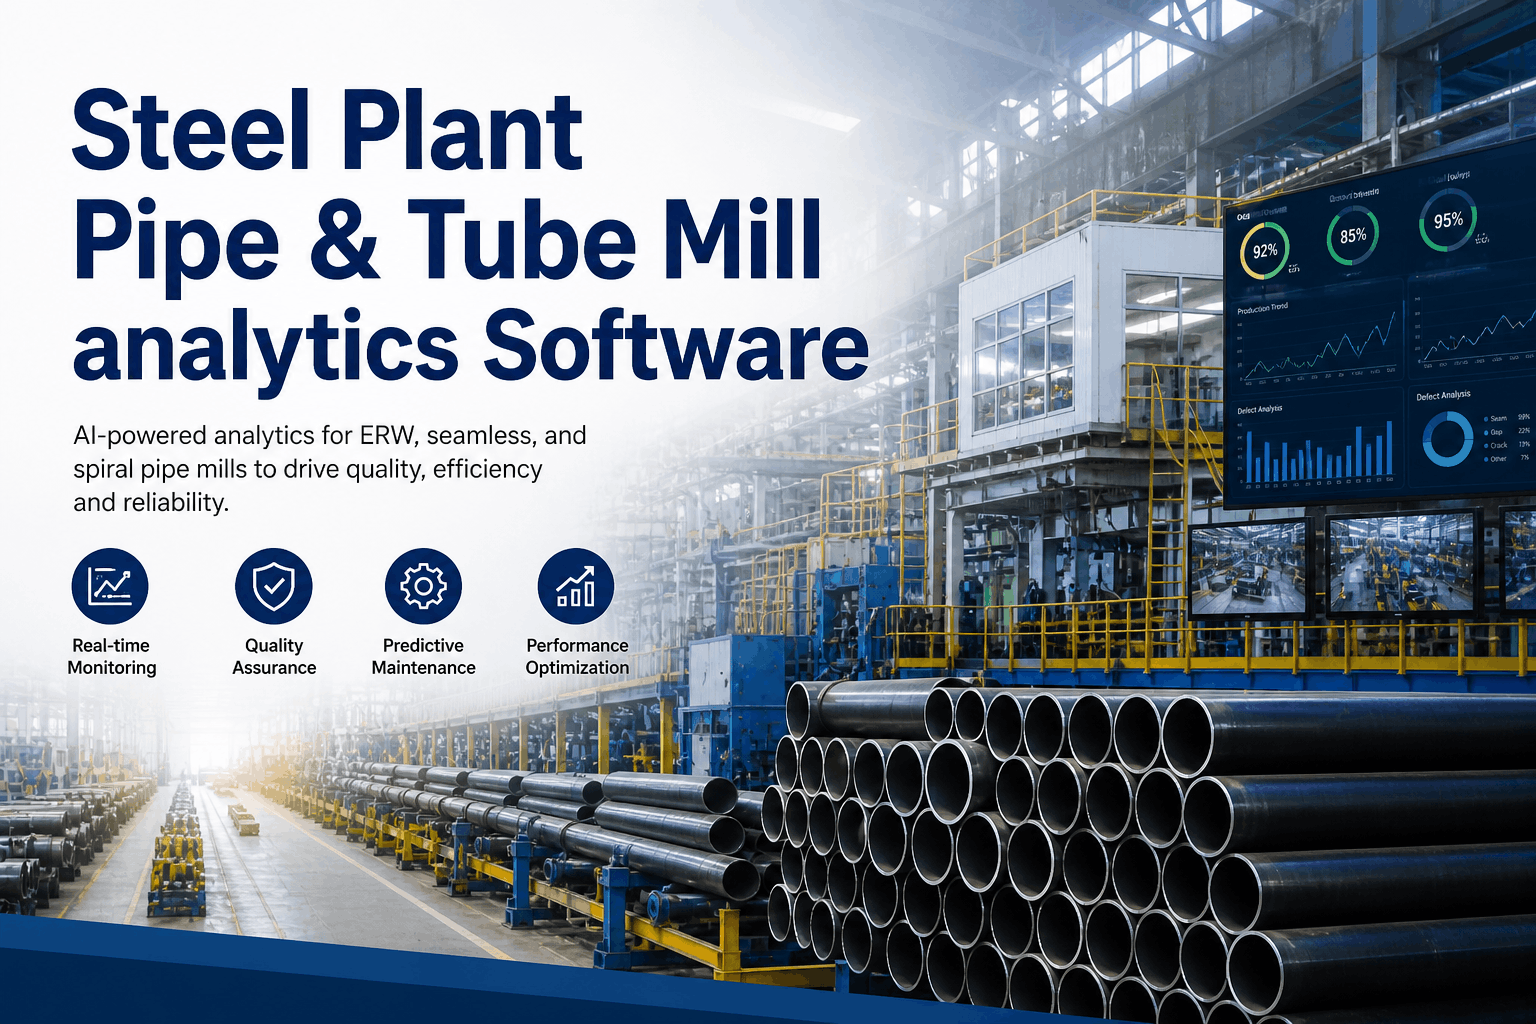
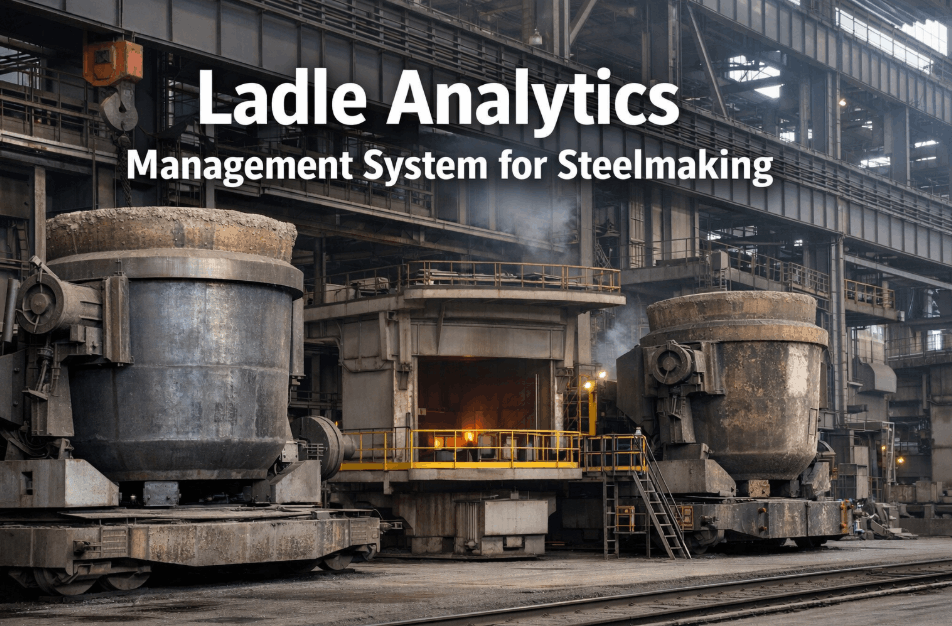
An integrated steel plant is not a single facility — it is a cascade of interdependent production systems, each with its own asset base, failure modes, process constraints, and performance drivers, all connected by material and energy flows that mean a problem at the raw material handling dock can compound into a quality failure at the finishing line six hours later. The blast furnace, hot metal handling, BOF or EAF steelmaking, continuous caster, hot rolling mill, cold rolling complex, and finishing lines that constitute a fully integrated operation represent 800 to 2,400 individual assets, 14 to 22 distinct production departments, and a maintenance and operations management challenge that no point-solution analytics platform — designed for one department or one asset class — can address at the scale that a single integrated facility actually requires. The consequence of fragmented analytics at integrated steel plants is visible in the performance gap between facilities that operate each department on independent maintenance and operations systems versus those that have deployed a unified analytics platform covering the full ironmaking-to-finished-product arc. Fragmented plants discover material flow disruptions hours after they originate, manage each department's maintenance budget independently without cross-department prioritization, and generate conflicting production and quality data across systems that cannot be reconciled for root cause analysis. Integrated analytics platforms prevent those consequences — and the performance differential between the two approaches at comparable U.S. integrated steel plants is 8 to 14 OEE percentage points, $6 to $18 million in annual avoidable production cost, and on-time delivery gaps of 12 to 24 percentage points. iFactory's enterprise analytics platform is the only solution in the market purpose-built for the full integrated steel plant architecture — covering every asset from ore storage through finished product shipping in one unified data model, one operator interface, and one AI analytics engine that sees across department boundaries and identifies the cross-system cause-and-effect chains that single-department platforms cannot detect. Facilities deploying iFactory's integrated steel plant platform achieve 9 to 15 percentage point OEE improvements across the full operation, reduce inter-department production delays by 34%, and build the operational data infrastructure that supports both capital planning and customer quality documentation requirements at enterprise scale.
Why Integrated Steel Plants Require Enterprise Analytics — Not a Stack of Department Solutions
The case for enterprise analytics at integrated steel plants is not primarily about feature coverage — it is about the physical reality of material and energy flow interdependency that makes department-isolated analytics systems structurally incapable of capturing the most consequential causes of production loss. When a blast furnace hearth temperature anomaly produces hot metal with a higher-than-specification silicon content, the BOF operator has 20 to 35 minutes to adjust the charge calculation before the heat produces a chemistry deviation that generates a caster quality hold that delays the rolling mill that backs up the downstream coil yard that forces the finishing line into a schedule change that affects on-time delivery to three customers. A platform that monitors the blast furnace independently and the BOF independently and the caster independently cannot see that chain. A unified platform with a shared data model and cross-department AI inference engine sees it in real time — and surfaces the BOF chemistry adjustment recommendation before the cascade begins.
The financial arithmetic of this cross-department visibility is straightforward. A single prevented quality cascade event at a U.S. integrated flat-rolled facility — the kind that starts with a raw material deviation and propagates through steelmaking and casting into a rolling mill cobble — is worth $180,000 to $420,000 in avoided production loss, quality reprocess cost, and expedited logistics. At a facility experiencing four to six such events per year from inadequate cross-department visibility, the financial case for unified enterprise analytics closes within the first 90 days of deployment. Book a Demo to see iFactory's integrated steel plant platform configured for your specific production unit architecture.
The Integrated Steel Plant Analytics Coverage Map: Every Department, Every Asset Class
iFactory's enterprise platform is structured around the full integrated steel plant production sequence — each department mapped to its specific analytics requirements, asset criticality profile, and cross-department interaction points. The coverage architecture below shows the analytics capabilities deployed at each production stage and the cross-department data flows that enable the enterprise-level intelligence that single-department platforms cannot provide.
Enterprise Performance Benchmark: Integrated Analytics Platform vs. Fragmented Department Systems
The performance gap between integrated and fragmented analytics architectures at U.S. integrated steel plants is measurable across seven operational dimensions. The benchmark data below reflects documented outcomes at comparable U.S. integrated flat-rolled and long-product facilities — showing both the starting state for facilities with department-isolated systems and the post-deployment state after iFactory's enterprise platform unified the analytics architecture across the full production cascade. Book a Demo to see your facility's current performance mapped against these benchmarks.
| Performance Dimension | Fragmented Department Systems | iFactory Integrated Platform | Gap Closed | Annual Value at 2M Tonne Facility |
|---|---|---|---|---|
| Cross-Department OEE | 62–68% — each department optimized independently, cascade losses invisible | 73–82% — enterprise OEE with cross-department loss attribution | +8–14 OEE pts | $8–$18M production value recovery |
| Inter-Department Delays | 4.2 hrs average delay per cross-department event — discovered after impact | 1.4 hrs average delay — material flow deviation detected before cascade begins | –34% delay time | $3.2–$6.8M avoidable production loss |
| Quality Cascade Events | 5–8 per year — raw material deviation undetected until downstream rejection | 1–2 per year — upstream deviation alerts prevent 75% of downstream quality events | –75% quality cascades | $1.8–$4.2M quality cost reduction |
| Maintenance Cost Coordination | Each department manages PM independently — upstream maintenance during downstream campaigns | Unified maintenance calendar — all PM aligned to production flow and bottleneck windows | –22% avoidable production impact from maintenance | $1.4–$3.2M maintenance-driven production loss avoided |
| On-Time Delivery | 71–78% OTD — downstream delays from upstream deviations not detected in time to adjust | 89–94% OTD — enterprise visibility enables proactive customer communication and rescheduling | +12–22 OTD pts | Retention of premium-grade, high-specification customers |
| Energy Cost Per Tonne | No cross-department energy optimization — each unit manages energy independently | Integrated energy analytics: reheat furnace, EAF, and finishing line optimization in one view | –8–14% energy cost per tonne | $2.4–$5.6M energy cost reduction annually |
| Capital Planning Accuracy | Department-level replacement plans not coordinated — duplicated contractor mobilization costs | Enterprise capital planning — coordinated shutdown campaigns minimize mobilization and lost production | –18% capital execution cost | $800K–$2.2M capital efficiency improvement per cycle |
Enterprise Deployment Architecture: How iFactory Unifies an Integrated Plant's Existing Systems
The practical concern for integrated steel plant IT and operations leadership considering enterprise analytics is not whether the platform covers all departments — it is whether the platform can actually connect to the heterogeneous system landscape that most integrated plants have accumulated across 20 to 35 years of automation investment: multiple MES generations, multiple PLC vendors and vintages, multiple process historian instances, SAP ECC or S/4HANA for maintenance and finance, and department-specific quality systems that have never shared a data model. iFactory's enterprise integration architecture is specifically designed for this reality.
Expert Review: What Integrated Steel Plant Leaders Say About Enterprise vs. Department Analytics
I spent seven years at a facility where we had the best-in-class analytics solution for the hot mill, a different best-in-class solution for the caster, a third system for the EAF, and two more for the finishing complex. Every department head was proud of their system and the performance improvements they had documented within their area. What nobody could see — and what cost us between $8 million and $12 million per year in avoidable production loss — was what was happening between departments. The hot mill team did not know that the caster had just produced a heat with internal quality concerns until the coils arrived at the pickling line six hours later. The BOF team did not know that the blast furnace silicon was running high until the secondary metallurgy station was already fighting the chemistry. Every event was discovered after it had already cascaded. When we finally deployed a unified enterprise platform that shared a single data model across the full production sequence, the first thing that changed was not a technology outcome — it was a behavioral outcome. Department heads stopped defending their own system's data and started having conversations about what the upstream event meant for their department's plan for the next four hours. The cross-department visibility created a shared operational reality that five separate analytics systems could never produce. The financial outcome followed directly: inter-department production delays fell by 40% in the first 12 months, quality cascade events dropped from seven per year to one, and the annual production value recovery was documented at $11.4 million against a total platform investment of $680,000. The ROI case was closed before the end of the first quarter. What I would tell any integrated steel plant leader who is still managing departments on separate analytics systems is that the cost of that fragmentation is not visible in any one department's KPIs — but it is visible in the plant's total throughput, on-time delivery performance, and quality cost numbers. Enterprise analytics does not replace department expertise. It gives department expertise a shared foundation to work from.
— Vice President of Operations, U.S. Integrated Flat-Rolled Steel Producer — 3.2 Million Tonne Annual Capacity — 24 Years in Steel Manufacturing — iFactory Enterprise Reference 2026Conclusion
Integrated steel plant operations cannot be managed to world-class performance from a set of department-isolated analytics platforms that share no data model and surface no cross-department intelligence. The performance gap between integrated analytics architecture and fragmented department systems is 8 to 14 OEE percentage points, 34% in inter-department production delays, 75% in quality cascade events, and 12 to 22 points of on-time delivery performance — all from the same assets, the same workforce, and the same production equipment, differing only in whether the analytics platform can see across department boundaries or is limited to the silo it was deployed for.
iFactory's enterprise analytics platform covers the full integrated steel plant production sequence — from raw material handling and ironmaking through steelmaking, casting, hot and cold rolling, to finishing and shipping — in one unified data model, one operator interface, and one AI analytics engine that identifies and surfaces the cross-department cause-and-effect chains that determine whether production losses are prevented or discovered after the cascade has already occurred. The 9 to 15 percentage point OEE improvement and $6 to $18 million annual production value recovery documented at comparable integrated facilities are the outcomes of having enterprise visibility, not department visibility. Book a Demo to see iFactory's integrated steel plant platform configured for your specific production unit architecture and system landscape.
Frequently Asked Questions
Yes — iFactory aggregates simultaneously from PI AF, Wonderware, iFix, and Proficy Historian instances across departments without data migration. Each department historian connects to the unified enterprise data lake, presenting a cross-department time-series analytics view without requiring historian consolidation or system replacement.
iFactory links the material identifier (heat number, slab ID, coil ID) across every production stage in the unified data model — so a finishing line surface defect detection event can be traced backward through the hot mill pass, the caster segment conditions, and the steelmaking chemistry of the original heat. Root cause attribution is automatic, not manual.
Yes — iFactory's group analytics layer aggregates OEE, maintenance cost, quality, and energy performance across multiple facilities in one executive dashboard. Site-to-site performance benchmarking, best-practice identification across the group, and coordinated capital planning across facilities are all supported from the same enterprise platform architecture.
iFactory's phased deployment delivers OEE dashboards for critical-path assets (BF, caster, hot mill bottleneck) within 2 to 4 weeks. Full enterprise coverage across all departments completes in 8 to 14 weeks depending on the system landscape complexity. Each phase delivers measurable results before the next begins — no 12-month wait for first value.
For a fully integrated plant with 5 to 8 major production departments, 1,000 to 2,000 assets, and existing MES and historian connectivity, iFactory's enterprise deployment runs $220,000 to $580,000 over 8 to 14 weeks. Against $6 to $18 million in documented annual value at comparable facilities, investment payback occurs within 2 to 5 months of the first cross-department improvement action. Book a Demo for a site-specific projection.