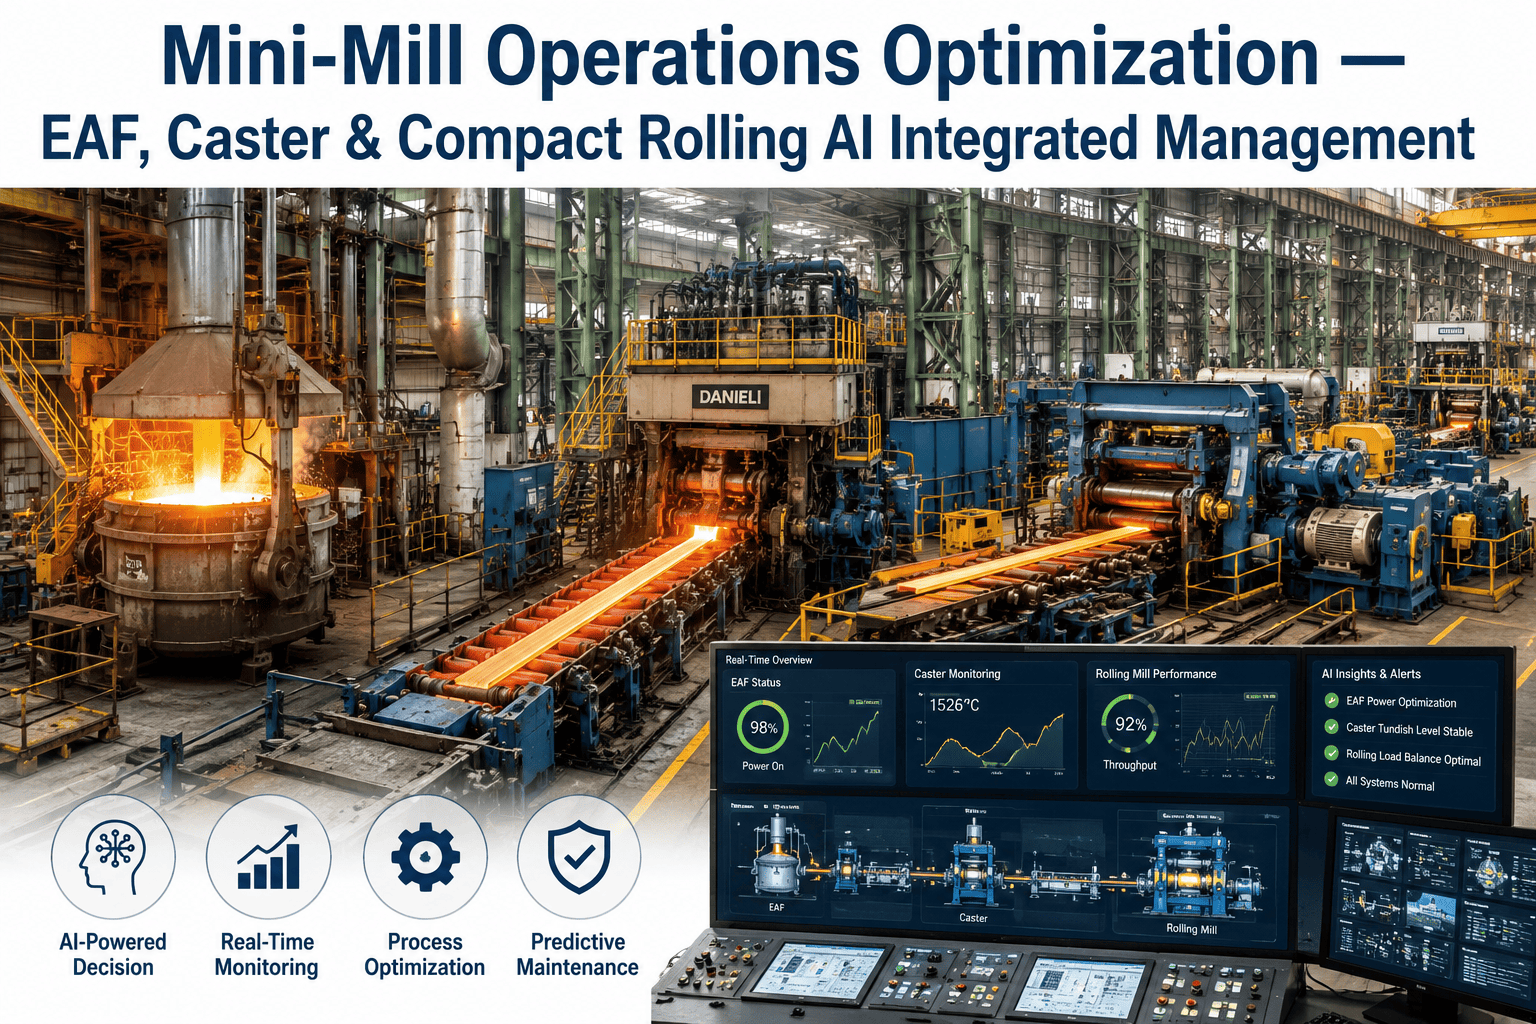
EAF-based mini mills operate in a fundamentally different environment than integrated steelmakers — leaner crews, faster heat cycles, tighter capital budgets, and a cost structure where every hour of electric furnace downtime translates directly to lost margin at a rate that integrated mills rarely experience. The analytics challenge in a mini mill is not a lack of data: modern EAF control systems, continuous casters and rolling mill drives generate enormous volumes of operational data every shift. The challenge is that most mini mills are running that data through maintenance logbooks, shift supervisor memory, and monthly production reports rather than through a real-time analytics platform that can turn the data into decisions before the next heat is tapped. The result is a predictable performance gap. U.S. EAF mini mills running without structured analytics operate at 61 to 68% OEE on average across their furnace caster and rolling units. Mini mills with analytics-driven maintenance and production management programs operate at 76 to 84% OEE on the same equipment. That gap — 12 to 18 OEE points — at a mini mill producing 400,000 to 800,000 tonnes annually represents $4 to $9 million in recoverable annual production value from equipment already owned and operated. iFactory's AI-driven analytics platform is purpose-built for the mini mill operating environment: rapid deployment on existing EAF control systems and historian infrastructure, mobile-first access for lean maintenance crews, and a loss attribution engine that tells shift supervisors exactly where the heat time, caster availability, and rolling mill performance losses are occurring — shift by shift, heat by heat — before they compound into production shortfalls that cannot be recovered.
Why Mini Mills Need Analytics Built for Their Operating Model — Not Adapted from Integrated Mill Platforms
The analytics platforms built for integrated blast furnace and BOF steelmakers are engineered for large capital maintenance teams, centralized IT infrastructure, and production planning horizons measured in weeks. Mini mills operate on different premises: small maintenance crews covering multiple production units, scrap-based raw material variability that changes heat-to-heat, rolling schedules that can shift within the same shift, and a capital discipline that requires any technology investment to demonstrate ROI within months, not years. Analytics platforms adapted from integrated mill architecture fail mini mills on each of these dimensions — they require IT implementation resources the mill does not have, produce reports that reach the maintenance team two days after the shift that generated the data, and cost at implementation and annual license levels calibrated to integrated mill budgets. iFactory's EAF mini mill analytics platform is built from the operating reality of the mini mill, not adapted from somewhere else. Mobile access for maintenance technicians means a single crew member covering the furnace, caster, and rolling mill simultaneously receives real-time alerts and equipment condition dashboards on their phone without returning to a control room. Rapid deployment means live heat analytics are running on existing EAF SCADA and historian connections within two to four weeks, not six months of IT integration work. And the OEE financial model is calibrated to mini mill production rates, cost structures, and the specific loss categories — heat time extension, electrode consumption, breakout risk, cobble frequency — that drive mini mill production costs.
EAF Mini Mill Analytics by Production Unit: Where the Losses Are and What Drives Them
Mini mill production losses follow predictable patterns that differ significantly from integrated mill loss profiles — and analytics programs that do not account for these differences misallocate improvement effort. The EAF heat cycle, continuous caster, and downstream rolling and finishing units each have characteristic loss categories in the mini mill environment, driven by scrap variability, lean crew coverage, and the faster production tempo that characterizes secondary steelmaking. The production unit analytics map below identifies the dominant loss category, the analytics intervention that addresses it, and the typical OEE improvement available at comparable mini mill facilities. Book a Demo to see iFactory's mini mill analytics deployment mapped to your specific production unit configuration.
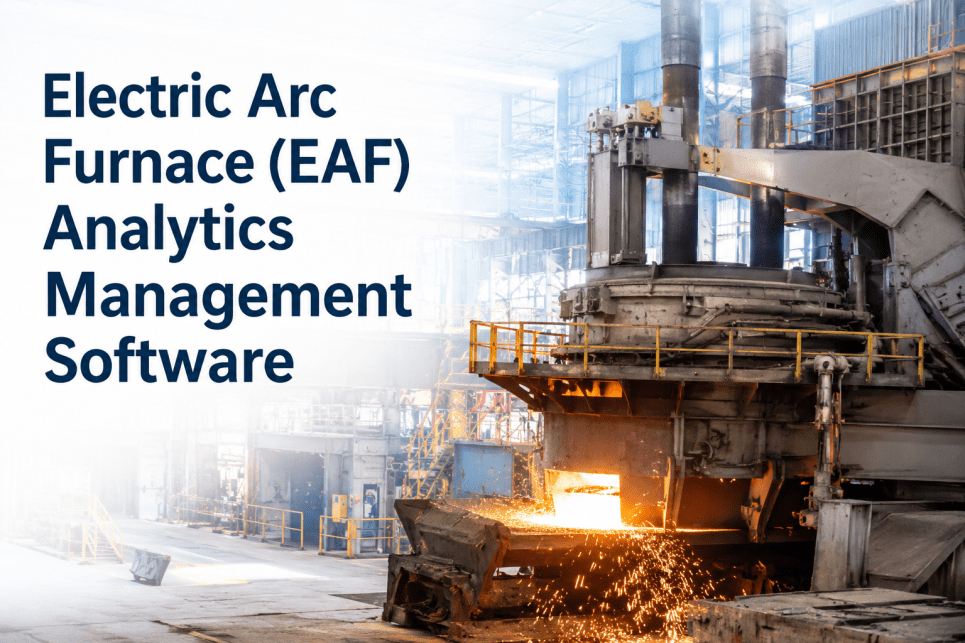
The EAF heat cycle is the primary value driver and the primary loss source in mini mill operations. Heat time variability — the difference between the best-practice heat duration and the actual average heat duration per shift — is the largest Performance loss in most mini mills and the one that most directly drives energy cost per tonne, electrode consumption, and furnace lining wear rate. iFactory's heat analytics platform tracks every heat cycle parameter against the facility's own best-practice baseline, identifies the specific causes of heat time extension on a heat-by-heat basis, and generates the predictive alerts that allow maintenance crews to address electrode condition, transformer status, and cooling circuit performance before they extend the next heat. At a mini mill running 18 heats per day, recovering 4 minutes per heat from heat time analytics represents 72 minutes of additional capacity per day — equivalent to 3 to 4 additional heats per week at current production rates.
Caster availability in mini mills is disproportionately affected by breakout events and tundish changeover management — both of which are addressable through analytics that most mini mills are not yet deploying. A single breakout event stops caster production for 4 to 8 hours, generates significant refractory damage, and produces quality losses in upstream and downstream production that cascade across multiple shifts. iFactory's mold thermocouple analytics monitors temperature differential patterns that precede breakout events, generating early warnings that allow casting speed reduction or corrective intervention before the event occurs. Simultaneously, tundish changeover time tracking identifies crew-specific best practice and the transitions consistently running above it — a 12-minute tundish changeover that runs 19 minutes on one shift and 13 minutes on another is a data problem that analytics solves before it becomes a production loss pattern.
Rolling mill Performance loss in mini mills is dominated by cobble frequency and the conservative speed reductions that operators impose when roll, guide, or drive condition degrades — a rational response to equipment uncertainty that becomes unnecessary when condition monitoring data provides actual equipment status rather than operator judgment. iFactory's rolling mill analytics connects drive current signature monitoring to cobble prediction, giving operators advance warning of the equipment condition that precedes cobble events and enabling the maintenance intervention that prevents them rather than the speed reduction that avoids them. Roll wear trending tracks every roll campaign against the facility's documented wear curves, predicting the remaining useful life per roll and scheduling changes before wear reaches the point where surface quality begins to deteriorate — eliminating both cobble risk from worn rolls and the quality losses that precede the cobble event.
Finishing line Quality loss is the most financially damaging loss category in mini mill operations because it generates scrap and downgrade material at the point of maximum production cost — after the energy, electrode, roll, and labor costs of furnace, casting, and rolling have already been incurred. iFactory's finishing line analytics correlates dimensional variation and surface defect occurrence with upstream process parameters — casting temperature, rolling pass schedule, cooling rates — identifying the root cause of quality losses in the process step that generated them rather than the finishing step that detected them. This upstream attribution is the difference between quality inspection that records defects and quality analytics that prevents them.
Mini Mill Analytics Implementation: From Existing Infrastructure to Live Dashboards in 4 Weeks
The implementation barrier that most mini mills cite when deferring analytics investment is IT resource availability — the concern that deploying a meaningful analytics platform requires months of integration work that a lean operation cannot support alongside production demands. iFactory's mini mill deployment model is engineered around this constraint: it is built to connect to the data infrastructure the mill already operates, deploy in phases that deliver usable results before the full implementation completes, and require zero dedicated IT resource from the mill's own team for standard connectivity configurations. The implementation workflow below shows the 4-week standard deployment path for an EAF mini mill with existing SCADA historian and MES infrastructure.
Mini Mill Analytics Performance Benchmark: U.S. EAF Operations Without and With iFactory
The performance differential between mini mills operating without analytics and those with structured analytics-driven programs is documented across comparable U.S. facilities. The benchmark comparison below maps key operational metrics across both operating models — using facility data from comparable 400,000 to 700,000 tonne annual production EAF operations. Book a Demo to see iFactory's performance benchmark built on your facility's production data.
| Operational Metric | Without Analytics (Industry Median) | With iFactory Analytics | Annual Value Difference |
|---|---|---|---|
| Overall OEE | 61–68% | 76–84% | $4–9M recovered production value |
| EAF Heat Time Variability | ±18–24 min vs. best practice | ±6–9 min vs. best practice | 3–5 additional heats per week |
| Unplanned Downtime Rate | 12–18% of scheduled production time | 4–7% of scheduled production time | $1.2–3.1M avoided breakdown cost |
| Breakout Frequency (Caster) | 1.8–3.2 events per month | 0.4–0.9 events per month | $480K–$1.1M avoided event cost |
| Cobble Frequency (Rolling) | 2.4–4.1 events per week | 0.6–1.3 events per week | $320K–$780K avoided cobble cost |
| Quality Loss Rate (Scrap + Downgrade) | 4.8–7.2% of production tonnes | 1.9–3.1% of production tonnes | $680K–$1.8M in recovered prime yield |
| Maintenance Labour Efficiency | Reactive response, 70–80% reactive | Predictive dispatch, 40–55% reactive | 22–31% maintenance cost reduction |
| Electrode Consumption per Tonne | Baseline — no heat-specific tracking | 4–8% reduction from heat time optimization | $180K–$420K annual electrode savings |
Mobile-First Analytics for Lean Mini Mill Crews: Real-Time Access Where the Equipment Is
The workforce model in a mini mill is fundamentally different from an integrated mill: a single maintenance technician routinely covers multiple production units simultaneously, a shift supervisor manages furnace, caster, and rolling mill within one shift, and the crew size that would staff a single department in an integrated mill covers the entire production operation in a mini mill. Analytics platforms that deliver their value through desktop dashboards in a central control room are structurally misaligned with this operating model. If the maintenance technician covering the EAF and caster simultaneously needs to walk to the control room to check equipment condition data, the analytics platform is not providing real-time value — it is providing delayed information at the cost of attention redirected from the equipment itself. iFactory's mobile-first architecture is built for the mini mill crew model: every dashboard, alert, and work order available on any device, with alert prioritization that delivers the right information to the right person before the equipment condition deteriorates into a production loss event.
Expert Perspective: What Mini Mill Operations Leaders Say About Analytics in the EAF Environment
We run a 600,000-tonne EAF operation with a maintenance team that would not staff the blast furnace department of an integrated mill. For years, our analytics capability was our shift supervisor's experience and a downtime log that someone filled in manually at the end of each shift. We knew our OEE was poor — we just did not know precisely where it was poor, which meant every maintenance priority decision was based on whoever was loudest in the morning meeting rather than which loss was costing us the most money. The first thing iFactory's platform showed us was that our single largest loss — larger than all our unplanned breakdowns combined — was heat time extension on the EAF. We knew heats were running long sometimes. We did not know that the average heat was running 11 minutes over our own best practice, that this was costing us 4 heats per week of production capacity, and that 70% of the extension was attributable to three specific causes that all had maintenance solutions. We fixed those three causes. Heat time came down. And the financial impact — which iFactory calculated for us per heat and per week — was visible to the plant manager and to the finance team in terms they understood. That was the shift: from maintenance decisions made on intuition to maintenance decisions made on documented financial return. For a lean mini mill operation where every dollar of maintenance spend is scrutinized, having that documentation is not a nice-to-have. It is the only way to justify the investments that actually move OEE. The mobile access was the other piece — our maintenance crew covers three production units and they cannot be in the control room. Having condition alerts on their phones meant we caught two caster issues and a rolling mill drive bearing problem before they became unplanned stops. That is probably $800,000 in avoided downtime in the first year from mobile alerts alone."
Conclusion
Analytics management for EAF mini mills is not a technology initiative — it is an operational discipline that determines whether a lean secondary steelmaking operation can compete on production cost against larger, better-resourced integrated producers. The 12 to 18 OEE point gap between mini mills operating without structured analytics and those with analytics-driven programs represents the most significant controllable cost and production variable available to mini mill management. The heat time variability that inflates energy and electrode cost per tonne, the breakout events that stop caster production for multiple shifts, the rolling mill cobbles that compound downstream quality losses — these are not random events. They are predictable outcomes of equipment conditions that analytics can identify before they produce production losses, and they are addressable through maintenance and process interventions that analytics programs make it possible to prioritize, document, and defend to plant leadership.
iFactory's EAF mini mill analytics platform is purpose-built for the operating reality of secondary steelmaking: rapid deployment on existing infrastructure, mobile-first access for lean maintenance crews, heat-level OEE analytics calibrated to the EAF production cycle, and financial ROI documentation that justifies every improvement action in terms that plant management and finance teams understand. The 8 to 14 OEE point improvement and $4 to $9 million in annual production value recovery at comparable mini mill facilities are the documented outcomes of treating analytics not as a reporting upgrade but as the operational capability that makes lean mini mill operations genuinely competitive. Book a Demo to see iFactory's mini mill analytics deployment built on your facility's existing data infrastructure and production configuration.