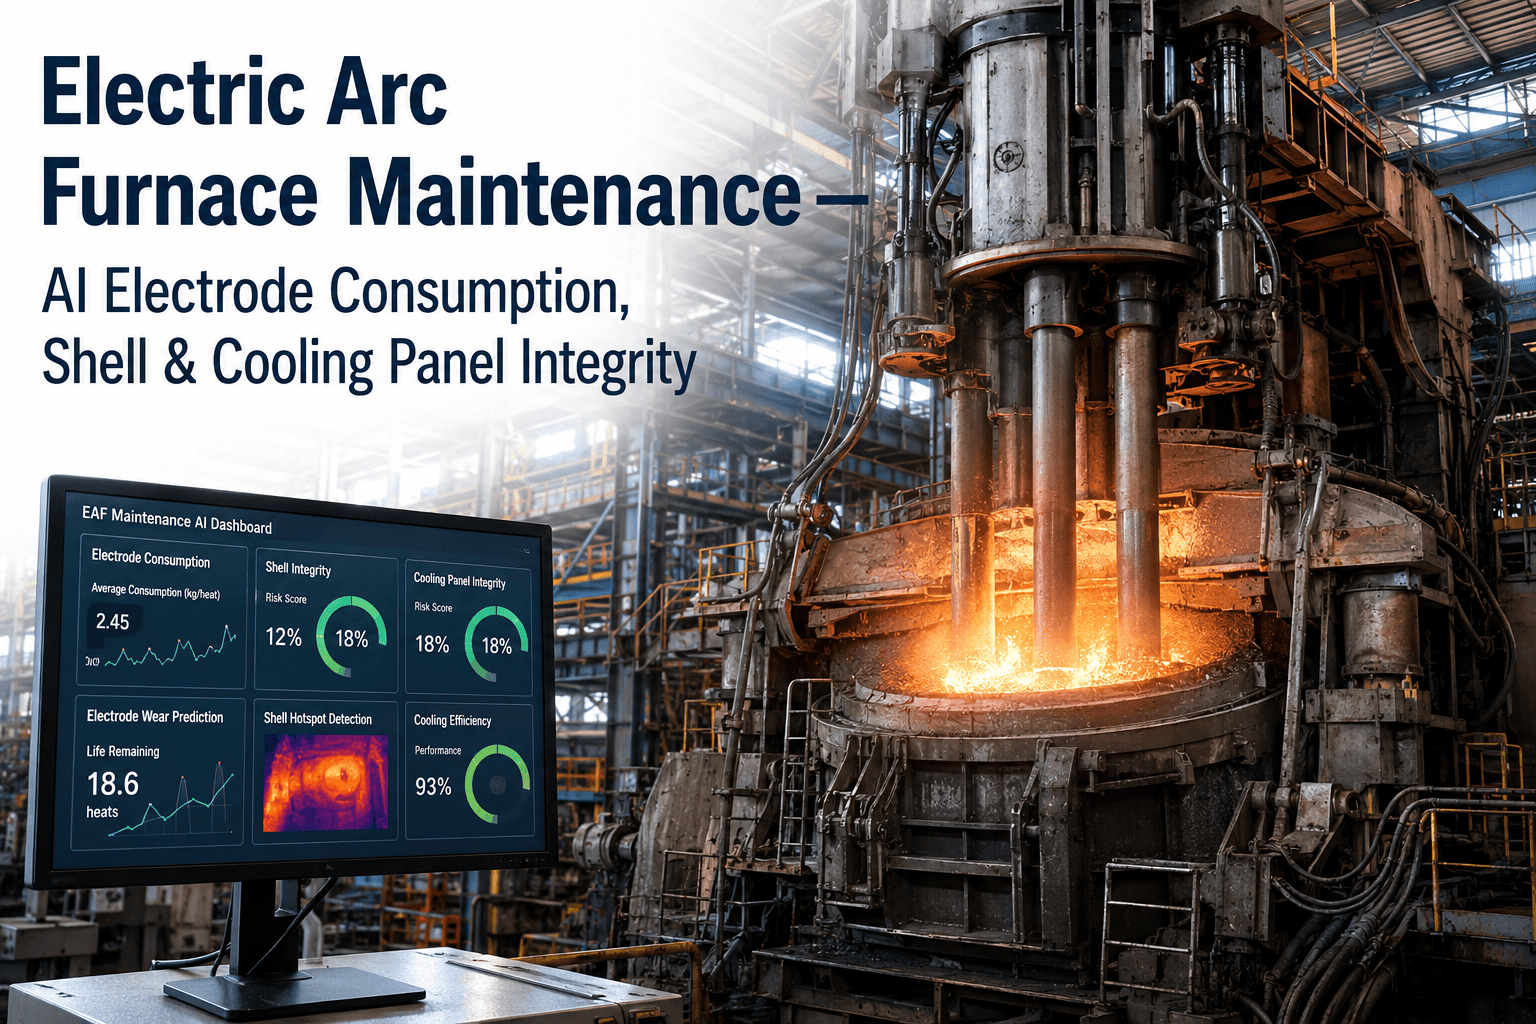
The Electric Arc Furnace is the most energy-intensive and asset-dense production unit in a mini mill or integrated EAF melt shop — and the one where unplanned downtime carries the highest per-event cost in the entire steelmaking complex. At $12,000 to $25,000 per hour of furnace idle time a single water-cooled panel failure, transformer trip, or electrode breakage event converts a manageable maintenance condition into a production emergency that disrupts downstream casting schedules, strains electrode and alloy inventories, and adds $80,000 to $400,000 in direct costs before the next heat begins. The difference between a melt shop that absorbs three to five such events per year and one that averages fewer than one is not equipment quality or operator skill — it is the analytics architecture that converts the condition data already being generated by the furnace control system into predictive maintenance intelligence. Electric Arc Furnace analytics management software connects electrode consumption trends, refractory wear signals, transformer thermal loading, and water-cooled component condition into a unified operational intelligence program that gives maintenance teams the lead time to intervene before the emergency. Operations that have deployed iFactory's EAF analytics management platform report a 61% reduction in unplanned melt shop downtime and average electrode consumption reductions of 8 to 14% within the first operating year.
Why EAF Analytics Requires Process-Area Separation — Not a Single Furnace Dashboard
Most EAF melt shop monitoring deployments begin with a single dashboard covering heat time, energy consumption per ton, and tap-to-tap cycle. That approach captures productivity metrics but misses the three categories of equipment degradation that generate the most unplanned downtime and production cost: electrode system failures that develop over heats before producing a breakage event, refractory wear that accumulates asymmetrically by zone until it forces an emergency repair shutdown, and transformer and power system conditions that trend toward protective trip for days before the trip occurs.
Each of these failure categories operates on a different time constant and requires different analytics framework. Electrode analytics operate on per-heat and per-campaign windows because consumption rate deviation from the grade-specific baseline is a heat-by-heat signal that compounds over days. Refractory analytics operate on thermal gradient trending that develops over weeks as campaigns progress. Transformer analytics operate on both real-time thermal monitoring (high-priority, minute-by-minute) and longer-term degradation signals (dissolved gas analysis trends over months). Building one dashboard that treats these as equivalent produces a tool that misses the early warning signals that require different response lead times.
Electrode Consumption Analytics: The Highest-ROI EAF Monitoring Program
Electrode consumption in an EAF operation represents 15 to 25% of the total variable cost per ton of liquid steel — making it the single highest-value target for EAF analytics investment. Electrode consumption rate varies legitimately with scrap mix, steel grade, power input profile, and heat sequence, but it also varies with electrode column condition (joint quality, thread engagement, column straightness), electrode regulation system performance, and furnace process management practices. The analytics program separates legitimate process variation from equipment-driven over-consumption — and that separation is worth $800,000 to $2.5 million per year at a typical 600,000-ton EAF mini mill.
Per-Heat Electrode Consumption Rate Analytics
Electrode consumption rate (kg per ton of liquid steel, or kg per MWh of energy input) is calculated per heat using the electrode diameter, column length measurement at heat start and end, and heat energy and tap weight data. A running average of consumption rate over the trailing 10 heats for each grade group and scrap mix category is the baseline against which current performance is measured. Deviation above 15% of the grade-specific baseline for three consecutive heats is the practical threshold for a process review trigger — sufficient to distinguish genuine equipment-driven over-consumption from normal heat-to-heat variation.
Electrode Regulation System Performance Analytics
The electrode regulation system controls arc length (and therefore arc voltage, arc power, and electrode consumption rate) by adjusting electrode position in response to arc impedance signals. Regulation system performance degradation — caused by hydraulic cylinder seal wear, position sensor drift, or control algorithm parameter drift — directly increases electrode consumption by widening the arc length variance around the setpoint. iFactory monitors regulation system performance through arc stability indices computed from electrical data and hydraulic response metrics.
| Parameter | Monitoring Method | Normal Range | Degradation Signal | Corrective Action |
|---|---|---|---|---|
| Arc stability index | Harmonic analysis, electrical data | Grade-specific baseline ±10% | Index decline >15% over 5 heats | Regulation parameter review; hydraulic check |
| Electrode response time | Position sensor vs. impedance signal lag | <150 ms at rated speed | Response >300 ms sustained | Hydraulic cylinder inspection; servo valve check |
| Electrode hunting frequency | Position sensor oscillation spectrum | <0.5 Hz sustained oscillation | Oscillation >1.5 Hz on any phase | PID gain recalibration; check arm structure |
| Arm position sensor drift | Encoder calibration check vs. mechanical reference | <5 mm deviation | >15 mm drift | Encoder recalibration or replacement |
| Hydraulic pressure consistency | Cylinder supply pressure at rated load | Design ±5% at working stroke | >12% pressure variation | Hydraulic pump and seal inspection |
Electrode Column Condition Monitoring
The electrode column — the assembled stack of electrode segments connected by graphite nipples — is subject to thermal, mechanical, and electrical stress with every heat. Column straightness, nipple engagement integrity, and the condition of the electrode clamp contact surfaces all affect the arc quality and the rate of electrode consumption. iFactory integrates column inspection records, nipple torque verification data, and arc electrical signature analysis to provide a per-column health index updated at each electrode addition.
Electrode Breakage Prevention Analytics
Electrode breakage is the most costly single equipment event in EAF operation — a broken column requires furnace power-off, mechanical retrieval, arc restart, and heat recovery procedures that typically add 45 to 90 minutes to the tap-to-tap cycle and can damage refractory if the broken stub falls into the melt pool. The analytics model for breakage prevention identifies the specific combination of column condition, heat process parameters, and furnace conditions that predict elevated breakage risk before the heat where the breakage would occur.
EAF Refractory Analytics: Campaign Management from First Heat to Planned Shutdown
EAF refractory lining management is where the quality of the analytics program most directly determines the ratio of planned to emergency maintenance shutdowns in the melt shop. A lining operating with an undetected hot spot in the sidewall slag zone can deteriorate from manageable condition to emergency shell cooling requirement in a single hot heel practice change — whereas the same condition detected three to seven heats earlier allows a scheduled gunning and inspection at the next planned tap-to-tap break. The analytics framework for EAF refractory connects shell thermocouple readings, lining wear zone models, hot repair consumption data, and campaign heat count into a continuously updated campaign condition map.
Shell Temperature Monitoring and Hot Spot Detection
EAF shell thermocouples — typically 12 to 40 sensors distributed across the sidewall, slagline, and bottom zones — provide the primary real-time signal for refractory condition. iFactory monitors each thermocouple against its campaign baseline (established in the first 20 heats) and applies rate-of-rise analytics at 1-minute intervals to distinguish hot spots developing from lining wear from the normal thermal cycling of the shell during each heat. The practical threshold for a hot spot alert is a shell temperature rise above 80°C above the zone baseline — at this point, 3 to 5 heats of gunning material consumption data is available to project whether the lining can be managed to the planned shutdown or requires earlier intervention. Above 150°C sustained, the alert escalates to immediate inspection requirement. Above 200°C, the recommendation is heat suspension pending emergency shell inspection.
Gunning Consumption Analytics and Zone Wear Modeling
Gunning material consumption per zone per heat is the most direct indicator of zone wear rate in the EAF lining. A zone requiring 15% more gunning material per heat than the campaign average for that zone and heat count is exhibiting accelerated wear that will reach critical thickness ahead of the planned lining life if the operating conditions are not adjusted. iFactory tracks gunning consumption per zone by heat number, cross-references it against the shell thermocouple data for that zone, and produces a zone wear rate model that projects the remaining campaign life for each zone independently — identifying which zone will reach minimum thickness first and determining the planned shutdown timing accordingly.
Roof and Delta Section Condition Analytics
The EAF roof and delta section are the refractory components subject to the most severe thermal cycling — heated to above 1,400°C during meltdown and cooled partially between heats. Roof panel condition analytics combine panel temperature monitoring, cooling water delta-T for water-cooled roof panels, and visual inspection record integration to track roof segment condition continuously. The roof delta section — the high-wear zone at the electrode penetration — requires specific wear tracking because its degradation directly affects furnace atmosphere control and off-gas system performance. Campaign heat count for each roof section, combined with temperature history, feeds the remaining life model that schedules roof changeout at planned heat-count intervals rather than emergency replacement after a cooling circuit failure.
Operating Practice Correlation to Wear Acceleration
EAF refractory wear rate is not constant — it varies with operating practices that differ by grade, scrap mix, and heat sequence position. High-oxygen lance intensity heats, calcium oxide-heavy slag practices for high-phosphorus scrap mixes, and extended power-on times for difficult grades all accelerate lining wear at different zone locations. iFactory's operating practice correlation engine continuously analyzes the relationship between heat-by-heat operating parameters and the zone wear rates measured in the thermocouple and gunning data — identifying which practices are driving above-average wear in each zone. This intelligence allows the metallurgy and process team to make informed trade-offs between heat efficiency and lining campaign life rather than discovering the cost of aggressive practices only at the campaign end.
Planned Campaign End Scheduling and Parts Inventory Integration
The output of the refractory campaign management model is a continuously updated projected campaign end date — the specific heat count at which the lining is projected to reach minimum safe thickness at the current wear rate. This projection, updated after every heat, feeds into the maintenance planning schedule with 3 to 6 weeks of advance notice before the planned shutdown — providing sufficient lead time to procure refractory materials, schedule contractor crews, and coordinate with production planning to minimize hot metal supply disruption. The projection also triggers the warehouse management system to verify refractory material availability against the planned reline bill of materials, generating procurement work orders for any material shortfalls while lead time is still available.
EAF Transformer and Power System Analytics: Protecting the Most Expensive Asset in the Melt Shop
The EAF furnace transformer — rated 60 to 150 MVA for a modern high-power EAF — is the single most capital-intensive asset in the melt shop, with replacement cost of $3 to $8 million and a 12 to 24 month lead time for a spare. Unlike most industrial transformers that operate at near-constant load under stable conditions, the EAF transformer operates under a uniquely demanding duty cycle: repeated short-circuit events during scrap bore-in, rapid load fluctuations through the melt cycle, and harmonic loading from the arc that accelerates insulation aging at rates significantly above nameplate thermal calculations. Transformer analytics is therefore not a standard oil analysis and thermal monitoring program — it is a specialized program calibrated to the EAF-specific duty cycle and failure modes.
| Asset | Primary Analytics Parameter | Monitoring Method | EAF-Specific Threshold | Failure Mode Detected |
|---|---|---|---|---|
| Furnace Transformer | Top-oil and winding temperature vs. EAF duty cycle model | RTD continuous + DGA quarterly | Top oil >90°C sustained; DGA trend per IEEE C57.104 | Thermal fault, partial discharge, insulation aging |
| On-Load Tap Changer | Contact wear index from operation count and DGA | OLTC counter + oil sample analysis | Contact oil carbon above 30 ppm or operation count >80% OEM limit | Contact arcing, oil contamination, mechanism wear |
| Secondary Bus Bars | Bus bar temperature at joint positions | IR camera or embedded temperature sensor | >15°C above adjacent bus section at same current | Joint resistance increase, connection loosening |
| Electrode Arm Cables | Flexible cable temperature and resistance check | Thermal imaging at inspection frequency | Hot spot >40°C above ambient at rated current | Strand damage, moisture ingress, terminal degradation |
| Reactors / Inductors | Coil temperature and cooling system performance | Winding RTD + cooling flow meter | Winding temp >design ΔT by 20°C at rated current | Cooling system fouling, turn-to-turn fault |
| Power Factor Capacitor Banks | Capacitor unit fuse status and reactive power output | Fuse monitoring relay + kVAR metering | Reactive output <95% of rated capacity | Individual unit failure, fuse operation, detuning |
Water-Cooled Component Analytics: Preventing the Highest-Consequence EAF Failure Mode
Water-cooled panels, roofs, lances, and tuyeres in the EAF operate in one of the most thermally aggressive environments in industrial manufacturing — directly exposed to radiant heat from liquid steel at 1,600°C, arc radiation above 5,000°C, and molten slag splashing. When a water-cooled panel fails — through burnthrough, weld cracking, or connection failure — water enters the furnace and contacts molten steel, creating a steam explosion event with energy release equivalent to several kilograms of TNT. Water-cooled component analytics is therefore not a maintenance efficiency program — it is a life-safety program that requires the highest priority in the EAF monitoring architecture.
Expert Review: What Top-Performing U.S. EAF Operations Do Differently with Analytics
EAF melt shops achieving tap-to-tap cycle times below 48 minutes, electrode consumption below 1.6 kg per ton of liquid steel, and refractory campaign lives above 1,200 heats consistently share four analytics practices that the majority of U.S. mini mill operations have not yet formalized. First, they manage electrode consumption as a financial KPI, not a process variable. Every heat's consumption rate is calculated in real time, expressed in dollars per ton using current electrode price, and reviewed in the daily operating report alongside energy cost and yield. When electrode cost per ton is a line item in the daily report rather than a quarterly procurement bill, the operational team develops the same cost-reduction instinct for electrode management that they have for energy and alloy consumption. Second, they have linked the refractory gunning schedule to the shell thermocouple readings rather than to a fixed heat count. Gunning is deployed where the temperature data says it is needed, not on a rotation driven by the previous campaign's pattern. This change alone extends average campaign life by 12 to 18% at most melt shops that implement it. Third, their transformer monitoring program accounts for the EAF duty cycle — they do not apply standard power transformer monitoring intervals to a furnace transformer.
— Industry Benchmark Review, U.S. EAF Melt Shop Analytics Programs, iFactory Analytics Reference 2026Conclusion
Electric Arc Furnace analytics management is not a monitoring program layered on top of an existing operation — it is the operational intelligence framework by which a U.S. melt shop systematically closes the gap between the theoretical performance of the furnace and what it actually delivers across a full operating year.
The discipline that separates EAF operations achieving sub-48-minute tap-to-tap, below-1.6 kg/ton electrode consumption, and 1,200+ heat campaign lives is the same discipline found in every other high-performance industrial analytics program: the analytics outputs are coupled to operational decisions that generate measurable results. A shell temperature trend that triggers a gunning work order before the hot spot reaches emergency threshold, an electrode consumption deviation that generates a process review before three heats of over-consumption becomes the new normal, and a transformer DGA result that triggers an OLTC inspection before contact contamination forces an emergency outage are the specific couplings that determine whether an EAF analytics program reduces cost or just produces data.
Frequently Asked Questions
Electrode consumption rate is calculated per heat using the measurement of electrode column length at heat start and heat end (from the electrode position sensor), combined with the electrode diameter and bulk density to compute the mass consumed. This per-heat consumption value is then normalized against tap weight (kg per ton of liquid steel) and energy input (kg per MWh) to produce consumption rates that can be compared across heats with different production targets and power input profiles. The correct baseline for analytics comparison is not a single facility-wide number — it is a stratified baseline by grade group, scrap mix category, and heat sequence position (first heat cold start, sequenced heat after warm heat, etc.), because these variables legitimately affect consumption rate by 15 to 30%.
The most important EAF refractory analytics parameter for preventing emergency shutdowns is the rate-of-rise analysis applied to shell thermocouple readings — not the absolute temperature value. An absolute temperature alarm set at 300°C on an EAF shell thermocouple will fire when the situation has been developing for days or weeks; the rate-of-rise signal — temperature rising 8 to 12°C per heat in a zone that has been stable at ±5°C for the previous 20 heats — identifies the developing hot spot at a point where it is still manageable through targeted gunning rather than an emergency shutdown for major repairs. The practical analytics implementation requires three elements: (1) a per-heat temperature recording for each thermocouple (not just continuous streaming, which obscures the heat-to-heat pattern), (2) a zone baseline established from the first 15 to 20 heats of the campaign and updated at each planned shutdown inspection, and (3) a rate-of-rise calculation that triggers an alert when any zone shows sustained 2 to 3 heat-over-heat increases above the statistical noise level for that zone.
EAF furnace transformers should be sampled for dissolved gas analysis quarterly at minimum — not annually as is appropriate for lightly loaded substation transformers. The higher OLTC operation rate, harmonic loading, and short-circuit event exposure of EAF transformers accelerates the development of DGA-detectable fault conditions at rates 3 to 5 times faster than standard utility or industrial power transformers. In practice, the most valuable DGA program for an EAF transformer is a trending program rather than a single-threshold alarm program: monthly sampling, with each result plotted against the transformer's own DGA history rather than against generic IEEE C57.104 limits, identifies the rate of change in key gases that indicates accelerating fault development. The gas groups with highest diagnostic value for EAF transformers are: ethylene and acetylene, which indicate thermal faults and arcing respectively at the OLTC contact or in the main tank insulation; hydrogen, which increases with partial discharge and insulation moisture; and methane, which indicates low-temperature thermal degradation in the main tank oil.
AIST (Association for Iron and Steel Technology) Technical Report No. 8, Water-Cooled Systems for Electric Furnace Steelmaking, provides the authoritative guidance for water-cooled panel monitoring in U.S. EAF operations. The minimum monitoring configuration recommended by AIST includes: individual inlet and outlet temperature measurement for every panel cooling circuit (not group or zone averages — individual circuits), monitored at a scan rate of 60 seconds or faster; automatic alarm at 8°C above the circuit's normal delta-T baseline, with escalation logic to a heat suspension recommendation at 12°C sustained for two consecutive scan cycles; flow rate monitoring for each panel circuit with alarm at flow reduction below 85% of design; and conductivity monitoring in the cooling water return system to detect water-side contamination that can indicate developing panel damage before the temperature signal reaches the alarm threshold. iFactory's water-cooled panel module implements all four AIST minimum requirements and adds trend visualization.
For a single EAF furnace of 150,000 to 300,000 tons per year liquid steel capacity, iFactory's EAF analytics management deployment runs $75,000 to $165,000 in total platform investment over a 6 to 10 week implementation timeline. The fastest-returning value streams in year one are electrode consumption analytics and refractory campaign management, in that order. Electrode consumption analytics typically identify $400,000 to $1,200,000 per year in cost reduction opportunity within the first 60 days of consumption baseline establishment — primarily from identifying heat categories running systematically above the grade-specific baseline for reasons addressable through regulation system calibration, practice adjustment, or electrode quality specification. Refractory campaign management typically demonstrates ROI within the first campaign cycle: a campaign that runs 12 to 18% longer than the mill's historical average (a typical first-campaign result from thermocouple-driven gunning optimization) saves $180,000 to $500,000 in unplanned reline cost and production disruption per campaign.