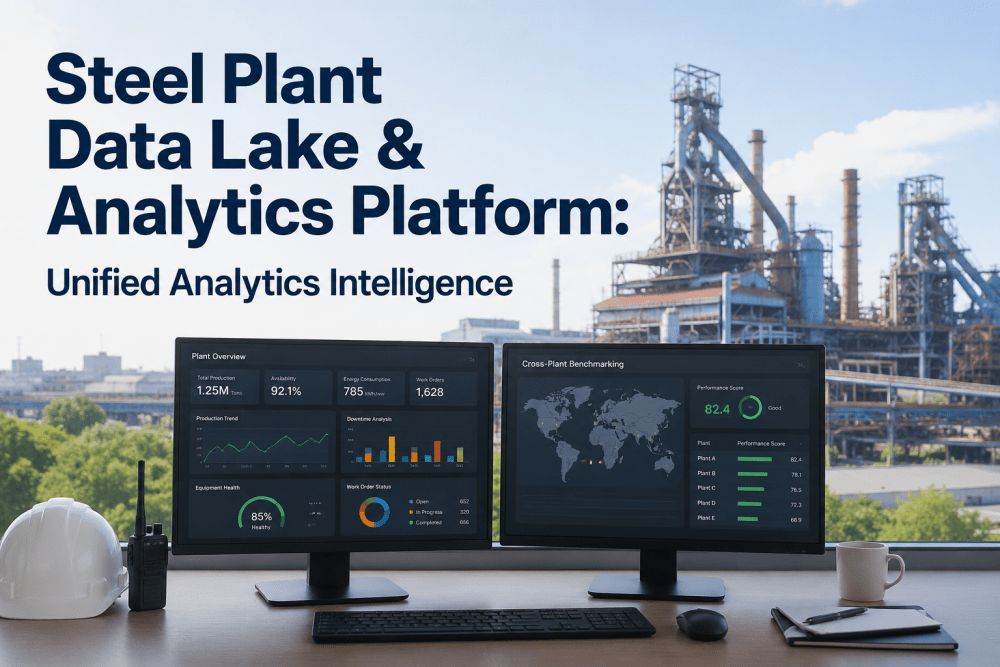
Steel Plant Data Lake & Analytics Platform: Unified analytics Intelligence
By Friar Lawrence on May 22, 2026
Most steel plant analytics programs are not suffering from a data shortage—they are suffering from a data fragmentation problem. Sensor readings sit in one historian, work orders in a CMMS production logs in a separate MES, and quality records in a third system that no one fully owns. The result is that a maintenance engineer trying to understand why a particular roughing stand is generating high scrap rates has to manually cross-reference four systems, two spreadsheets, and a paper logbook before they can even frame the right question. A unified data lake and analytics platform eliminates that friction by creating a single, governed repository where every data stream—from 10-millisecond vibration signals to weekly executive KPI reports—lives, integrates, and becomes queryable in one place. To see how iFactory's unified analytics architecture is already recovering millions in steel plant margin, Book a Demo with our platform engineering team.
UNIFIED ANALYTICS INTELLIGENCE
Is Your Steel Plant Running on Fragmented Data?
iFactory's Data Lake & Analytics Platform unifies sensor streams, work orders, quality records, and production logs into a single intelligence layer—eliminating blind spots that cost steel plants millions in undetected failure and margin leakage.
73%of steel plant operational data is never analyzed due to system fragmentation
$1.8MAverage annual cost of decisions made on incomplete cross-system data
6 hrsAverage time engineers spend manually aggregating data before analysis begins
2.7xFaster failure root-cause identification with unified data lake vs. siloed systems
Why Steel Plants Cannot Afford Data Silos in 2026
The Hidden Operational Cost of Disconnected Systems
A modern integrated steel plant generates between 2 and 8 terabytes of operational data every day. That number sounds impressive—until you realize that the vast majority of it is trapped in systems that were never designed to communicate with each other. Your DCS historian captures process variables at one-second intervals. Your CMMS records work orders in a relational database. Your quality system logs chemical analysis and tensile test results in a format that predates cloud computing. And your ERP tracks production tonnage in a completely separate schema.
The consequence is not just inconvenience—it is a systematic inability to ask the questions that matter most. Questions like: which specific combination of ladle temperature, casting speed, and roll gap produces the highest incidence of surface defects? Or: does a particular maintenance technician's work order closure pattern correlate with higher repeat-failure rates on the same equipment? These are the questions that separate world-class steel operations from average ones. They are answerable only when all relevant data streams are unified, time-synchronized, and queryable through a single analytics layer.
The 4-Layer Architecture of a Steel Plant Data Lake
From Raw Sensor Signals to Executive Decision Intelligence
A production-grade steel plant data lake is not a single database—it is a four-layer architecture where each layer serves a distinct function. Raw data is ingested at high frequency at the edge, standardized and contextualized in a processing layer, stored in a governed repository, and surfaced through analytics interfaces calibrated to each user type. Understanding this architecture is the prerequisite to evaluating any analytics platform vendor.
Layer 01
Ingestion & Edge Processing
High-frequency sensor data (vibration, temperature, flow, current) is captured at the asset level via PLC/OPC-UA connectors and edge compute nodes. Data is timestamped, compressed, and validated before transmission—eliminating the bandwidth and latency problems of sending raw signals directly to cloud.
10ms – 1s resolution
Layer 02
Contextualization & Schema Mapping
Raw signals are mapped to asset hierarchies (plant → department → equipment → component) and enriched with metadata from the CMMS, ERP, and MES. A rolling mill's vibration reading becomes meaningful when it is tagged with the roll campaign number, the steel grade being processed, and the last maintenance event on that bearing.
Real-time enrichment
Layer 03
Governed Data Lake Storage
Contextualized data is stored in a governed repository with role-based access control, data lineage tracking, and retention policies calibrated to regulatory and operational requirements. Time-series data, event logs, and structured records coexist in a unified schema that supports both operational queries and long-horizon analytical workloads.
Multi-year retention
Layer 04
Analytics & Intelligence Interfaces
The analytics layer surfaces insights through role-calibrated interfaces: real-time dashboards for shift supervisors, failure pattern mining tools for reliability engineers, cross-plant benchmarking reports for operations directors, and executive KPI dashboards for plant leadership—all drawing from the same governed data foundation.
Role-based views
Sensor Data Ingestion: What "Real-Time" Actually Means in Steel
Frequency, Fidelity, and the Failure Detection Window
The phrase "real-time analytics" is used loosely enough in industrial software marketing that it has lost most of its meaning. In a steel plant context, real-time means something specific and operationally consequential: the time between a physical event occurring at an asset and an analyst-actionable alert appearing on a screen. For most steel plant failure modes, that window determines whether intervention is possible before a catastrophic event or only after one.
Data Source
Typical Raw Frequency
Minimum Useful Frequency
Key Failure Mode Detected
Detection Window Lost at 10-min Polling
Vibration (rolling mill bearings)
10,000 Hz (raw)
1 Hz (aggregated)
Bearing spall initiation
Entire early-warning period
Motor current signature
1,000 Hz (raw)
1 Hz (aggregated)
Rotor bar cracking, air gap eccentricity
8–12 week advance warning lost
Furnace temperature profile
1 Hz
5 seconds
Refractory hot spot formation
2–4 hr detection delay
Hydraulic pressure (screw-down)
100 Hz
1 Hz
Seal wear, cylinder leakage
1–3 hr detection delay
Gas flow (pipeline)
1 Hz
10 seconds
Pipeline leak, valve bypass
Weekend-scale leak accumulation
Work order completion status
Event-driven
Event-driven
PM compliance gaps
Compliance drift undetected
Quality test results (chem/tensile)
Per-heat
Per-heat
Grade drift, alloy deviation
No impact (event-driven)
The practical implication is that a data lake architecture for steel must support heterogeneous ingestion frequencies—treating a 10,000 Hz vibration signal and a once-per-heat quality record as equally valid data objects within the same governed schema. Platforms that force all data into a single polling frequency either lose high-value signals through downsampling or create storage and compute costs that make the platform economically unviable at scale.
Concerned your current analytics polling frequency is masking failure signals? Book a Data Architecture Review with our platform engineering team to identify your detection blind spots.
Failure Pattern Mining: From Historical Data to Predictive Models
How a Governed Data Lake Transforms Maintenance Intelligence
The most underutilized capability in steel plant analytics is not real-time monitoring—it is historical failure pattern mining. Every major equipment failure in your plant's history left a data signature: a sequence of sensor readings, maintenance events, and operational conditions that, in retrospect, preceded the failure by days or weeks. That signature is recoverable if the data exists in a unified, time-synchronized repository. And once recovered, it becomes the training signal for a predictive model that catches the next occurrence before it becomes a failure.
01
Historical Failure Reconstruction
Query the data lake for all sensor readings, work orders, and process conditions in the 30–90 days preceding a documented failure event. Identify the specific pattern—temperature rise rate, vibration frequency shift, PM compliance gap—that preceded each failure class. This analysis is the foundation of every predictive model built on real plant data rather than vendor-supplied generic thresholds.
02
Cross-Asset Failure Correlation
A data lake enables correlation analysis that siloed systems cannot support. Does a furnace lining degradation pattern consistently precede quality rejections on the continuous caster two shifts later? Does a specific roll shop maintenance sequence correlate with surface defect rates on the downstream finishing line? These cross-asset correlations are invisible when systems are disconnected and become high-value maintenance intelligence when data is unified.
03
Failure Mode Classification and Severity Scoring
With sufficient historical data, machine learning models can classify active failure precursor patterns by type (bearing degradation vs. lubrication failure vs. alignment drift) and by severity (weeks-to-failure vs. days-to-failure). This classification enables maintenance planners to prioritize interventions not by asset age or fixed schedules, but by real-time risk score derived from live sensor data.
04
Continuous Model Retraining Against New Failure Events
Predictive models built on a governed data lake improve continuously. Every new confirmed failure event—with its precursor data signature—is automatically ingested as a training example, refining the model's accuracy over time. This compound learning effect means a data lake platform becomes more valuable with every year of operation, creating a durable competitive advantage that cannot be replicated by facilities still running on disconnected systems.
Cross-Plant Benchmarking and Executive Dashboard Design
From Operational Data to Strategic Decision Intelligence
A data lake architecture that serves only operational users—maintenance technicians and shift supervisors—captures roughly 40% of its potential value. The strategic value layer is unlocked when the same governed data foundation powers cross-plant benchmarking and executive dashboards that inform capital allocation, production strategy, and operational improvement priorities at the leadership level.
Siloed Reporting Approach
Monthly KPI reports assembled manually from 4+ systems
No cross-plant OEE or maintenance cost comparison
Executive dashboards lag actuals by 2–4 weeks
Capital decisions based on department self-reporting
No failure cost attribution by asset or department
Live KPI dashboards auto-refreshed from single data source
Real-time cross-plant OEE, maintenance cost, and scrap benchmarking
Executive dashboards reflect actuals within minutes, not weeks
Capital allocation supported by objective cross-asset risk scoring
Full failure cost attribution with drill-down to root cause and work order
Continuous internal benchmarking built into standard reporting cadence
Executive Dashboard KPI Framework — Steel Plant Data Lake
Production
OEE by production line (real-time)
Tonnes produced vs. plan (shift, daily, MTD)
Yield loss by failure category
Heat-to-heat cycle time trending
Maintenance
Maintenance cost per tonne (rolling 12-month)
Planned vs. unplanned maintenance ratio
MTBF and MTTR by asset class
PM compliance rate by department
Quality
Prime yield percentage by product grade
Defect rate by process zone (casting, rolling, finishing)
Customer claim rate trending (rolling 90-day)
Scrap cost by defect type and originating asset
Energy & Cost
Energy cost per tonne by furnace and process
Utility cost vs. budget (CapEx and OpEx)
Carbon intensity index (tCO2 per tonne steel)
Analytics program ROI (cumulative vs. spend)
Ready to Unify Your Steel Plant Data Infrastructure?
From sensor ingestion architecture to executive dashboard design and cross-plant benchmarking, iFactory's unified data lake platform gives steel manufacturers the intelligence foundation to move from reactive operations to strategic performance management.
Data Governance, Security, and Integration Standards
The Non-Negotiable Foundation of Industrial Data Lake Architecture
A data lake without governance is a data swamp—a repository where data accumulates without context, quality assurance, or access control, until it becomes more liability than asset. In steel plant environments, where operational data includes proprietary process parameters, safety-critical equipment records, and financially sensitive production costs, governance is not optional. It is the architecture layer that determines whether the platform is an enterprise asset or an audit risk.
Data Quality & Validation
Every ingested data stream passes through automated quality checks: range validation, rate-of-change plausibility, sensor dropout detection, and duplicate elimination. Data that fails validation is flagged and quarantined rather than silently corrupting analytical models. Quality scores are tracked per data source and surfaced to platform administrators so degraded sensor inputs trigger maintenance tickets before they affect analytics accuracy.
Role-Based Access Control
Data access is governed by role and department. A shift supervisor sees live production data for their area. A reliability engineer accesses full asset history across departments. Finance sees cost aggregations without exposure to raw process data. Executive dashboards are pre-configured with appropriate aggregation levels. Every data access event is logged with user ID, timestamp, and data object—creating an immutable audit trail for both internal review and regulatory compliance.
Integration Protocol Standards
Production-grade steel plant data lakes must support OPC-UA for DCS/PLC integration, REST and GraphQL APIs for CMMS and ERP connectivity, MQTT for edge device communication, and standard industrial data formats including ISA-95 and ISO 15926. Platforms that require custom connectors for every source system create integration debt that compounds with every vendor change or system upgrade.
Data Lineage & Audit Trail
Every analytical output—every alert, every dashboard value, every predictive model score—must be traceable back to its source data with complete lineage documentation. This traceability is essential for root-cause validation when an alert is acted upon, for regulatory compliance when process records are audited, and for model governance when predictive algorithms are updated or retrained on new failure event data.
"Before we unified our data architecture, our reliability team was spending more time collecting data than analyzing it. We had three historians, a CMMS that had never been integrated with the process data, and quality records in a system that the maintenance team had never accessed. When we finally brought everything into a single governed data lake, the first thing that happened was that our engineers started asking questions they had never been able to ask before. Within 90 days, we identified a roll wear pattern that was costing us approximately $380,000 per year in preventable scrap—a pattern that had been buried in disconnected data for at least three years. The platform paid for itself in the first quarter."
Chief Reliability OfficerIntegrated Flat Steel Producer — U.S. Midwest
Conclusion
The steel plants that will achieve sustainable cost and quality advantages in the next decade are not the ones with the most sensors—they are the ones whose data is unified, governed, and analytically actionable at every organizational level. A data lake and analytics platform is not a technology project; it is an operational infrastructure investment that determines the quality of every decision made in the facility from that point forward.
The framework is straightforward: ingest all relevant data streams at appropriate frequencies, contextualize them against asset and process hierarchies, store them in a governed repository, and surface them through role-calibrated analytics interfaces that serve the technician, the engineer, the operations director, and the executive. When that architecture is in place, failure pattern mining becomes systematic rather than episodic, cross-plant benchmarking becomes continuous rather than consultative, and the gap between data generated and data acted upon closes—permanently.
UNIFIED ANALYTICS INTELLIGENCE
Get a Data Architecture Assessment for Your Steel Plant
Our platform engineering team will map your current data sources, identify integration gaps and blind spots, and deliver a structured roadmap showing exactly how a unified data lake transforms your operational and strategic decision-making capability.
A data warehouse stores structured, pre-processed data optimized for specific, known queries—typically financial and production summary reports. A data lake stores raw and semi-structured data in its native format, including high-frequency time-series sensor signals, unstructured maintenance notes, and image data from vision inspection systems. For steel plant analytics, a data lake is the correct architecture because the most valuable analytical use cases—failure pattern mining, cross-asset correlation, and predictive model training—require access to raw signals at native resolution, not pre-aggregated summaries. Modern steel analytics platforms typically implement a "lakehouse" architecture that combines the raw storage flexibility of a data lake with the query performance of a warehouse for reporting workloads.
Implementation timelines for steel plant data lake deployments range from 8 weeks for a single-department pilot to 12–18 months for a full facility unification covering all process areas, asset classes, and enterprise system integrations. The critical path is almost always data source inventory and integration engineering—not platform configuration. Facilities that have well-documented OPC-UA tag lists and standardized CMMS data schemas complete integrations significantly faster than those with undocumented legacy historians and inconsistent data naming conventions. A phased approach—starting with the highest-value data sources (process sensors + CMMS + quality) and expanding from there—typically delivers measurable ROI within the first 90 days while the broader integration program continues in parallel.
Effective cross-plant benchmarking in steel environments requires normalization against production context, not raw metric comparison. A maintenance cost per tonne figure is meaningful for benchmarking only when normalized for product mix complexity, equipment age distribution, and production volume. A well-architected data lake implements a semantic layer that translates facility-specific asset hierarchies and naming conventions into standardized KPI definitions—so that OEE at a flat-rolled facility is calculated on the same basis as OEE at a long-product facility, even though the underlying equipment and process structures are completely different. This normalization layer is typically the most complex element of a multi-site data lake deployment and is the primary reason generic BI tools underperform purpose-built industrial analytics platforms for steel cross-plant comparison.
Steel plant operational data stored in cloud or hybrid data lake architectures is subject to several security and compliance frameworks. For facilities with Department of Defense supply chain relationships, CMMC (Cybersecurity Maturity Model Certification) requirements apply to any system storing controlled unclassified information, which can include proprietary process parameters and production specifications. Broadly, steel plant data lakes should implement encryption at rest (AES-256) and in transit (TLS 1.3), network segmentation between OT and IT environments consistent with IEC 62443 standards, and role-based access control with multi-factor authentication. Data residency requirements—particularly for multinational steel groups—may mandate that specific data sets remain within national boundaries, requiring geo-fenced cloud storage configurations. Evaluate any platform vendor against NIST Cybersecurity Framework alignment and SOC 2 Type II certification as minimum baseline security assurances.
The minimum historical data requirement for useful predictive models in steel plant maintenance depends heavily on equipment failure frequency. For assets with failure modes that occur multiple times per year—such as roll bearing degradation or hydraulic seal wear—12–18 months of quality sensor data is typically sufficient to build models with meaningful predictive accuracy. For lower-frequency but higher-consequence failures—such as EAF roof refractory failure or transformer insulation breakdown—3–5 years of historical data may be needed to accumulate enough confirmed failure events for robust model training. In practice, facilities with less than 24 months of unified historical data typically start with threshold-based anomaly detection rather than full predictive models, then transition to ML-based prediction as the data lake accumulates sufficient labeled failure history. This phased approach delivers immediate value from day one while building toward more sophisticated predictive capability over time.