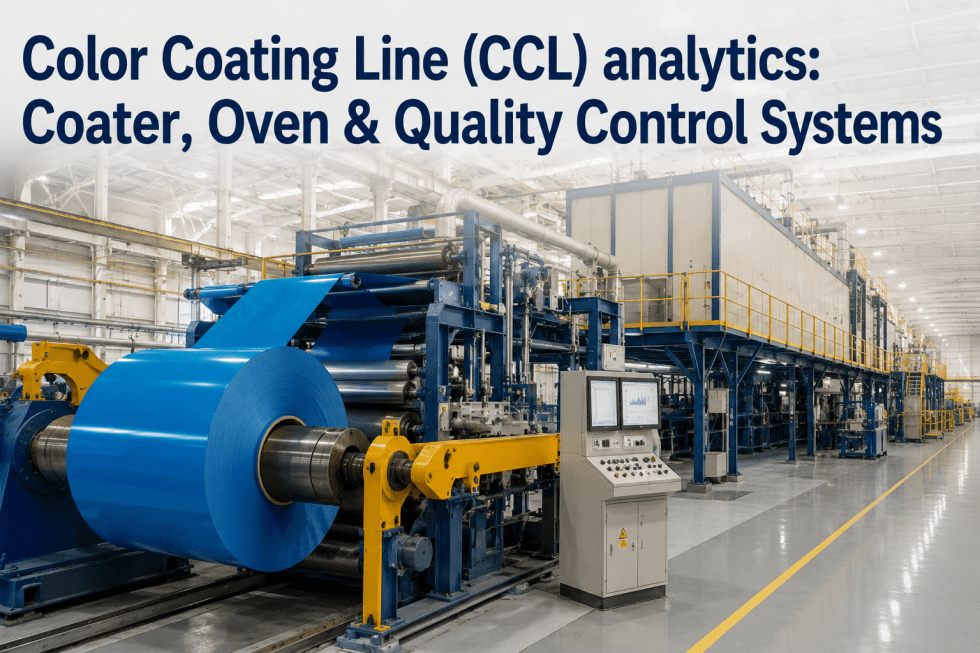
Color coating lines occupy a unique position in the flat-rolled steel value chain — they are simultaneously the highest-value-add operation and the highest-defect-risk operation in the finishing sequence. A coil entering the CCL has already absorbed the full cost of steelmaking, hot rolling, cold rolling, and galvanizing. Everything that happens on the color coating line either protects that value or destroys it. A paint adhesion failure, a curing oven temperature excursion, a coater head drip incident, or a color measurement deviation that escapes the line and reaches a construction panel fabricator can trigger a full-coil rejection — returning a product worth $1,400 to $2,200 per tonne to the plant as scrap or rework at a fraction of that value. The CCL operations achieving the lowest defect rates and the highest prime yield are not running better equipment than their competitors. They are running better data — real-time process analytics that connect coater chemistry, oven temperature profiles, chemical treatment performance, and color quality measurements into a single continuous intelligence layer that catches excursions before they become finished-coil rejections. Operations that schedule a CCL analytics demo with iFactory are discovering that AI-integrated process monitoring closes the gap between coating parameter drift and corrective action before a single square meter of finished panel is committed to a defective specification.
Why CCL Process Control Is More Complex Than Most Finishing Operations Recognize
The color coating line looks deceptively simple compared to the thermal and mechanical complexity of a rolling mill — a strip running through chemical treatment tanks, coater heads, and curing ovens at 60 to 120 meters per minute. The process control challenge is that every one of these stages is chemically or thermally sensitive in ways that interact with each other. The chemical pretreatment system's chromate or chrome-free conversion coating quality determines paint adhesion performance. The coater head's wet film thickness determines dry film thickness after cure. The curing oven's peak metal temperature (PMT) determines whether the coating crosslinks correctly to achieve the specified hardness, flexibility, and gloss. And the color measurement system's spectrophotometric reading at line exit determines whether the finished coil ships as prime or goes to hold for disposition review.
What makes CCL analytics structurally different from other finishing line monitoring problems is the time-delay relationship between cause and detection. A coater head viscosity drift at station 1 produces a dry film thickness deviation that the X-ray fluorescence gauge detects 45 to 90 seconds later — after 90 to 180 meters of strip has already passed through the oven. By the time the color spectrophotometer at line exit flags a gloss or color deviation, the process event that caused it occurred 3 to 5 minutes earlier in the sequence. Operators managing CCL quality by watching the line-exit quality gauge are always correcting last shift's problem on this shift's strip. iFactory's CCL analytics platform inverts this dynamic — correlating real-time coater parameters, oven temperature profiles, and chemical treatment readings into a predictive quality model that identifies excursion risk at the point of occurrence, not the point of detection.
- Color and gloss deviations detected at line exit — 3–5 minutes after the causative process event
- Coater head viscosity managed by operator observation and periodic laboratory samples
- Curing oven PMT profiled at scheduled intervals — temperature excursions between profiles go undetected
- Chemical treatment bath chemistry managed by shift-end titration — bath drift accumulates between samples
- Color matching adjusted by operator experience — recipe approval depends on individual skill level
- Coating weight compliance verified by periodic XRF sampling — exceedances between samples generate waste
- Coater head viscosity and wet film thickness correlated to predicted dry film and color outcome in real time
- Oven temperature profile monitored at 10-second intervals — PMT excursions flagged within one cure cycle
- Chemical treatment bath chemistry tracked continuously — bath add schedule generated automatically
- Color recipe performance mapped per color-grade-speed combination — operator-independent consistency
- Continuous XRF coating weight data linked to coater head settings — closed-loop adjustment recommendations
- Defect source attribution within minutes of coil completion — engineering action before the next order runs
Coater Head Analytics: Managing Wet Film, Viscosity, and Application Consistency
The coater head — whether a roll coater, curtain coater, or reverse roll coater — is the most mechanically sensitive stage of the CCL. Wet film thickness is determined by the combination of applicator roll speed ratio, metering roll gap, paint viscosity, and strip speed. Any one of these variables drifting outside its control window produces a dry film thickness deviation that — depending on its magnitude — results in either a color mismatch (thin film, low hiding power) or a coating cost overrun (thick film, excess paint consumption). At current architectural coatings pricing of $4.50 to $9.00 per liter depending on paint type, a chronic 2 µm overcoat on a 100,000-tonne-per-year CCL represents $180,000 to $420,000 in annual paint overconsumption — invisible without coating weight analytics at the coil level.
iFactory's coater head analytics module integrates wet film thickness gauges, viscosity monitoring systems, applicator roll speed sensors, and metering roll gap encoders into a unified coater performance dashboard. The platform tracks the relationship between coater parameters and achieved dry film thickness across thousands of coils — building a line-specific model that predicts the coater settings required to achieve target film thickness for each color, paint type, and strip speed combination. This eliminates the trial-and-error setup time that most CCL operations accept as normal at color transitions and order changes. Book a coater head analytics assessment to quantify your current setup loss and paint overconsumption exposure.
Curing Oven Analytics: Peak Metal Temperature, Zone Control, and Cure Quality
The curing oven is the thermal commitment stage of the CCL — where the wet paint film is converted into a crosslinked coating with the mechanical, chemical, and aesthetic properties specified by the customer. Peak metal temperature (PMT) is the single most critical process variable: too low, and the coating is undercured — soft, lacking adhesion, failing bend tests and T-bend flexibility specifications. Too high, and the coating is overcured — brittle, discolored, with degraded gloss retention. Most architectural and industrial coatings have a PMT specification window of ±10°C around the target — and maintaining this window at line speeds varying between 60 and 120 mpm, across strip widths from 600 to 1,600 mm, requires zone-by-zone temperature control that cannot be reliably managed without continuous thermal analytics.
The problem most CCL operations face is that oven temperature is measured at the air or gas temperature inside each zone — not at the strip surface. Strip PMT is calculated from a thermal model that accounts for strip speed, strip thickness, strip width, and zone air temperature. If that model is not continuously updated with actual strip conditions, it diverges from reality — particularly during speed changes, strip width transitions, or burner aging events that reduce a zone's thermal output. iFactory's curing oven analytics module integrates zone thermocouple data, strip speed encoders, strip dimension data, and where available, strip surface pyrometry into a continuous PMT estimation model that alerts process engineers when the calculated PMT is approaching the upper or lower specification limit — with enough lead time to correct burner output or line speed before the limit is crossed.
Chemical Treatment Analytics: Bath Chemistry, Conversion Coating, and Adhesion Baseline
The chemical pretreatment section of a CCL — cleaning, rinse, conversion coating, and passivation stages — is the least visible and most consequential quality control stage in the process. A properly applied conversion coating (chromate, chrome-free zirconium, or thin-film pretreatment) provides the adhesion foundation that determines whether the paint system will pass 1,000-hour salt spray requirements and 5-year outdoor weathering durability standards. A conversion coating that is applied from a bath outside its operating specification — pH out of range, coating weight below minimum, rinse water conductivity elevated — produces a paint adhesion failure that will not manifest until the fabricator's press shop or the customer's weathering exposure. By that point, the liability exposure has compounded well beyond the original coil value.
Color Matching & Quality Control Analytics: From Spectrophotometry to Prime Yield
Color quality on a CCL is judged by three spectrophotometric parameters — L* (lightness), a* (red-green axis), and b* (yellow-blue axis) — measured against a customer-approved color master at line exit. The combined color difference ΔE* must typically fall within ±1.0 ΔE* for architectural panels, ±0.8 ΔE* for premium facade products, and ±1.5 ΔE* for general commercial applications. Gloss level at 60° incidence angle must typically be within ±5 gloss units of the specification. These are tight tolerances for a process variable that is influenced by paint batch variation, film thickness deviation, oven PMT variation, and substrate surface roughness variation — all simultaneously.
Most CCL color quality programs manage this challenge with a combination of laboratory color approval before production, manual spectrophotometer readings at the start of each coil, and operator adjustments based on experience. This approach has a fundamental limitation: it does not detect the gradual color drift that accumulates during a production run as paint viscosity changes, bath temperature drifts, or line speed varies. iFactory's color analytics module connects continuous in-line spectrophotometer data, film thickness measurements, oven PMT records, and paint batch traceability into a color quality model that identifies the process root cause of any ΔE* deviation — and predicts color drift risk before the finished coil falls outside specification. Schedule a color quality analytics assessment to see how iFactory reduces color-related prime yield losses at your CCL.
| Color Quality Parameter | Typical Specification | Primary Process Driver | iFactory Detection Method | Avg. Prime Yield Recovery |
|---|---|---|---|---|
| ΔE* Color Difference | ≤1.0 ΔE* (architectural) | Film thickness, paint batch, PMT | Continuous in-line spectrophotometry correlated to coater and oven parameters | +2.8–4.1% |
| 60° Gloss Level | Target ±5 GU | PMT, cure level, film thickness | In-line gloss measurement linked to PMT model — overcure and undercure flagged | +1.9–3.2% |
| Dry Film Thickness | Topcoat: ±2 µm of target | Coater head setup, viscosity, speed | XRF coating weight with real-time coater parameter correlation | +1.4–2.6% |
| T-Bend Flexibility | 0T–2T per grade spec | PMT (crosslink density), film thickness | Cure quality model predicts bend performance from oven PMT history per coil | +0.8–1.5% |
| Salt Spray Adhesion | ≥1,000 hours per EN 13523 | Conversion coating weight, cleaner stage | Chemical treatment analytics flags coils with below-minimum conversion coating weight before painting | +1.1–2.0% |
| Surface Defect Rate | <0.5% area per coil | Coater head drips, oven deposits, roll marks | In-line surface inspection system integrated with process event log — defect attributed to source equipment | +2.2–3.8% |
Expert Perspective: What Process Analytics Changes in Color Coating Line Operations
The color coating line is probably the most underanalyzed major asset in the flat-rolled finishing sequence, and the reason is deceptively simple: the process looks less complex than a rolling mill. There are no extreme forces, no high-temperature metallurgy, no dramatic mechanical events. What there is instead is a cascading sensitivity between stages that is invisible unless you are correlating data across the entire line simultaneously. I have consulted at facilities where the color quality team was making spectrophotometer adjustments at the exit end of the line three times per shift, and the root cause — a paint viscosity drift in the coater pan that was traceable to a paint feed temperature controller that had been out of calibration for six weeks — was sitting in the coater data that no one was looking at. The laboratory test cycle takes 24 to 48 hours. By the time you know a salt spray failure is correlated to a conversion bath pH excursion, you have already produced four more coils from the same bath. Continuous process analytics at every stage of the CCL is not a luxury for high-volume operations. It is the only way to run a color coating line that consistently ships prime product at the quality levels that facade and automotive OEM supply chains now require.
Conclusion: The CCL Analytics Investment That Pays Back Before the Next Audit
The color coating line is a deceptively complex process system running at high speed, under tight quality tolerances, with a time-delay between process cause and quality effect that makes reactive management structurally insufficient. Coater head viscosity drift, oven PMT excursions, chemical treatment bath chemistry deviations, and color measurement anomalies are all detectable at the point of occurrence — but only if the data infrastructure to detect them is in place and actively correlated across the line. The prime yield losses that appear in the monthly quality report as "color deviations," "adhesion failures," and "film thickness exceedances" are administrative failures as much as they are process failures: the process data that would have enabled earlier intervention existed, but was not connected to the decision point where intervention was possible.
iFactory's CCL analytics platform addresses this data infrastructure gap directly — integrating coater head parameters, oven thermal profiles, chemical treatment bath chemistry, and color quality measurements into a single real-time analytics layer that connects cause to effect at the resolution and speed that CCL process control requires. For color coating operations supplying architectural, facade, and appliance markets where ΔE* tolerances are measured in tenths of a unit and adhesion requirements are specified in hours of salt spray exposure, this is not an optimization investment. It is a prime yield defense investment — and it pays back in paint savings, quality hold cost avoidance, and customer retention economics that most CCL operations have been absorbing as the cost of doing business without ever calculating the precise number.

-&-finishing-line-analytics.png)
