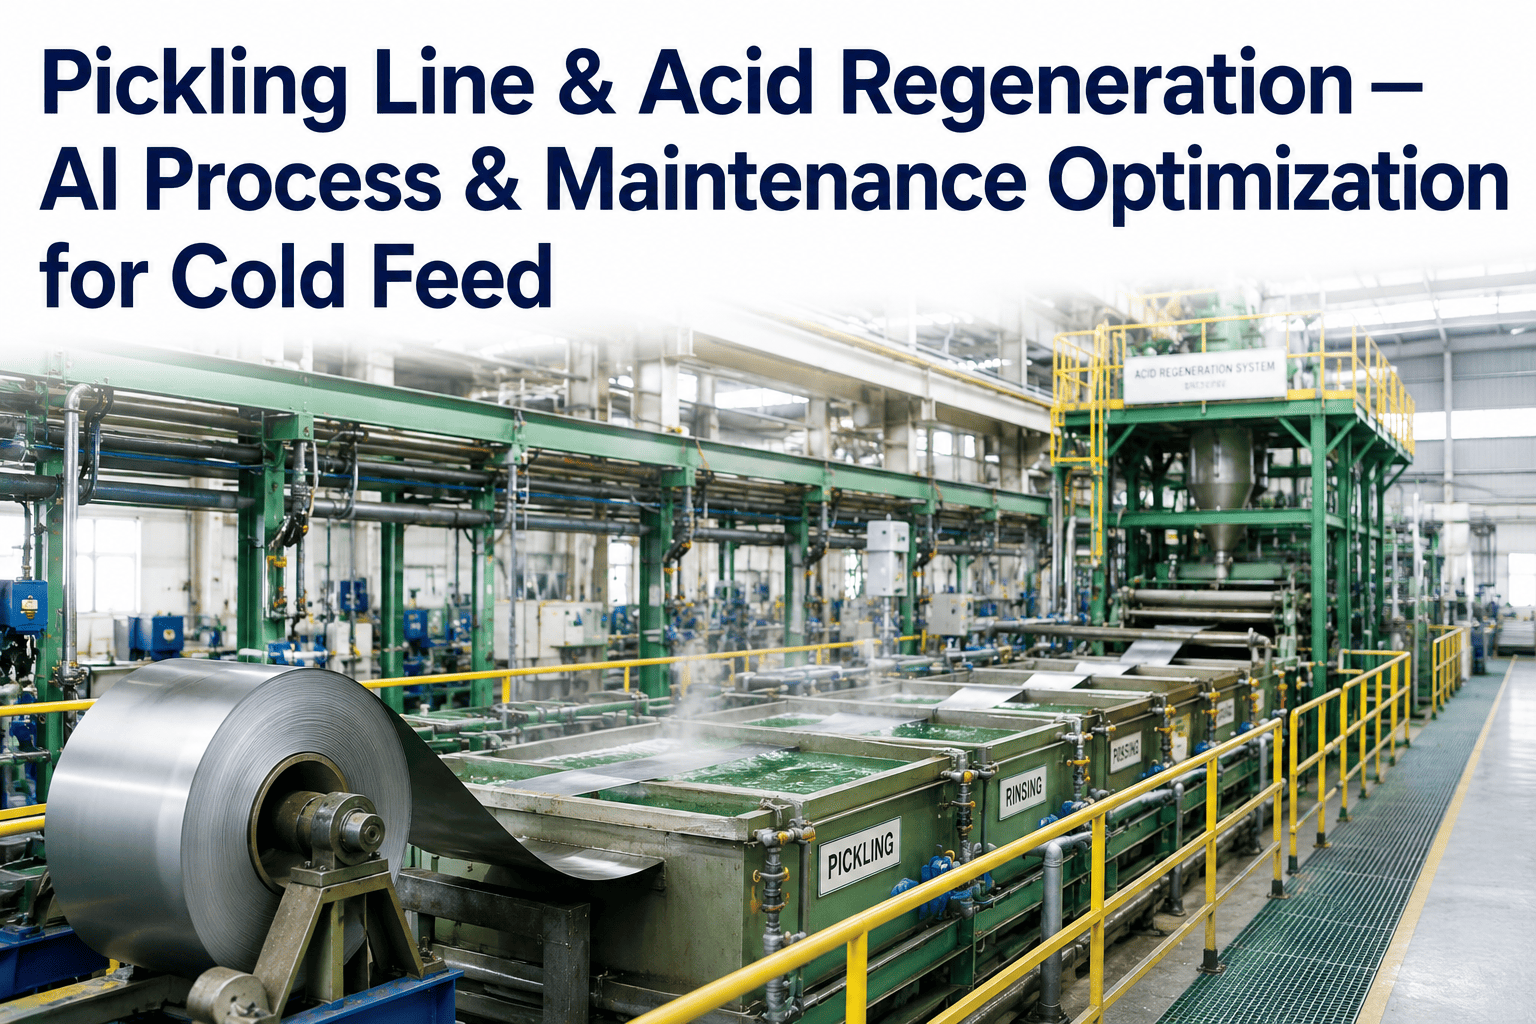
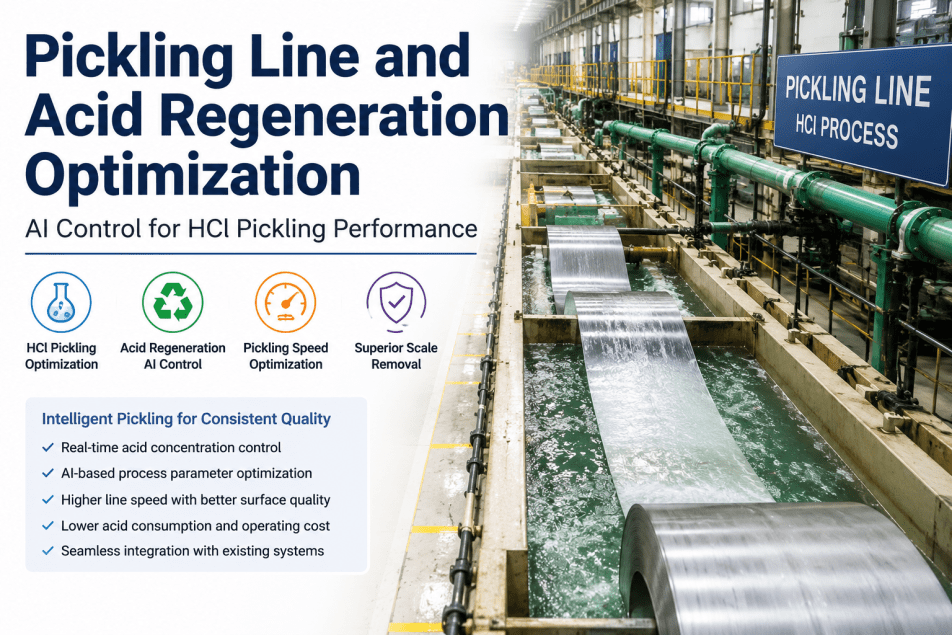
Pickling line operators have run acid concentration checks the same way for decades: pull a sample, titrate it, adjust the dosing pump, and hope the bath stays in range until the next sample. That approach worked when lines ran a narrow product mix at moderate speed, and it breaks down fast on a modern line running mixed grades at higher throughput, where a bath condition drifting between manual samples can produce a run of defective coils before anyone notices. AI-based process control closes that gap by predicting acid concentration and quality outcomes continuously instead of periodically, and lines ready to move past manual sampling can Book a Demo to see continuous prediction running on real production data.
PICKLING AUTOMATION · AI PROCESS CONTROL · QUALITY PREDICTION
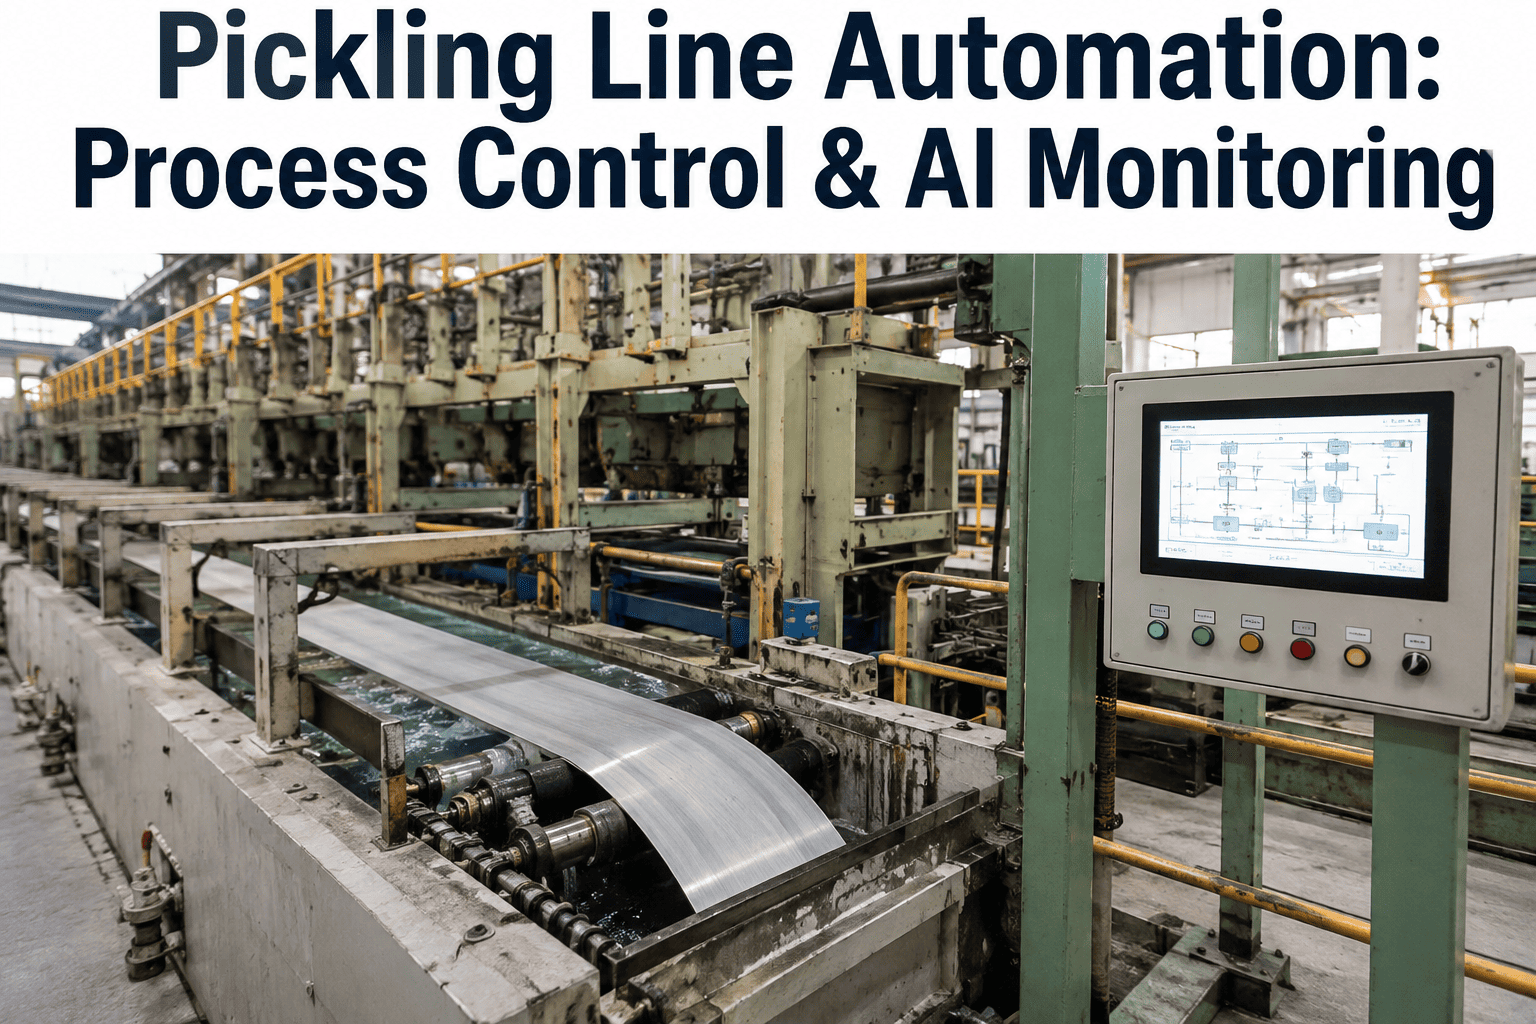
Pickling Line Automation: Process Control & AI Monitoring
How AI-driven acid concentration prediction, line speed optimization, and quality prediction move pickling lines from periodic manual sampling to continuous, self-correcting process control.
The Gap Between Manual Sampling and Continuous Reality
A titration sample tells the operator exactly one thing: what the acid concentration was at the moment the sample was drawn. Between samples — often thirty minutes to an hour apart on lines still running manual checks — concentration continues drifting as fresh strip consumes acid and as dosing systems compensate imperfectly. On a line processing coils continuously, that gap between samples is not a small blind spot; it is a window during which an entire coil, sometimes several, can pass through a bath condition nobody actually measured.
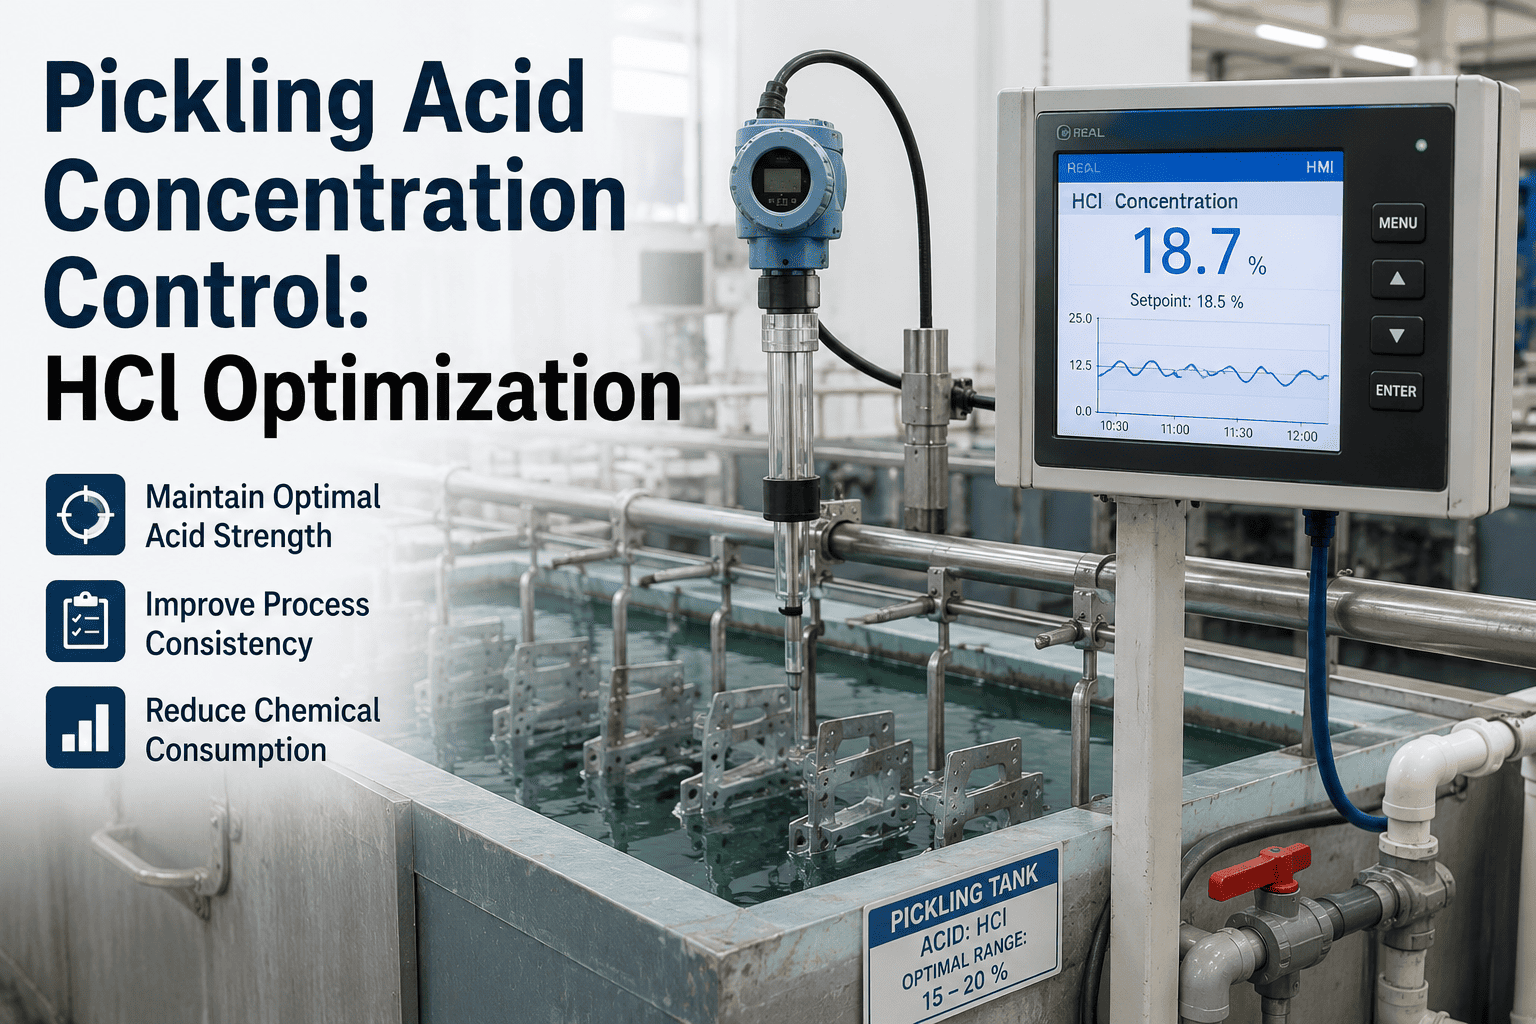
AI process control does not eliminate the physics of acid consumption, but it replaces the blind window with a continuous prediction built from the variables that are already being measured in real time — line speed, strip gauge and grade, dosing pump activity, temperature, and the most recent confirmed sample. The model predicts concentration between samples rather than assuming it stayed flat, and it flags the moment a predicted drift crosses the quality-risk threshold instead of waiting for the next scheduled sample to confirm what already happened.
Three Layers of AI-Driven Pickling Control
Mature pickling line automation is built in layers, each one adding a different kind of predictive control on top of the raw process data. Lines do not need to implement all three at once — most successful rollouts build bottom-up, starting with prediction and adding optimization and quality forecasting as the prediction layer proves reliable.
LAYER 01
Acid Concentration Prediction
A continuous model estimates bath concentration between physical samples using line speed, strip characteristics, dosing activity, and temperature as inputs, closing the blind window that periodic titration leaves open.
LAYER 02
Line Speed Optimization
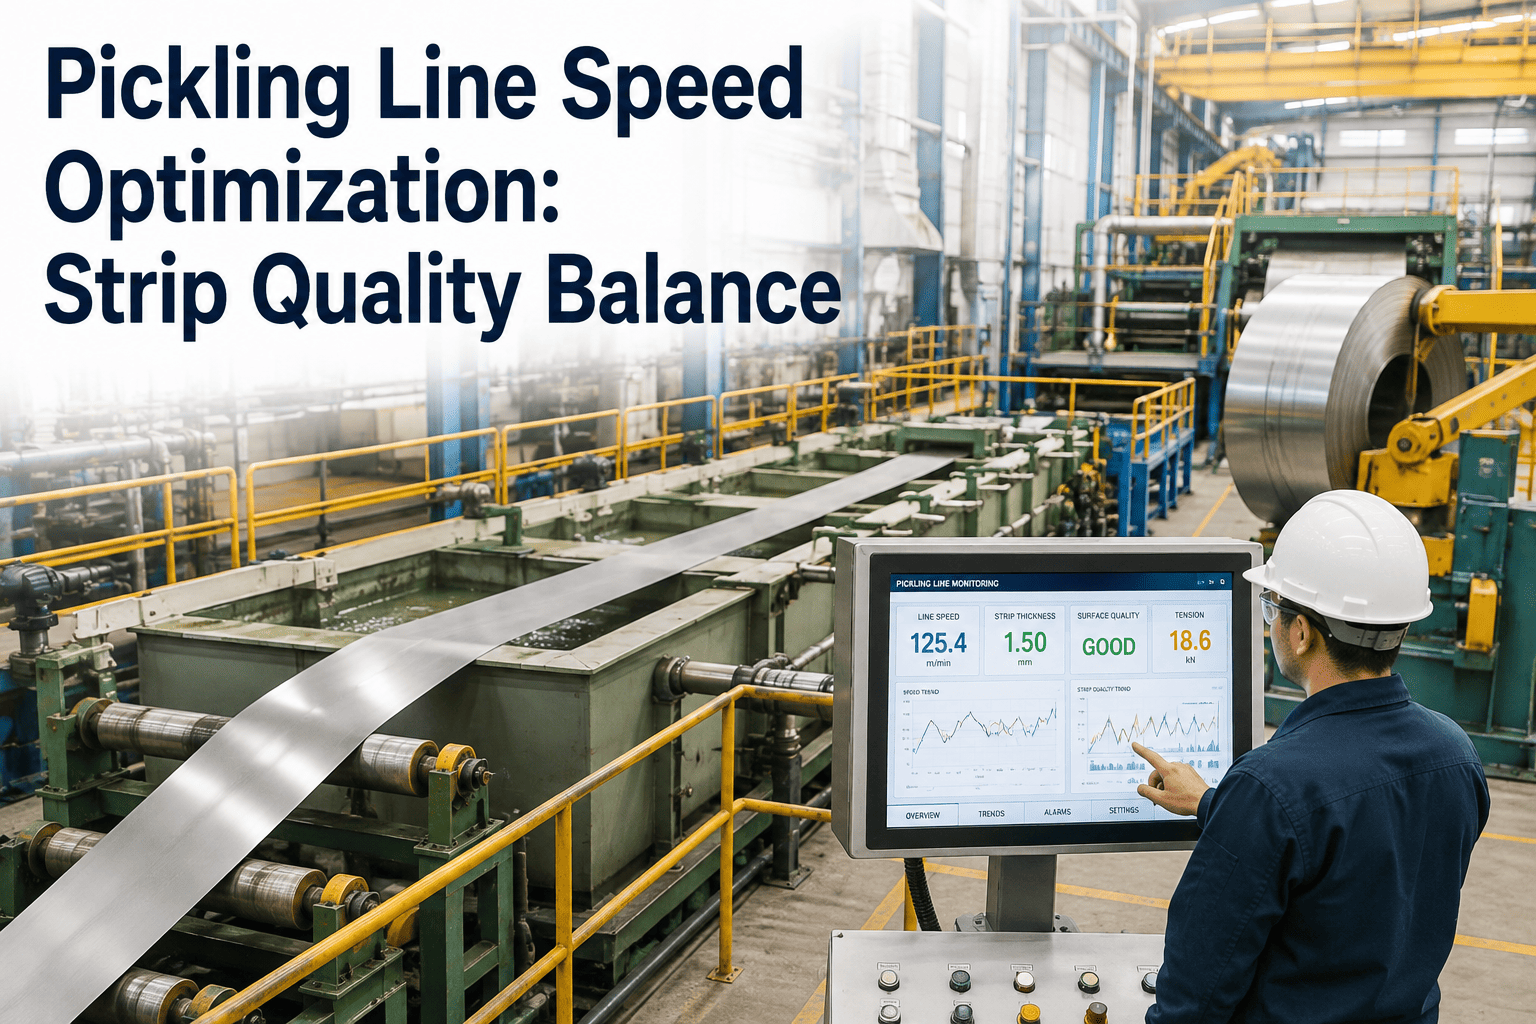
Once concentration is predicted continuously, line speed can be adjusted dynamically to hold the correct residence time as bath condition or strip grade changes, rather than running a fixed speed calibrated to worst-case conditions.
LAYER 03
Quality Outcome Prediction
Combining predicted concentration, actual speed, and temperature history for each coil produces a quality risk score before the coil reaches inspection, allowing pre-emptive hold or rework routing instead of a reactive catch.
AI PROCESS CONTROL · CONTINUOUS PREDICTION · PICKLING QUALITY
Replace the Blind Window Between Titration Samples
iFactory predicts acid concentration continuously between manual samples, flags drift before it produces a defect, and scores quality risk per coil before it ever reaches inspection.
Manual Sampling vs. Continuous AI Prediction
| Control Dimension | Manual Sampling | Continuous AI Prediction |
|---|
| Sample frequency | Every 30-60 minutes | Continuous, real-time |
| Drift detection lag | Up to a full sample interval | Near-immediate |
| Line speed basis | Fixed, worst-case calibrated | Dynamically adjusted |
| Defect catch point | Downstream inspection | Pre-inspection risk score |
| Operator workload | Manual titration and logging | Exception-based review |
| Coils affected by undetected drift | Often several per event | Minimized to detection window |
What Line Speed Optimization Actually Changes
Most pickling lines run a single fixed speed calibrated to handle the toughest scale condition and lowest acid concentration the line is expected to encounter, which means the line runs slower than necessary the majority of the time it is processing easier-to-pickle strip or operating with a fresh, high-concentration bath. Dynamic speed optimization inverts that logic: speed is set continuously based on the actual, predicted bath condition and strip characteristics for the coil currently in the line, running faster when conditions allow and automatically slowing when they do not.
The throughput gain from this alone is often substantial simply because fixed-speed calibration leaves so much margin on the table for the common case. But the quality gain is arguably more valuable — a line that only slows down when the predicted condition genuinely requires it produces far more consistent pickling quality across a shift than a line running one fixed speed regardless of how far bath condition has drifted from the calibration assumption.
Building the Quality Prediction Model: What Data It Needs
A useful quality prediction model is only as good as the process and outcome data it is trained on, and pickling lines building this capability for the first time typically need to assemble four categories of historical data before the model produces reliable predictions.
Process Parameter History
Acid concentration, temperature, line speed, and residence time logged per coil, ideally at a granularity fine enough to correlate with specific quality outcomes rather than shift averages.
Confirmed Quality Outcomes
Inspection results, defect classifications, and downstream quality holds tied back to the specific coil and its process trace, forming the labeled outcome data the model learns from.
Strip Characteristics
Grade, gauge, incoming scale condition, and any upstream processing history that affects how the strip responds to a given pickling condition.
Environmental & Bath Condition
Bath age, contamination level, and sludge accumulation, all of which shift the effective relationship between measured concentration and actual pickling performance over time.
Frequently Asked Questions: Pickling Line AI Automation
How accurate is AI-predicted acid concentration compared to a physical titration sample?
A well-trained prediction model, calibrated against a line's own titration history, typically tracks physical sample results closely enough to serve as a reliable continuous estimate between samples, though it is not intended to fully replace periodic physical verification. The practical value is not replacing titration outright but eliminating the blind window between samples, where the model flags meaningful predicted drift so the team can pull a confirming sample immediately rather than waiting for the next scheduled interval. Lines evaluating this can
Book a Demo to see prediction accuracy against their own historical sampling data.
Does dynamic line speed optimization require new hardware?
In most cases, no — line speed control is already automated on modern pickling lines through the existing drive system, and dynamic optimization works by changing the speed setpoint logic rather than replacing the physical drive hardware. The change is primarily in the control software layer, connecting the predicted process condition to the speed setpoint continuously instead of running a single fixed value.
How much historical data is needed before a quality prediction model becomes useful?
The amount varies by how much natural variation exists in the line's product mix and process history, but most lines need at least several months of coil-level process and outcome data covering a representative range of grades and conditions before the model produces dependable predictions. Lines with well-organized historical data can often bootstrap useful predictions faster than lines starting from fragmented or shift-level-only records, which is why data structure matters as much as data volume.
Can AI process control reduce acid consumption and chemical cost, not just improve quality?
Yes, and this is often an underestimated benefit. Continuous concentration prediction reduces the tendency to over-dose acid as a safety margin against uncertainty between samples, since the team has real-time visibility instead of guessing. Combined with dynamic speed optimization that avoids unnecessarily long residence times, lines commonly see a meaningful reduction in chemical consumption alongside the quality improvement, though the exact figure depends heavily on how conservatively the line was previously operated.
What is the first step for a line still running fully manual sampling?
The first step is establishing continuous data logging of the process parameters that already exist — line speed, temperature, dosing activity — even before any prediction model is built, because that logged history becomes the foundation the prediction layer trains on. Lines that try to implement AI prediction without first building this data foundation typically stall, since there is nothing for the model to learn from. Teams ready to start that data foundation can contact
iFactory Support for a structured rollout plan.
PICKLING AUTOMATION · AI MONITORING · QUALITY PREDICTION
Move From Periodic Sampling to Continuous Process Control
iFactory brings acid concentration prediction, dynamic speed optimization, and coil-level quality risk scoring onto one pickling line control view — built on the process data your line already generates.