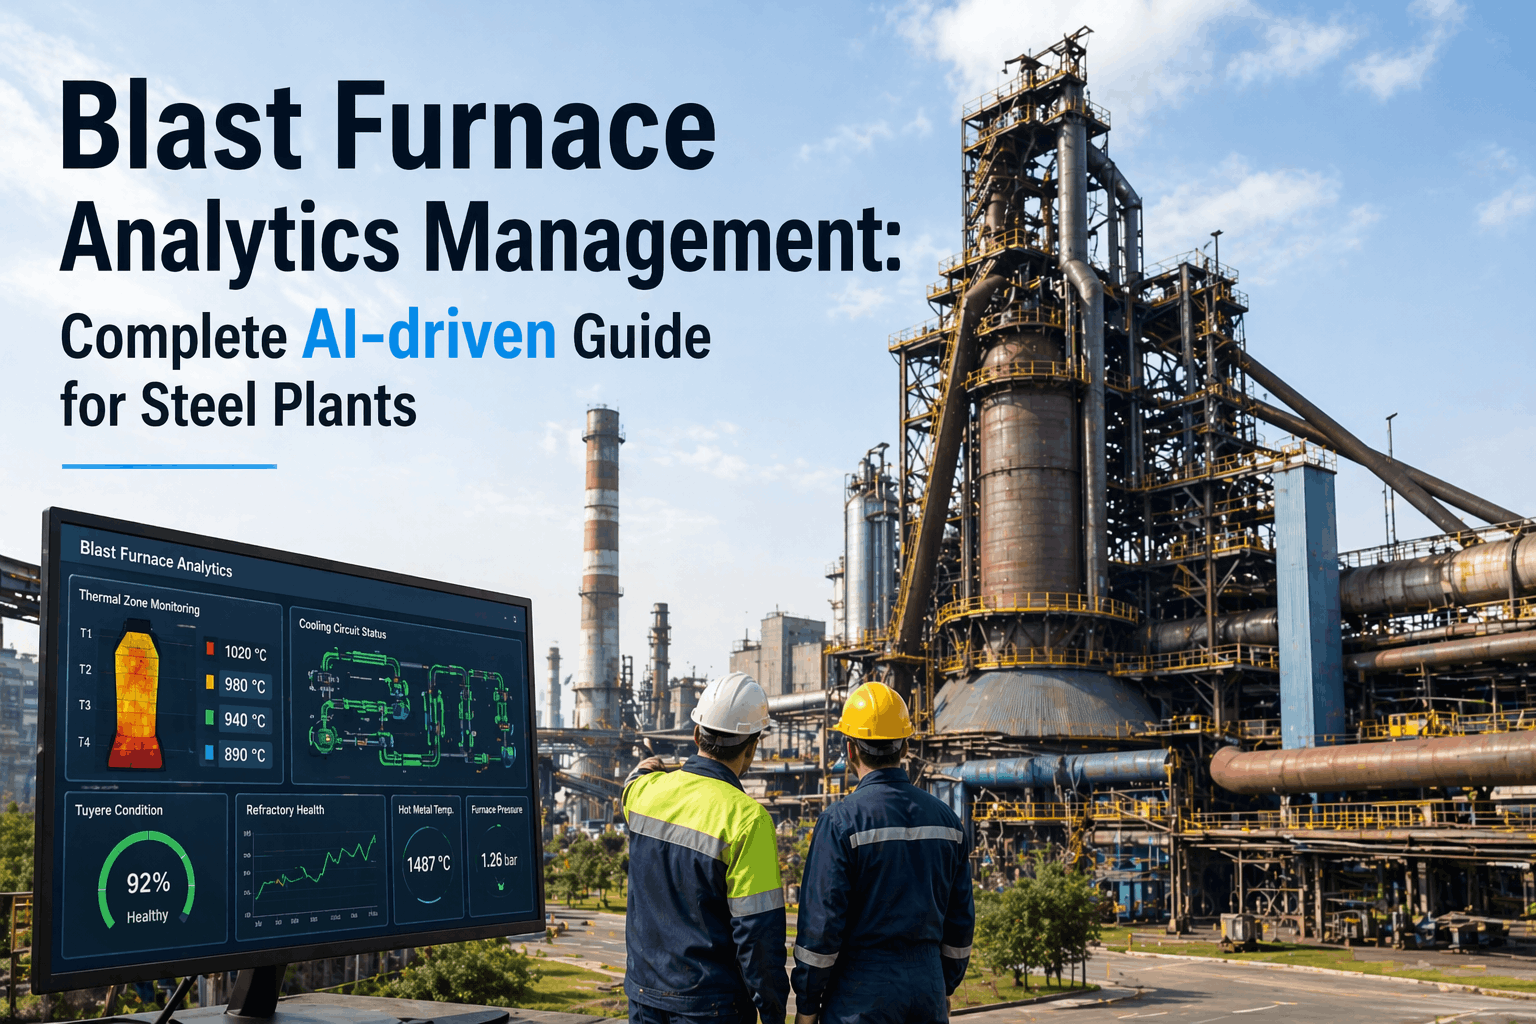
A blast furnace campaign is one of the largest capital commitments in steelmaking — a $15 to $40 million investment in refractory relining that must return 15 to 20+ years of continuous production before the next shutdown. For U.S. integrated steel operators, the difference between a campaign that runs to its designed life and one that requires an emergency reline at year 12 is not raw materials quality or operational skill. It is the quality and continuity of the monitoring program that tracks refractory wear, cooling system performance, hot blast stove condition, and tuyere integrity across every operating day of the campaign. Blast furnace analytics management is the discipline that connects the condition data generated by hundreds of thermocouples, flow meters, and pressure sensors into a coherent campaign management picture — identifying where the lining is thinning, which cooling staves are losing efficiency, and which operating parameters are accelerating wear before those trends reach the point of no recovery. iFactory's blast furnace analytics platform connects all of these data streams into a single campaign management system that gives operators and maintenance teams the lead time to intervene, adjust, and protect campaign life. Operations that have deployed iFactory's blast furnace analytics platform report campaign life extensions of 3 to 6 years and emergency reline avoidance savings averaging $8 to $22 million per campaign.
Why Blast Furnace Campaign Management Requires a Dedicated Analytics Framework
A blast furnace operating continuously at 2,300°F–2,700°F with a production rate of 3,000 to 10,000 tons of hot metal per day generates thermal, mechanical, and chemical stress on its refractory lining every operating hour. The lining wears — unevenly, in patterns driven by burden distribution, gas flow asymmetry, alkali attack, and thermal cycling — and that wear is measurable in the temperature gradients recorded by the thermocouple network. The problem for most U.S. blast furnace operations is not an absence of temperature data. It is the absence of an analytics system that interprets that data as a wear map, tracks the rate of change in wear over weeks and months, and generates specific intervention recommendations before the wear pattern reaches critical thickness.
The financial scale of what is at stake makes this analytics gap consequential. A planned campaign end and reline — scheduled based on accurate wear monitoring 18 to 24 months in advance — costs $15 to $40 million and results in a minimal production gap. An emergency reline triggered by unexpected breakthrough risk costs the same capital but adds $80 to $200 million in production loss and supply chain disruption over the 6 to 12 months required to restore full operating capacity. The return on a blast furnace analytics management system that prevents one emergency reline over a 20-year campaign is between 5× and 15× the total cost of the platform.
Refractory Wear Accumulation
Hearth and bosh lining wear accelerates in localized zones driven by thermal load distribution, alkali concentration, and cooling water efficiency. Without zone-level wear modeling, the thinnest point in the lining is invisible until it reaches emergency threshold.
Cooling System Degradation
Cooling staves and plate coolers protect the refractory by maintaining a frozen slag skull on the hot face. Stave degradation — reduced flow efficiency, fouling, or mechanical damage — removes that protection and accelerates local lining wear in ways that thermocouple readings alone cannot distinguish without delta-temperature analytics.
Hot Blast Stove Performance
Hot blast stove condition determines the blast temperature delivered to the furnace — which directly affects coke rate, production rate, and thermal load on the refractory. Stove checker brick fouling, burner degradation, and valve condition changes directly affect blast furnace campaign economics.
Tuyere and Blowpipe Condition
Tuyere leaks and blowpipe failures are among the most common unplanned blast furnace stoppages — each requiring a damping-down event that costs 24 to 72 hours of production and creates a thermal shock event that accelerates refractory wear in the affected bosh zone.
Refractory Monitoring: Building the Campaign Wear Map That Protects Your Reline Investment
Refractory condition monitoring is the foundation of blast furnace campaign management analytics. The goal is not simply to detect when the lining has reached emergency thickness — any thermocouple alarm system can do that. The goal is to build a continuous, quantified wear map of the entire furnace shell that shows where wear is occurring, how fast it is progressing in each zone, and when each zone will reach its minimum safe thickness at current wear rates. That time-to-minimum-thickness projection is the operational intelligence that allows planned campaign management decisions to replace reactive emergency responses. Book a Demo to see how iFactory builds that wear map for your furnace.
A modern blast furnace hearth thermocouple network includes 200 to 600 individual measurement points at multiple depths through the carbon block lining. iFactory integrates this full thermocouple dataset at 1-minute resolution, normalizes readings against furnace burden level, hot metal production rate, and blast parameters, and produces a cleaned, context-aware temperature dataset that eliminates the process-normal temperature variations that mask genuine wear signals in raw thermocouple streams. The normalization step is critical — a thermocouple reading that rises 15°C during a high-production period may be entirely normal; the same rise during normal production at that furnace position is a wear indicator. Without normalization, the two are indistinguishable.
Remaining lining thickness is estimated from the temperature gradient across the refractory cross-section using thermal conductivity models calibrated to the specific lining design and material properties. iFactory maintains a continuously updated lining thickness estimate for every thermocouple zone in the furnace, updated at each scan cycle. The thickness estimate is presented as a color-mapped wear chart — equivalent to a furnace cross-section showing wear depth at every monitored position — that gives furnace engineers an immediate visual picture of where the lining is thinnest and how the wear pattern has evolved over the past 30, 90, and 365 days.
For each monitored zone in the furnace, iFactory calculates the current wear rate — millimeters of lining loss per month — and projects the time at which the zone will reach the minimum safe thickness defined in the furnace's campaign management specification. This remaining campaign life projection, updated daily, is the central output of the blast furnace analytics system. It answers the question that campaign management decisions depend on: at current operating conditions, when does this furnace need to come down? The answer drives decisions about production rate adjustments, targeted skull management, grouting and shotcreting campaigns, and planned shutdown scheduling — all of which can extend the projected campaign life when implemented proactively rather than reactively.
The wear rate in any furnace zone is not constant — it varies with operating conditions. High pulverized coal injection rates increase raceway zone thermal load. Off-center burden distribution creates asymmetric gas flow patterns that concentrate wear in specific bosh segments. Alkali input from the burden chemistry accelerates lining dissolution in the lower stack and belly zones. iFactory's operational correlation engine continuously analyzes the relationship between operating parameters and wear rate changes, identifying which parameters are driving above-average wear in each zone — giving operators the specific operational adjustments (burden distribution correction, alkali management, injection rate optimization) that will reduce wear rate and extend campaign life.
| Furnace Zone | Primary Wear Mechanism | Key Monitoring Parameter | Warning Threshold | Campaign Management Action |
|---|---|---|---|---|
| Hearth Sidewall | Hot metal thermal erosion, alkali attack | Hearth TC temperature gradient | TC temp >150°C at deepest point | Production rate reduction, skull management |
| Hearth Bottom | Hot metal penetration, carbon dissolution | Bottom TC array, freeze-lining model | Estimated thickness <600mm | Titanium ore injection, tap practice review |
| Tuyere Zone / Bosh | Raceway thermal load, tuyere leak erosion | Bosh TC, tuyere cooling ΔT | Bosh TC >120°C sustained 48 hrs | Tuyere inspection, zone grouting |
| Belly / Lower Stack | Alkali attack, thermal cycling, abrasion | Stave delta-T, shell TC array | Stave ΔT increase >20% vs. baseline | Stave replacement scheduling, shotcreting |
| Upper Stack / Throat | Burden abrasion, gas flow erosion | Shaft TC, burden probe data | Asymmetric TC pattern >60°C differential | Burden distribution correction, bell gap check |
| Cooling Staves | Hot face erosion, rear crack development | Stave inlet/outlet ΔT, flow rate | ΔT deviation >15% from stave baseline | Stave replacement at next planned stop |
Cooling System Analytics: Protecting the Skull That Protects the Lining
The frozen slag skull on the hot face of the blast furnace lining is the primary protection mechanism that allows modern campaign lives to reach 15 to 20 years. The skull forms when cooling stave efficiency is sufficient to maintain a temperature gradient that freezes a protective layer of solidified slag against the refractory hot face. When stave efficiency degrades — through fouling of water-side passages, mechanical damage to copper staves, or loss of contact between stave and lining — the skull thins or disappears in that zone, and refractory wear rate accelerates dramatically.
Hot Blast Stove Analytics: Optimizing Blast Temperature While Protecting Campaign Economics
Hot blast stoves are the thermal engine that determines blast temperature — typically 1,100°C to 1,300°C for a modern high-productivity blast furnace — and blast temperature directly affects coke rate, hot metal production rate, and thermal load on the furnace refractory. Stove condition management is therefore both an energy efficiency concern and a campaign management concern: a stove delivering below-target blast temperature increases coke rate and refractory thermal stress simultaneously. A stove operating with degraded checker brick, leaking valves, or a deteriorating combustion system fails on both dimensions.
| Stove Parameter | Monitoring Method | Normal Range | Degradation Signal | Maintenance Trigger |
|---|---|---|---|---|
| Dome Temperature | Thermocouple — continuous | 1,300–1,400°C at end of heat | Progressive decline over 30 days at same fuel input | Checker brick thermal efficiency assessment |
| Blast Temperature Delivery | Bustle pipe TC — per blast cycle | Design ±15°C | Consistent shortfall >25°C vs. target | Combustion system and stove sequence review |
| Hot Blast Valve Leakage | Downstream TC deviation at closed valve | <5°C above ambient on cold side | >15°C above ambient sustained | Valve seat inspection and replacement |
| Cold Blast Valve Condition | Cycling count + actuator current | OEM cycle count limit | >80% of rated cycle count | Scheduled valve overhaul at next planned stop |
| Burner / Combustion Efficiency | Fuel flow, O₂ analyzer, dome TC rate-of-rise | Per stove combustion model baseline | Rate-of-rise decline >10% vs. baseline | Burner inspection, combustion analysis |
Tuyere and Blowpipe Analytics: Preventing the Stoppages That Shorten Campaign Life
Each tuyere entry point in the blast furnace bosh zone is a thermal weak point — a water-cooled copper tuyere stock exposed to raceway temperatures above 2,200°C, blast pressures up to 60 psi, and direct contact with pulverized coal and coke combustion products. Tuyere leaks are the most common cause of unplanned blast furnace damping-down events in U.S. integrated operations: each damping-down imposes a thermal shock cycle on the hearth refractory, creating a thermal gradient that accelerates refractory crack propagation and accelerates hearth wear rate. Tuyere analytics prevents these events by detecting the early signs of tuyere degradation — cooling water temperature anomalies, blast flow distribution asymmetries, and blowpipe thermal signatures — before they reach the leak and damping-down threshold.
Campaign Life Extension: The Four Operational Levers That Analytics Enables
Extending blast furnace campaign life from 15 to 18 or 20+ years is not achieved by passive monitoring. It requires active campaign management — making specific operational and maintenance decisions based on the wear intelligence that the analytics system provides. The four operational levers below are the standard toolkit for campaign life extension at the top-performing U.S. blast furnace operations. Each lever requires accurate, real-time wear data to apply effectively; without it, these interventions are applied on guesswork and produce inconsistent results.
| Campaign Extension Lever | Analytics Prerequisite | Typical Wear Rate Reduction | Campaign Life Extension | Cost vs. Emergency Reline |
|---|---|---|---|---|
| Titanium ore injection (hearth) | Hearth wear map showing accelerating sidewall erosion | 40–60% in treated zones | 12–36 months additional | $2–5M vs. $80–200M emergency reline |
| Production rate management | Zone-specific wear rate trending and remaining life model | 20–40% in constrained zones | 6–18 months additional | Partial production loss vs. full emergency shutdown |
| Targeted grouting and shotcreting | Shell TC and stave ΔT identifying worn zone boundaries | Restores zone to near-new condition | 18–36 months per intervention | $3–8M per campaign vs. unplanned reline premium |
| Burden distribution correction | Wear asymmetry pattern identified in TC array data | 30–50% reduction in asymmetric zones | 12–24 months additional | No direct capital cost — operational adjustment |
| Stave replacement (targeted) | Stave ΔT degradation identifying individual failed staves | Restores skull protection in affected zone | Prevents accelerating wear episode | $500K–$2M per stop vs. unplanned wear acceleration |
Expert Review: What Top-Performing U.S. Blast Furnace Operations Are Doing Differently
The blast furnaces in the U.S. that are consistently achieving 18 to 22 year campaigns — and reaching planned campaign end on schedule rather than responding to emergency wear events — share one practice that the underperformers do not: they treat the thermocouple and cooling system data as an operational management tool, not a safety alarm system. The distinction matters enormously. When your analytics program is designed to alarm when a thermocouple reaches a threshold, you are managing to a point of no return. When your analytics program is calculating wear rates and remaining campaign life for each zone every day, you are managing to an opportunity — an opportunity to take action 90, 180, or 360 days before the situation becomes irreversible. The operations that have made this transition share three specific capabilities. First, they have normalized their thermocouple data against operating conditions, so they are looking at genuine wear signals rather than noise from production rate changes. Second, they use the wear map to time their titanium ore injection and targeted repair interventions precisely rather than running fixed injection schedules that waste materials in zones that don't need it and miss zones that do. Third — and this is the one that most facilities still don't have — they have connected their wear analytics to their capital planning process. When the analytics says this furnace will need to come down in 30 months, the capital budget for the reline is committed in the current planning cycle. The facilities that avoid emergency relines are the ones where the analytics feeds directly into the financial decision that lets the maintenance organization prepare properly for a planned campaign end rather than scrambling in response to an unexpected one.
— Blast Furnace Campaign Management Benchmark Review, U.S. Integrated Steel Operations, iFactory Analytics Reference 2026Conclusion
Blast furnace campaign management analytics is the highest-ROI maintenance investment available to a U.S. integrated steel operation. A $15 to $40 million reline investment protected by a continuous analytics program that adds 3 to 6 years to campaign life generates $8 to $22 million in deferred capital cost per campaign — and that is before the production loss avoidance value of eliminating emergency damping-down events and unplanned repairs is counted. The technology to do this — thermocouple integration, thermal conductivity-based wear modeling, stave ΔT analytics, hot blast stove efficiency tracking — is mature and proven. The gap in U.S. blast furnace operations is not sensor coverage. It is the analytics layer that connects the sensor data to a continuously updated campaign management picture that maintenance teams, furnace engineers, and capital planning groups can act on.
iFactory's blast furnace analytics platform delivers that layer: a continuously updated wear map for every monitored zone in the furnace, zone-level remaining life projections that feed directly into campaign management decisions, cooling system analytics that protect the skull protecting the lining, and hot blast stove performance tracking that simultaneously optimizes blast temperature and coke rate. For U.S. blast furnace operations that are managing their campaigns on monthly average temperatures and periodic assessments rather than continuous wear intelligence, the cost of that gap accumulates every operating day — until the day it becomes an emergency reline.
Frequently Asked Questions
Remaining lining thickness is estimated from the temperature gradient across the refractory cross-section using Fourier's law of heat conduction and the known thermal conductivity of the specific lining material at operating temperature. When thermocouples are installed at multiple depths through the lining (typically at the hot face, mid-point, and cold face positions), the temperature gradient between them directly indicates the remaining material between the measurement point and the hot face. In single-depth installations — the most common configuration in older U.S. blast furnaces — the temperature at the single thermocouple position is compared against a thermal model of the lining cross-section that accounts for cooling water temperature, stave ΔT, and furnace thermal load to back-calculate the estimated remaining thickness at that position. The accuracy of this calculation is higher when the cooling system model is well-calibrated to the actual stave performance — which is why stave ΔT analytics and wear modeling are inseparable from refractory thickness estimation. iFactory calibrates the thickness model during initial deployment using any available campaign inspection data (drilling surveys, infrared tomography results) and updates the calibration after each planned maintenance stop inspection, continuously improving estimation accuracy throughout the campaign.
Campaign life extension of 3 to 6 years beyond the original design life is achievable for U.S. blast furnaces that implement a comprehensive analytics management program at campaign start and maintain it continuously. The extension comes from three specific mechanisms. First, early identification of wear acceleration in specific zones — which enables targeted operational adjustments (titanium ore injection, burden distribution correction, production rate management) before the wear reaches the point where it is self-reinforcing and accelerating beyond management. Second, precisely timed and located grouting and shotcreting interventions at planned maintenance stops, which restore worn zones to near-original thickness rather than allowing them to thin progressively between campaigns. Third, elimination of unplanned damping-down events driven by tuyere failures and cooling system incidents, each of which imposes a thermal shock cycle that permanently accelerates refractory wear rate in the hearth. For a furnace designed for a 15-year campaign, a well-managed analytics program typically achieves 17 to 21 years to planned campaign end. The deferred reline cost at $20 to $40 million per reline represents $4 to $16 million per extended year of campaign life — the highest ROI maintenance investment category in integrated steelmaking.
Titanium ore additions to the blast furnace burden generate titanium carbide (TiC) and titanium nitride (TiN) compounds in the hot metal at the hearth. These compounds, which have higher melting points than the surrounding iron, precipitate out of solution and deposit on the cooler surfaces of the hearth bottom and sidewall — forming a protective skull layer on the refractory hot face that reduces direct hot metal contact with the carbon block lining. The protective mechanism is proven and widely used in U.S. blast furnace operations: titanium injection at 0.05% to 0.10% Ti in hot metal (typically achieved with 8 to 15 kg of titaniferous ore per ton of hot metal) can reduce hearth wear rate by 40 to 60% in actively eroding zones. The critical management challenge is timing and targeting: titanium injection applied when the hearth wear map shows accelerating sidewall erosion in specific sectors is highly effective and economical. Titanium injection applied at a fixed background rate regardless of wear status is expensive — titaniferous ore costs $15 to $35 per ton above standard burden ore prices — and produces inconsistent protection because the Ti distribution in the hearth does not correspond to the zones that need protection. iFactory's hearth wear analytics identifies the specific wear acceleration events that justify targeted Ti injection campaigns, documents the wear rate response to each injection campaign, and optimizes the injection rate and duration based on actual hearth temperature response — converting Ti injection from a cost item into a quantified, ROI-positive intervention with each application.
Most U.S. blast furnaces with 10 or more years of operating history have sufficient existing instrumentation for iFactory to deliver meaningful campaign management analytics without any new sensor investment. The minimum viable sensor set for a first-phase deployment is the existing hearth thermocouple array (any coverage density, from 20 to 600 points), cooling water inlet and outlet temperatures for at least the hearth stave circuits, blast volume and pressure measurements, and hot blast temperature at the bustle pipe. From these data streams, iFactory can build the hearth wear map, track stave efficiency trends, and generate remaining campaign life projections for the hearth zone — which is the highest-consequence zone in terms of emergency reline risk. Upper shaft and bosh analytics benefit from additional thermocouple coverage and individual stave flow monitoring, but these are incremental improvements to a foundation that the existing instrumentation already supports. A typical Phase 1 deployment gap assessment identifies which additional sensor investments deliver the highest incremental value. For most furnaces, the priority additions are individual stave cooling flow meters (if not already installed), tuyere circuit ΔT instrumentation, and hot blast valve position monitoring — a total incremental sensor investment of $80,000 to $200,000 that significantly increases the resolution and accuracy of the analytics output. Full Phase 1 deployment including these additions is typically complete within 6 to 8 weeks of contract execution.
A full blast furnace analytics management system deployment for a single furnace with existing thermocouple and cooling system instrumentation runs $120,000 to $280,000 in total platform investment over a 6 to 10 week implementation timeline. The cost breakdown is approximately: historian and SCADA integration for thermocouple, cooling system, and blast system data ($25,000 to $60,000), iFactory platform configuration including wear model calibration, stave ΔT baseline establishment, and hot blast stove efficiency model ($50,000 to $100,000), campaign management dashboard and work order automation configuration ($25,000 to $60,000), and training and commissioning including furnace engineer and maintenance team onboarding ($20,000 to $60,000). Incremental sensor hardware (individual stave flow meters, tuyere ΔT instrumentation) adds $80,000 to $200,000 where required. The ROI model for this investment is built on two primary value streams: campaign life extension (3 to 6 years at $20 to $40 million reline cost deferred = $4 to $13 million per extended year) and avoided unplanned damping-down events (typically 2 to 4 avoided per year at $500,000 to $2 million per event = $1 to $8 million per year). Total year-one ROI — before campaign life extension credit, which accrues over the full extended campaign period — is typically 5× to 15× the platform investment from damping-down avoidance and optimized titanium ore injection savings alone. The full campaign life extension value represents a 40× to 100× return on the platform investment over the campaign period.