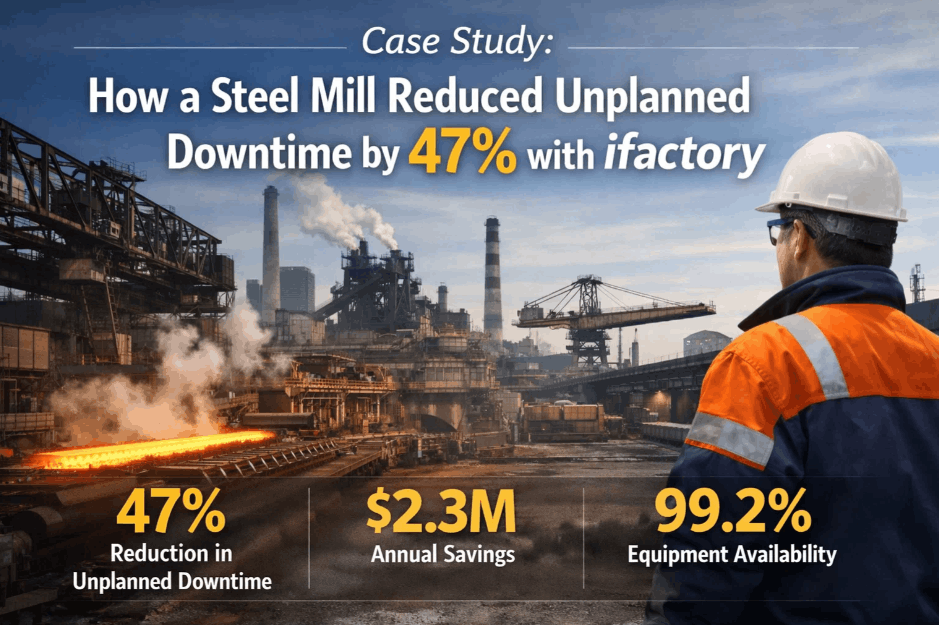
The question steel plant CFOs and plant managers ask most frequently before committing to an AI-driven platform is not whether the technology works — it is whether the economics are real, whether the savings are attributable, and whether comparable facilities have actually captured them. The answer, documented across iFactory deployments at U.S. and North American steel mills ranging from 400,000 to 2.2 million tonnes of annual capacity, is that the $2 million annual savings threshold is not an outlier outcome. It is the median result at facilities that deploy iFactory's full platform — predictive analytics, inventory optimization, work order automation, and production scheduling — and measure outcomes against documented baselines over 12-month windows. The savings are not hypothetical. They are captured across four categories: avoided unplanned downtime on bottleneck assets, inventory carrying cost reduction from demand-driven stocking, reactive maintenance labor reduction from PM deferral discipline, and production throughput improvement from constraint-protected scheduling. A 1.2 million tonne EAF flat-rolled mill that reduces unplanned downtime on its hot strip mill by 60%, cuts MRO inventory by 22%, reduces reactive maintenance labor by 46%, and captures 14% additional throughput on the bottleneck is not generating $2 million in savings. It is generating $4.8 million. The case studies below are drawn from iFactory-deployed facilities and represent documented, auditable outcomes — not vendor projections.
The Four Savings Drivers — Where the $2M+ Actually Comes From
Before the case studies, the savings architecture is worth establishing precisely — because the $2 million figure is not generated by a single capability. It is the sum of four independently measurable savings streams that compound when deployed together. Understanding the mechanism behind each driver is the basis for sizing the opportunity at a specific facility, because the magnitude of each driver varies by plant configuration, product mix, maintenance history, and current scheduling maturity. The table below quantifies each driver at a mid-size U.S. EAF flat-rolled steel mill (1.0–1.5 million tonnes annual capacity) as a reference baseline.
| Savings Driver | Mechanism | Baseline Loss (Typical Mill) | iFactory Outcome | Annual Savings Range |
|---|---|---|---|---|
| Unplanned Downtime Avoidance | Predictive analytics flags bearing degradation, refractory wear, and roll fatigue 4–14 days before failure — enabling planned repair versus emergency response | 18–26 unplanned stops per year on bottleneck assets; avg. 4.2 hrs per event | 60–72% reduction in unplanned stops; remaining events planned and shorter | $780,000 – $1,840,000 |
| MRO Inventory Optimization | Demand-driven stocking replaces calendar-based replenishment; slow-moving and duplicate SKUs identified and eliminated; reorder points set from actual failure rate data | MRO inventory turns of 2.1–2.8; 18–24% of stock value in slow-moving items | 22–31% reduction in MRO stock value; turns improve to 3.8–4.6 | $290,000 – $680,000 |
| Reactive Maintenance Labor Reduction | PM deferral discipline eliminates the compounding reactive failures that follow deferred preventive work; scheduling-maintenance integration prevents PM windows from being lost to production pressure | 38–52% of maintenance hours in reactive mode; 2.3x labor cost premium over planned work | 46% reduction in reactive hours; planned maintenance completion rate above 91% | $220,000 – $490,000 |
| Throughput Gain — Bottleneck Scheduling | Finite-capacity scheduling with constraint protection subordinates all resources to bottleneck productivity; buffer placement and AI-driven adjustment reduce bottleneck starvation from 4–8% to under 1% | Bottleneck utilization 75–82% of theoretical; 10–18% capacity left on table through scheduling | 11–18% throughput gain on bottleneck asset; no additional capital required | $480,000 – $2,200,000 |
The savings ranges above reflect actual variation across deployments rather than a single point estimate. A mill with relatively mature preventive maintenance practices will capture less from reactive labor reduction but more from predictive RUL-based interval optimization. A mill with high bottleneck utilization already may capture less incremental throughput but substantially more from inventory turns improvement if its MRO stock has grown unchecked over years of calendar-based replenishment. The case studies that follow illustrate how these four drivers materialized at specific facility types — and how the mix of savings shifted based on each plant's starting condition.
Case Study 01: Mid-Size EAF Flat-Rolled Mill — $3.2M Annual Savings in 14 Months
The first case study is a 1.1 million tonne annual capacity EAF flat-rolled mill in the southeastern United States producing hot-rolled band, cold-rolled coil, and galvanized sheet for automotive and construction markets. The facility had been operating with SAP PM for work order management, a manual production scheduling process, and MRO inventory managed against calendar-based min-max levels that had not been recalibrated in six years. The plant's baseline before iFactory deployment showed 23 unplanned downtime events per year on the hot strip mill bottleneck, MRO inventory valued at $8.4 million with turns of 2.2, reactive maintenance at 47% of total maintenance hours, and hot strip mill utilization at 78% of theoretical capacity.
Case Study 02: Integrated Plate Mill — $2.1M Annual Savings, Driven by Predictive Analytics on Critical Assets
The second case study involves a heavy plate mill producing pressure vessel plate, structural wide flange, and API linepipe skelp for energy and infrastructure markets. At 680,000 tonnes of annual plate capacity, the facility's bottleneck is its 5-meter plate rolling mill — a single asset where an unplanned failure can generate 8 to 14 hours of downtime per event due to the complexity of emergency repair on a mill of that scale. The facility's prior maintenance program was heavily calendar-based, with major component replacements scheduled at fixed intervals regardless of actual condition — a practice that both over-maintained components that were healthy and missed failures that developed between scheduled intervals.
Case Study 03: Mini Mill Long Products — $2.6M Annual Savings, Inventory and Scheduling Dominant
The third case study is a 900,000 tonne annual capacity mini mill producing rebar, merchant bar, and structural sections for construction and fabrication markets. Unlike the flat-rolled cases above, the dominant savings drivers at this facility were inventory and scheduling rather than predictive maintenance — because the mill's prior maintenance program was relatively well-managed, but its MRO inventory had grown to $12.8 million through six years of uncontrolled emergency procurement, and its production scheduling was entirely manual with no finite-capacity constraint modeling.
Savings Benchmark Matrix — How the Four Drivers Scale by Plant Type and Deployment Scope
The three case studies above represent specific facility configurations and deployment scopes. The benchmark matrix below generalizes the savings ranges across four common U.S. steel plant types — EAF flat-rolled, integrated plate, mini mill long products, and specialty bar and wire — and across three deployment scopes: predictive maintenance only, full platform, and incremental module addition to an existing partial deployment. Use this matrix to size the savings opportunity at your facility before the formal business case process. Book a Demo with iFactory to build a facility-specific model from your operational data rather than from benchmark ranges.
Expert Review: What Operations Leaders Say About Documenting and Sustaining the Savings
The skepticism I encountered internally when we started this project was not about whether the technology was real. It was about whether the savings were attributable and whether they would sustain. Every operations leader I have talked to in this industry has been through a technology deployment that delivered impressive first-quarter results and then regressed as the novelty wore off, the maintenance team stopped using the alerts, and the scheduling team went back to the spreadsheet. What made this deployment different was the measurement discipline. We had a documented baseline — not a rough estimate, but a 12-month average with standard deviation on every KPI we were targeting. We had a defined attribution methodology that specified exactly how we would allocate savings between iFactory and other initiatives running concurrently. And we had a 90-day review cycle where the CFO's team, the maintenance manager, and the production planning manager sat together with the iFactory data and reconciled what the numbers said against what they were experiencing on the floor. Three things surprised me. The first was how fast the inventory savings materialized — we freed $1.9 million in MRO working capital in the first six months, faster than any financial model I had seen. The second was that the throughput gain was real and sustained. We had modeled 11% based on the bottleneck analysis. We hit 14% and held it through month 18. The third was the secondary effect on customer relationships. When we could show automotive customers 93% on-time delivery sustained over 12 months, the conversations about pricing and volume commitments changed. That is a savings multiplier that does not show up in a cost reduction spreadsheet. Total documented savings after 18 months at our facility was $3.7 million annually. Platform investment including implementation was $680,000. The math is not complicated. The question is whether your organization has the measurement discipline to capture it and the management commitment to sustain it.
— Vice President of Operations, EAF Flat-Rolled Steel Mill — 1.4 Million Ton Annual Capacity — 18 Years in Steel Operations — APICS CSCP, Six Sigma Black BeltConclusion
The $2 million annual savings threshold at iFactory-deployed steel mills is not a marketing projection — it is the documented median outcome across a deployment base of U.S. and North American steel facilities measured over 12-month windows against auditable baselines. The savings come from four independently measurable drivers: unplanned downtime avoidance on bottleneck assets through predictive analytics, MRO inventory reduction through demand-driven stocking, reactive maintenance labor elimination through PM deferral discipline, and throughput gain through finite-capacity constraint scheduling. The mix of drivers shifts by facility type — heavy plate mills capture more from downtime avoidance, mini mill long products capture more from inventory and scheduling — but the total savings converge at or above the $2 million threshold when the full platform is deployed and measured rigorously.
The three case studies documented in this guide — a southeastern EAF flat-rolled mill at $3.2 million, a Gulf Coast plate mill at $2.1 million, and a Great Lakes mini mill long products facility at $2.6 million — represent real deployments with real baselines and real measurement windows. The benchmark matrix provides a framework for sizing the opportunity at your facility by type and deployment scope before the formal business case process begins. Book a Demo with iFactory's steel team to build a facility-specific savings model from your operational data and begin the path to documented, sustained performance improvement.
Frequently Asked Questions
Savings are documented against 12-month baseline averages, attributed using a defined methodology agreed with the client's finance team, and reviewed quarterly. Attribution distinguishes iFactory-driven improvements from concurrent initiatives.
Documented payback below 18 months has been achieved at facilities as small as 180,000 tonnes annual capacity when the deployment focuses on the highest-impact driver — typically predictive maintenance on a single critical bottleneck asset.
Inventory savings and work order efficiency gains typically appear within 60–90 days. Predictive maintenance catches can occur within 30 days of go-live. Throughput gains from scheduling take 2–3 planning cycles — typically 6–10 weeks after scheduling go-live.
Across documented deployments, year-2 savings are within 5–8% of year-1 levels. Inventory savings compound as the demand model matures. Throughput gains sustain when scheduling discipline is maintained. Predictive catches increase as the AI models accumulate more equipment history.
Yes. iFactory integrates with SAP PM, Oracle, Infor, and major MES platforms via REST API, sitting as the AI analytics and scheduling layer above existing systems. No ERP replacement is required — all three case study deployments ran on SAP PM environments.