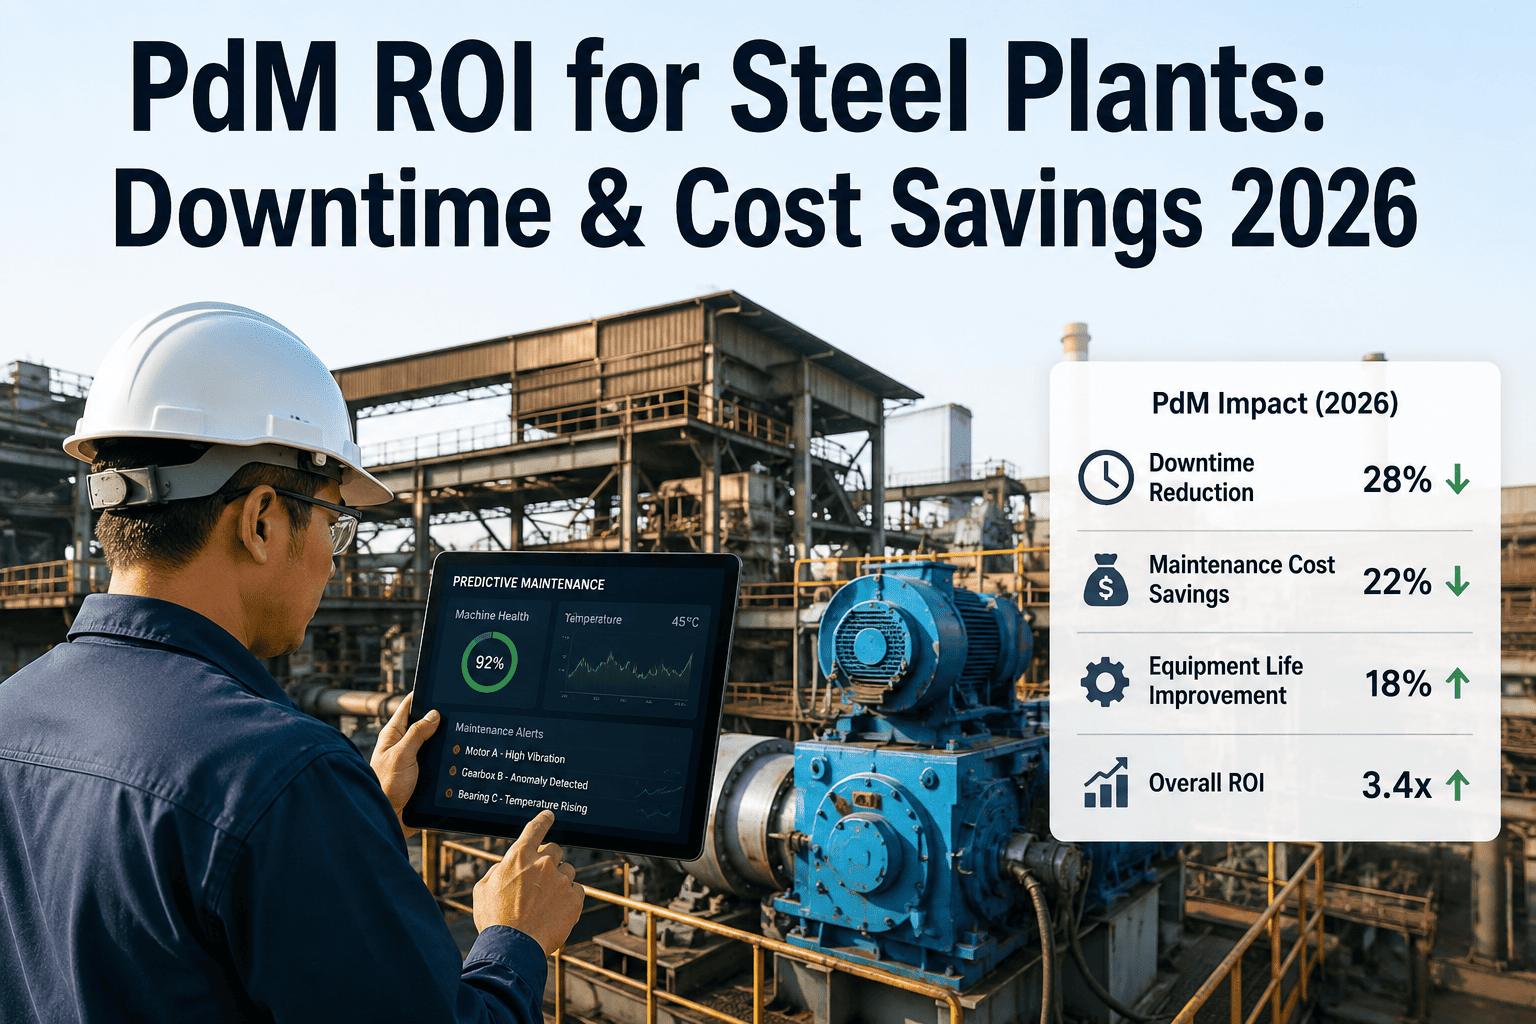
Every steel plant reliability team eventually has to answer the same question from finance: what do we actually get back for the money we spend on predictive maintenance. It is a fair question, and it deserves a better answer than a vague promise of "fewer breakdowns." The real ROI case comes from three specific, measurable levers: downtime avoided, maintenance spend reduced, and production capacity recovered, each of which can be quantified against your plant's own cost structure rather than a generic industry claim. iFactory's platform is built to make that case concrete from the first quarter of deployment, and you can book a demo to see the ROI model built around your own plant's numbers.
The Business Case for Predictive Maintenance Is Not About Technology. It Is About Three Numbers.
Downtime cost avoidance, maintenance cost reduction, and production increase are the three levers that make predictive maintenance pay for itself, often within the first year. iFactory helps you quantify each one against your own plant's real cost structure.
Unplanned Downtime Is Not a Line Item. It Is a Structural Drag on Margin.
The steel industry as a whole spends billions of dollars annually on unplanned downtime, representing a meaningful share of total operating costs across integrated and electric arc furnace mills worldwide. That figure is not evenly distributed: plants still running on calendar-based preventive maintenance carry a disproportionate share of it, because fixed-interval schedules either intervene too early, wasting money replacing parts that still have useful life remaining, or too late, after a failure has already begun and turned a planned repair into an emergency one. In a facility running continuous production around the clock, that asymmetry between planned and unplanned maintenance cost is far larger than in batch manufacturing, since every hour of unplanned downtime in a steel plant can represent well over a million dollars in lost production value, a number that dwarfs the cost of almost any maintenance investment measured against it.
Where the Return Actually Comes From
ROI models that treat predictive maintenance as a single number miss the structure of where the value actually comes from. Each of the three levers below behaves differently and should be tracked separately, since they respond to different aspects of the program at different speeds.
Downtime Cost Avoidance
The largest and fastest-moving lever. Every prevented unplanned stoppage avoids the full cost of lost production, expedited parts, and overtime labor associated with an emergency repair.
Maintenance Cost Reduction
Fewer emergency repairs at premium cost, less unnecessary preventive replacement of parts that still have useful life, and better-planned labor scheduling compound over time.
Production Increase
Recovered uptime translates directly into additional tonnes produced against fixed capital and labor costs, often the largest long-run contributor to total ROI.
Spare Parts Optimization
Reduced expediting costs and right-sized inventory levels free working capital that would otherwise sit idle in safety stock built to cover uncertain failure timing.
Stop Justifying PdM With Industry Averages. Build the Case With Your Own Numbers.
iFactory helps reliability teams quantify downtime avoidance, cost reduction, and capacity recovery against their plant's actual production and cost data.
The Same Repair Costs Three to Five Times More When It Is Not Planned
A bearing replaced during a scheduled roll change requires the cost of the part, a few hours of labor, and minimal disruption to the production schedule since the line was already stopped for the change. The same bearing failing unpredictably mid-campaign triggers a completely different cost structure: an unplanned line stop measured in hours rather than minutes, an emergency parts order that frequently costs several times the standard procurement price if the part is not already in stock, overtime labor to execute the repair as fast as possible, and often collateral damage to adjacent components that were starved of proper lubrication or cooling during the failure event. This asymmetry between planned and emergency maintenance cost is the single largest driver of predictive maintenance ROI, and it is why the ROI case for PdM in a steel plant tends to be stronger than in almost any other manufacturing sector: the cost gap between planned and unplanned work is unusually wide, and the production consequence of a stoppage is unusually severe given the continuous, capital-intensive nature of steel operations.
Reliability teams that have modeled this gap carefully typically find that a single avoided unplanned event pays for a meaningful share of an entire year's predictive maintenance platform investment, which is why the strongest ROI arguments do not lead with an aggregate downtime percentage but instead walk through two or three specific historical failure events and calculate what the same failure would have cost if it had been caught and scheduled in advance instead. This event-by-event framing tends to land far better with finance stakeholders than an abstract industry benchmark, because it ties the investment directly to incidents the plant has actually experienced and can verify against its own maintenance records.
How the ROI Curve Typically Builds Across a 12-Month Deployment
Predictive maintenance ROI does not arrive all at once, and expecting it to can set a program up to look like it is underperforming in its early months when in fact it is following a normal and well-documented curve. iFactory structures deployments to generate measurable value at each phase rather than asking a plant to wait a full year before seeing any return.
| Phase | Timeline | Primary Value Driver | Typical Outcome |
|---|---|---|---|
| Foundation | Months 1-3 | Digital work orders, baseline data capture | Visibility into true maintenance spend and event history |
| Early detection | Months 3-6 | Highest-criticality asset monitoring live | First avoided failures on AGC, caster, and furnace assets |
| Scale-up | Months 6-9 | Coverage expanded plant-wide | Maintenance cost trending down as emergency repairs decline |
| Optimization | Months 9-12 | Prescriptive recommendations, spares tuning | Full ROI realized, funding Phase 2 investment from savings |
What Steel Plants Report After Twelve Months of Predictive Maintenance
These figures reflect outcomes reported by integrated and electric arc furnace plants after a full year of predictive maintenance deployment across critical rolling, casting, and furnace assets.
What Finance Actually Wants to See Before Approving the Investment
Reliability engineers often build a technically sound case for predictive maintenance that still fails to secure budget approval, not because the underlying argument is wrong but because it is presented in terms finance stakeholders cannot easily evaluate against competing capital requests. The strongest business cases translate technical benefits directly into the same financial language used to evaluate every other investment the plant is considering: payback period, net cost avoidance per year, and risk-adjusted downside if the investment underperforms. iFactory's team works with reliability engineers to build this case using the plant's own historical downtime and maintenance cost records rather than generic industry figures, which produces a more conservative but far more credible number that survives scrutiny from a finance committee that has seen inflated technology ROI claims before and is understandably skeptical of them.
Questions Plant Leadership Asks About Predictive Maintenance ROI
How quickly can we expect to see a measurable return after starting deployment?
Most plants see their first quantifiable avoided-downtime event within the first three to six months, once the highest-criticality assets are fully instrumented and the platform has built enough baseline data to detect genuine deviations reliably. Full-year ROI typically compounds from there as coverage expands and maintenance cost trends start declining. Book a demo to build a phased timeline specific to your critical asset list.
How do we calculate the cost of an hour of unplanned downtime for our own plant?
The most reliable approach combines lost production value at your actual product mix and margin, plus the incremental cost of expedited parts and overtime labor typically incurred during an emergency repair, plus any downstream scrap or rework caused by the stoppage. iFactory's team helps reliability engineers build this figure from your plant's own historical downtime records rather than relying on an industry average that may not reflect your specific product mix. Contact our support team for a downtime cost calculation worksheet.
Does the ROI case still hold up if we already have some preventive maintenance in place?
Yes, and in fact plants with a mature preventive maintenance program often see a faster ROI curve because the underlying maintenance data is already organized and the primary value shifts toward reducing unnecessary preventive replacements of parts that still have useful life, alongside catching the failure modes that fixed-interval schedules inherently miss. Book a demo to see how predictive maintenance layers onto an existing preventive program.
What is the biggest risk that a predictive maintenance investment underperforms its projected ROI?
The most common cause of underperformance is scope creep without prioritization, attempting to instrument every asset in the plant simultaneously rather than starting with the highest-consequence equipment where the ROI case is clearest and fastest to prove. Plants that phase deployment by asset criticality consistently see stronger and faster returns than those that spread initial investment too thin across low-priority equipment. Contact our support team for guidance on prioritizing your first monitoring phase.
How does iFactory help us present this business case internally?
iFactory's team works directly with reliability engineers to build a plant-specific ROI model using your own historical downtime and maintenance cost data, structured in the payback period and net cost avoidance terms that finance stakeholders evaluate every other capital request against, rather than a generic vendor-provided industry statistic. Book a demo to start building your plant's specific business case.
Build a ROI Case Finance Will Actually Approve
iFactory turns your plant's own downtime and maintenance cost history into a credible, phased financial model. Book a demo and see the numbers built around your operation.