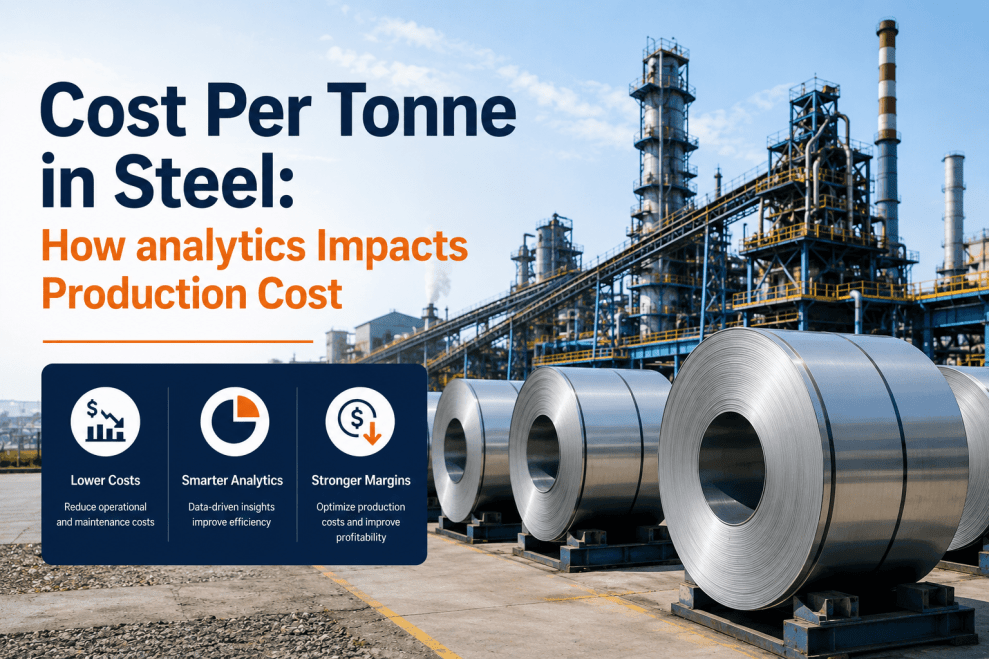
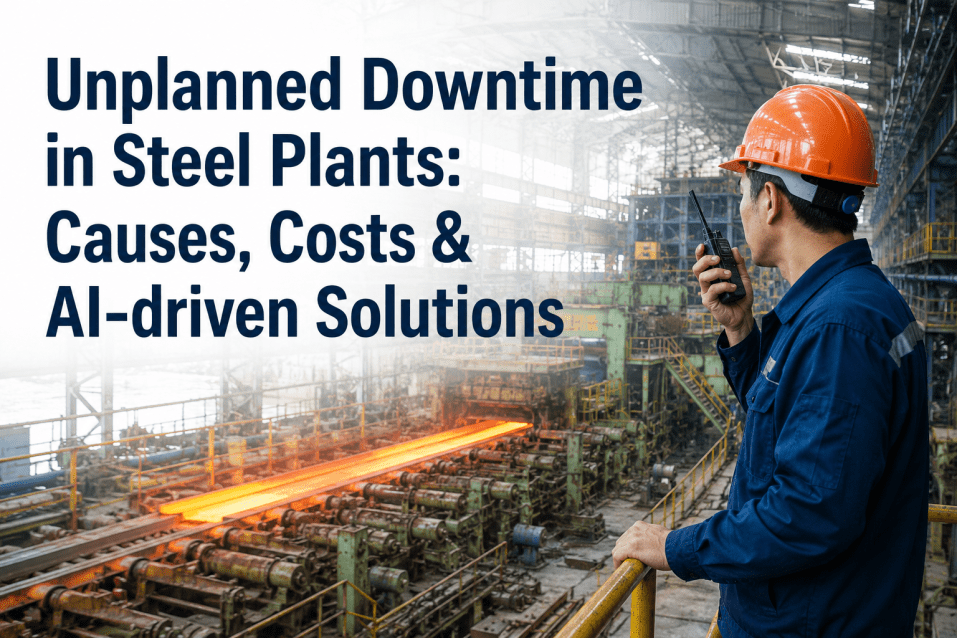
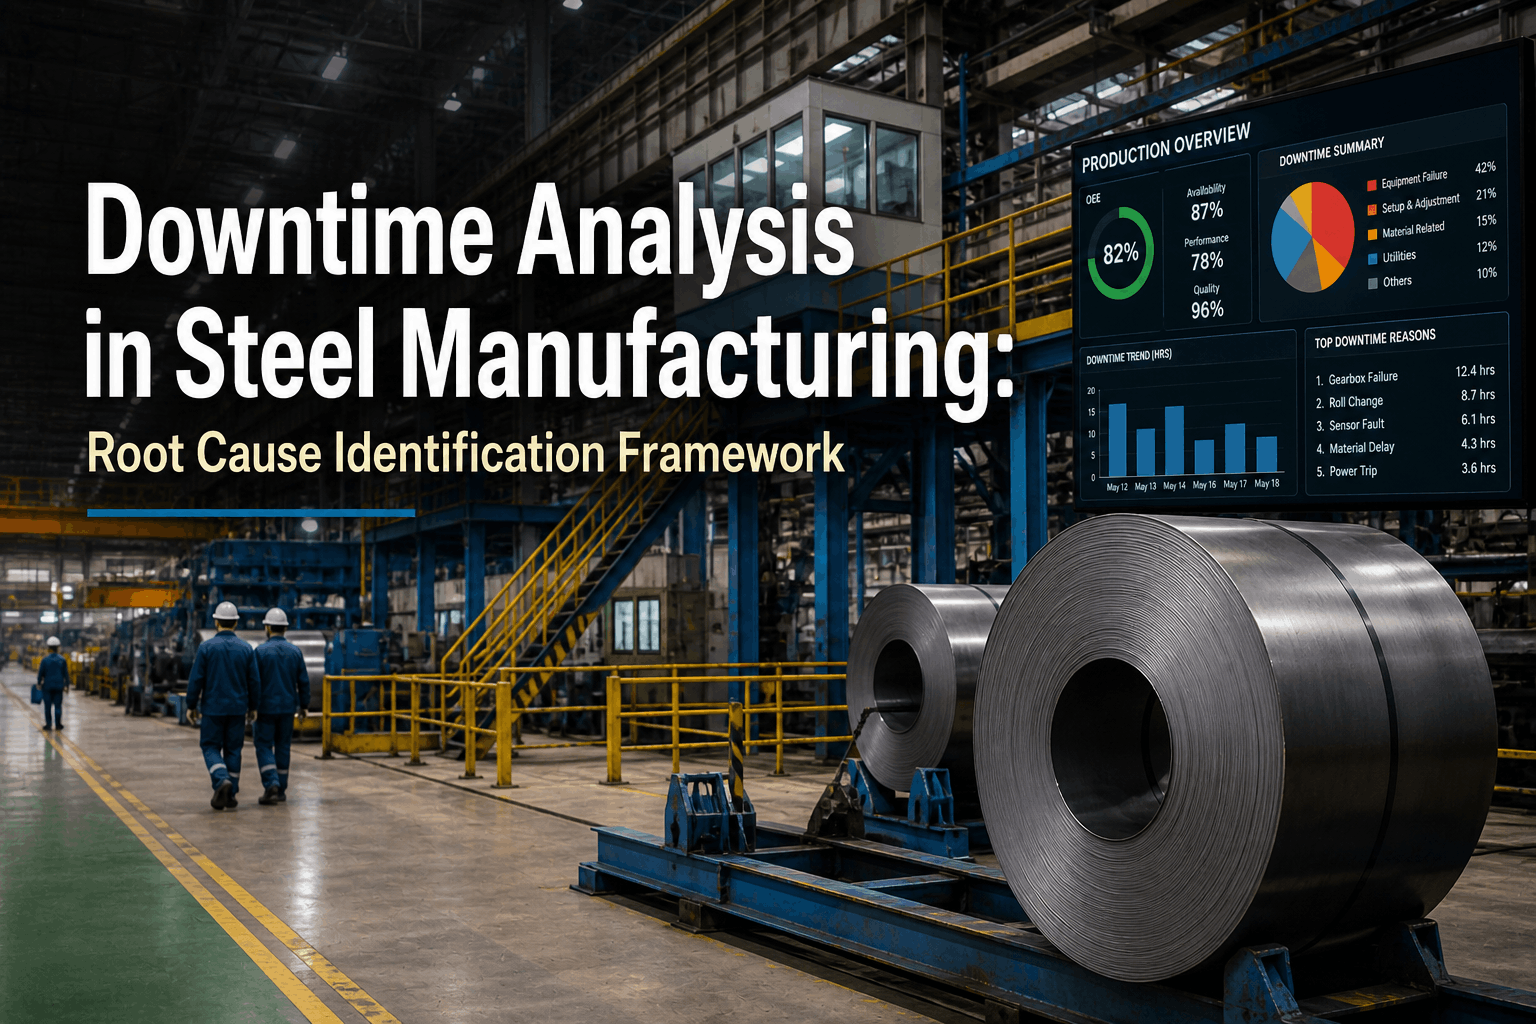
In the high-stakes world of steel manufacturing, the term "unplanned downtime" is often an understatement of a catastrophic financial event. While most maintenance managers track "lost production" as the primary metric, the true Total Cost of Downtime (TCD) is an iceberg—where only the visible tip is the lost tonnage, while the massive, submerged portion consists of energy waste, secondary refining damage, customer penalties, and labor surcharges. This guide covers the essential financial metrics every steel analytics team must track, and how AI-driven dashboards are transforming how these numbers translate into operational action. Book a Demo to see how iFactory's Financial Intelligence module surfaces these TCD costs live, by line, by shift, and by asset.
Total Cost of Downtime (TCD) in Steel Manufacturing
iFactory gives steel analytics teams a unified AI-powered platform to track the hidden financial impact of downtime—automatically quantifying losses across production, energy, and labor at plant scale.
Why True TCD Tracking is the Foundation of Steel Profitability
Downtime analytics in steel is not simply about counting stops—it is about defining the right financial metrics that connect thermodynamic behavior, energy tariffs, and production priority into a single operational picture. Plants that track "OEE only" consistently underestimate their true margin erosion by 200% or more.
A well-structured TCD framework covers four domains: direct revenue loss, labor overhead extension, energy waste (thermal stability), and fixed cost absorption. The most effective steel manufacturing dashboards display these in real time, enabling management to prioritize repairs based on financial urgency rather than just chronological order.
The Six Pillars of the Steel Downtime Iceberg
These six cost pillars represent the highest-impact financial measurement areas across the mill. Analytics teams that establish baselines for these hidden costs gain a measurable advantage in budget justification and operational recovery. You can explore how each of these is tracked live by booking a demo with iFactory.
Lost Production Revenue
The most visible metric: the market value of the tonnage not produced during the stoppage. iFactory calculates this based on real-time market pricing and grade priority, ensuring the highest-value orders are prioritized during recovery.
Thermodynamic Energy Waste
Furnaces remaining at temperature without processing material, plus the massive energy spike required to return a "cold" asset (like a caster) to thermal stability after a prolonged stoppage.
Yield & Quality Degradation
Material "stuck" in the secondary refining or rolling stages during a stop often degrades to scrap or secondary grade. iFactory tracks this "frozen yield" cost automatically per incident.
Labor Overhead & Surcharges
The cost of the entire operational crew standing idle, plus the overtime surcharges required for the emergency maintenance team to execute the repair outside of planned windows.
Customer Delivery Penalties
Missed delivery windows leading to liquidated damages or the high cost of emergency logistics (air freight) to satisfy critical tier-1 automotive or aerospace contracts.
Fixed Cost Absorption
The portion of the plant's massive annual fixed costs (depreciation, insurance, management) that must be absorbed by fewer tons of production, directly eroding product margin.
The Margin Recovery Journey: From Reactive to Autonomous
Transitioning from reactive maintenance to autonomous TCD management follows a structured technical progression. iFactory accelerates this journey by delivering financial visibility in under 24 hours from deployment.
Unified Financial Ingestion
iFactory connects to your CMMS, ERP, and SCADA networks to correlate machine events with financial line items. Every stoppage is instantly mapped to revenue, energy, and labor costs without manual spreadsheets.
High-Fidelity Cost Baselining
The platform establishes specific "Cost-per-Minute" baselines for every asset class (EAF, HSM, Caster) based on historical energy consumption and current grade value. Benchmarking is relative to your specific plant configuration.
Predictive Financial Guardrails
AI models detect degradation patterns that statistically lead to high-cost failures. When a bearing vibration signature trends toward failure, iFactory calculates the "Cost of No Action" vs. the "Cost of Planned Repair."
Autonomous Margin Recovery
At full maturity, the cognitive engine suggests operational slow-downs or grade-switches to protect equipment until a low-energy-tariff repair window becomes available. Book a demo to see this in action.
Downtime Benchmarking: Typical Hourly Costs by Production Area
Understanding your financial exposure by department is the prerequisite for prioritizing maintenance investments. The table below provide industry benchmark ranges for a typical 1MTPA integrated steel mill.
| Production Area | Industry Average (Min) | Industry Average (Max) | World-Class Target | Impact if Untracked |
|---|---|---|---|---|
| Hot Strip Mill (HSM) | $22,000/hr | $48,000/hr | < 1% Downtime | Severe Revenue Hemorrhage |
| Continuous Caster | $12,000/hr | $25,000/hr | 100% Reliability | Critical Yield & Quality Loss |
| Electric Arc Furnace (EAF) | $8,500/hr | $18,000/hr | Stable Taper | Energy Surcharges & Latency |
| Finished Goods/Shipping | $1,500/hr | $5,000/hr | Zero Lag | Liquidated Damages (FOB) |
Building a Steel Downtime Maturity Roadmap
Improving how your team manages downtime is a progression through measurable maturity levels. Analytics leaders who have mapped this journey report that moving from Level 2 to Level 3 reduces unplanned maintenance costs by up to 35%. Book a demo to benchmark your plant's current maturity.
Frequently Asked Questions: TCD in Steel Manufacturing
What is the "Million Dollar Minute" in steelmaking?
In large integrated mills, particularly during a Hot Strip Mill or Continuous Caster outage, the combined loss of revenue, energy penalties, and secondary yield loss can approach or exceed $1,000,000 if the stoppage extends into the "thermal recovery" phase. iFactory calculates the specific "Minute Value" for every asset in your fleet.
How does iFactory calculate "Energy Waste" during downtime?
The platform correlates SCADA data (fuel/power flow) with production status. It identifies the "Idle Base" (energy consumed while no steel is moving) and the "Recovery Spike" (extra energy used to return the asset to operational temperature) to give a precise financial value to the thermodynamic loss.
Why is OEE insufficient for true financial downtime tracking?
OEE is an engineering metric that measures Availability, Performance, and Quality. However, a 1-hour stop during a high-energy-tariff window on a high-margin automotive order costs significantly more than the same stop on a commodity rebar run. TCD adds the financial "weight" that OEE lacks.
Stop Measuring Time. Start Measuring Money.
iFactory's Financial Intelligence module gives your team the live data to quantify every minute of downtime across production, energy, and labor—built specifically for the scale of integrated steelmaking.