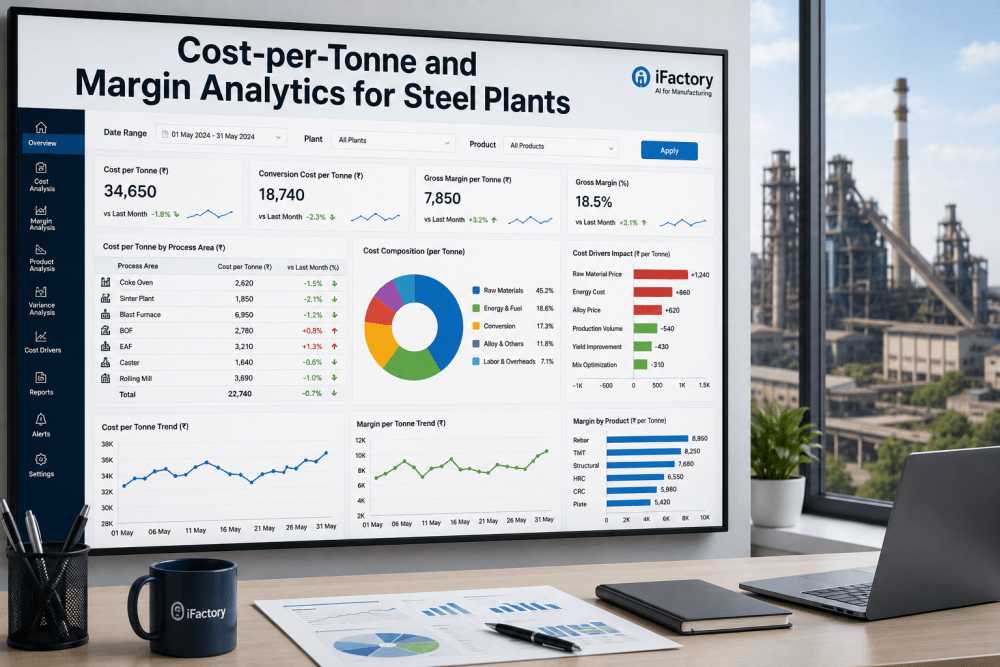
Steel production cost per tonne is the most closely tracked financial metric in any integrated steel mill or EAF operation — and the one most frequently misunderstood by plant managers who conflate accounting cost with operational cost. The number your finance team reports as "cost per tonne" at month-end is a lagging average across a production period that may have included four furnace campaigns of varying efficiency, two shifts with above-normal scrap yield loss and a rolling mill energy spike during a peak-demand billing period. Managing cost per tonne from that number is like steering a ship using last week's GPS position. iFactory's cost analytics and KPI dashboard platform gives integrated steel mills and EAF operations real-time cost visibility at the circuit level — tracking raw material yield, energy intensity, labor productivity, and maintenance spend per tonne of steel produced — so the cost number your operations team sees on Monday morning reflects what actually happened on Sunday night, not a 30-day average. Mills deploying iFactory's cost analytics platform report 18% reduction in cost per tonne within 12 months, 23% improvement in raw material yield, and real-time cost visibility that replaces monthly accounting reports with daily operational intelligence.
Raw Materials · Energy · Labor · Maintenance · Analytics
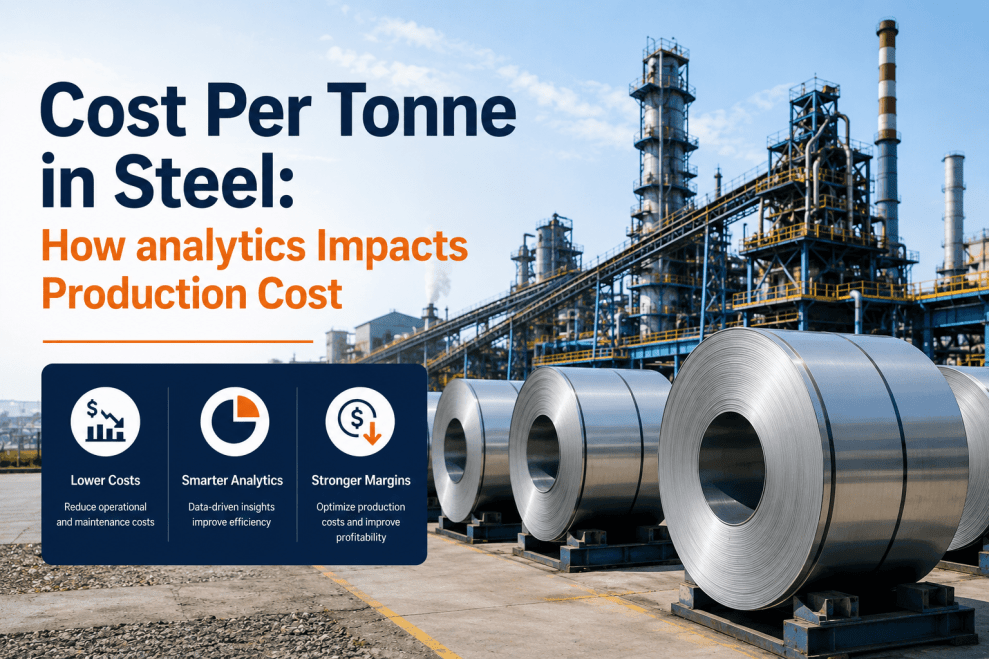
Cost Per Tonne in Steel Production — Complete Breakdown, Benchmarks, and Where Analytics Delivers the Most Impact.
iFactory's cost analytics platform tracks every cost driver — raw material yield, energy intensity, labor utilization, and maintenance spend — normalized to tonnes of steel produced in real time. Stop managing cost from monthly accounting reports. Start managing it from operational data.
18%
Reduction in cost per tonne within 12 months of iFactory analytics deployment
23%
Improvement in raw material yield via real-time scrap and iron unit tracking
$14–$31
Per-tonne cost reduction documented at comparable steel mill deployments
Daily
Cost-per-tonne visibility replacing 30-day lagging accounting reports
The Complete Cost Per Tonne Breakdown — What Makes Up the Number and Where It Varies
Cost per tonne in steel production is not a single number — it is the sum of five distinct cost buckets, each driven by different operational variables, each improvable through different analytical interventions. The industry-standard breakdown below reflects U.S. integrated steel mill and EAF averages as reported by AISI and World Steel Association benchmarking data. Actual per-tonne costs vary significantly by plant configuration, product mix, energy market, and scrap quality — which is precisely why plant-specific real-time tracking is more actionable than industry averages.
Steel Production Cost Per Tonne — Integrated Mill vs. EAF
Industry benchmark ranges (USD per tonne, U.S. market, 2024–2025)
Raw Materials
55–65%
$385–$520/t (BF-BOF) · $210–$310/t (EAF)
Energy
15–20%
$105–$160/t (BF-BOF) · $55–$95/t (EAF)
Labor
8–12%
$55–$90/t (BF-BOF) · $30–$55/t (EAF)
Maintenance
6–9%
$40–$70/t (BF-BOF) · $22–$42/t (EAF)
Other (SG&A, Compliance, Logistics)
5–8%
$35–$60/t (BF-BOF) · $18–$35/t (EAF)
Sources: AISI Steel Technology Roadmap, World Steel Association Cost Benchmarking Report, U.S. EIA Industrial Energy Consumption Survey. Ranges reflect variation in plant scale, scrap quality, energy market, and product mix.
The most important thing this breakdown communicates is where the leverage is. Raw materials represent 55 to 65% of cost per tonne — a 2% improvement in iron unit yield or scrap recovery has a larger absolute impact on cost per tonne than a 10% reduction in any other category. Energy at 15 to 20% is the second-largest lever and the most volatile, driven by electricity spot prices, natural gas tariffs, and furnace efficiency. Maintenance cost per tonne is the category most directly improved by predictive analytics — unplanned downtime carries both direct repair cost and the production volume impact that raises every fixed-cost element's per-tonne allocation. Book a Demo to see how iFactory's cost analytics disaggregates your mill's specific cost structure.
Raw Material Cost Per Tonne — The Dominant Driver and Where Analytics Changes the Equation
Raw material cost per tonne in steelmaking is determined by three variables: the purchase price of iron-bearing inputs, the yield through the process — how much of what you buy ends up in finished steel — and the product mix that determines which raw material formulas are required. The first variable is largely market-driven. The second and third are operationally managed, and both are directly improvable through analytics.
| Raw Material Input |
BF-BOF Role |
EAF Role |
Typical Cost Contribution |
Analytics Improvement Lever |
| Iron Ore / Pellets |
Primary iron unit source via blast furnace |
Not used (EAF scrap-based) |
$180–$240/t finished steel |
Blast furnace iron unit yield tracking, burden optimization |
| Metallurgical Coke |
Reducing agent and heat source in blast furnace |
Not primary input |
$90–$140/t finished steel |
Coke rate monitoring per heat, injection optimization |
| Scrap Steel |
BOF coolant and yield adjustment |
Primary charge material (80–100%) |
$55–$175/t finished steel |
Scrap grade tracking, yield loss by grade, charge mix optimization |
| Fluxes (Lime, Dolomite) |
Slag formation, phosphorus removal |
Slag chemistry control |
$18–$35/t finished steel |
Slag basicity trending, flux consumption per heat analytics |
| Alloy Additions |
Grade specification compliance |
Grade specification compliance |
$12–$80/t finished steel (grade-dependent) |
Alloy hit rate tracking, chemistry deviation cost calculation |
| DRI / HBI (where used) |
Partial blast furnace supplement |
Prime iron unit supplement |
$40–$90/t finished steel |
DRI/HBI yield tracking vs. equivalent scrap substitution cost |
The analytics opportunity in raw material cost is primarily in yield — not in procurement price. A steel mill that tracks scrap yield to three significant figures by grade and by heat is managing a completely different operation than one that calculates yield at month-end from tonnage invoices. When iFactory's platform shows that a particular scrap supplier's HMS-1 grade is running 1.8% lower yield than the specification average — across 40 heats over three weeks — that is a $4.20 per tonne raw material cost variance that is invisible in the accounting system but discoverable in heat-level analytics. Mills that manage yield at the heat level consistently operate 1.5 to 2.8% above the industry average yield for their configuration, which translates directly to $9 to $17 per tonne in raw material cost advantage.
Energy Cost Per Tonne — Intensity, Pricing, and the Analytics Levers That Move the Number
Energy cost per tonne in steel production combines two variables that require different management strategies: the quantity of energy consumed per tonne of output (energy intensity), and the price paid for each unit of energy (energy procurement). Analytics can materially improve energy intensity — it has limited direct impact on energy procurement price, though it enables load-shifting strategies that reduce peak-demand charges.
Energy Cost Per Tonne — Where the $105–$160/Tonne Goes in an Integrated Mill
01
Blast Furnace
$38–$58/t
Coke combustion and hot blast energy. Coke rate (kg coke per tonne hot metal) is the primary efficiency metric. Industry range: 280–420 kg/thm. Analytics lever: burden distribution optimization, blast temperature trending.
02
BOF / EAF Steelmaking
$22–$40/t
Oxygen consumption (BOF) or electrical energy (EAF at 350–450 kWh/t). EAF power-on time and electrode consumption are the dominant analytics targets. Heat-to-heat energy variance tracking identifies process drift before cost impact accumulates.
03
Reheating Furnaces
$18–$28/t
Natural gas consumption for slab/billet reheating. Specific fuel consumption (GJ/t) varies 8–18% between well-optimized and poorly-controlled operations. Furnace temperature profile analytics and push rate optimization are the primary levers.
04
Rolling Mill Drives
$14–$20/t
Electrical energy for hot and cold rolling. Drive efficiency, roll pass design, and cobble rate directly affect kWh/t. Peak demand charge avoidance via shift scheduling analytics reduces effective energy cost without reducing consumption.
05
Auxiliary Systems
$13–$14/t
Compressed air, cooling water pumps, lighting, HVAC, dust collection. Often 8–12% of total energy cost with the highest proportion of addressable waste through motor efficiency and compressed air leak tracking.
Track Energy Cost Per Tonne at the Process Level — Not Just the Utility Bill Level.
iFactory's energy analytics disaggregates your mill's energy spend to blast furnace, steelmaking, reheating, and rolling — normalized to tonnes produced per shift — so your team manages energy cost as an operational variable, not an accounting line item.
Labor and Maintenance Cost Per Tonne — The Fixed-Cost Trap and the Productivity Analytics Solution
Labor and maintenance represent 14 to 21% of cost per tonne in a typical U.S. steel mill — and they share a characteristic that makes them analytically different from raw material and energy costs: a large fraction is fixed in the short term. You cannot reduce a shift crew by 20% because production volume dropped 15% this week. The implication is that the primary analytics lever for labor and maintenance cost per tonne is not headcount reduction — it is volume maximization. Every tonne of production lost to unplanned downtime, quality rejection, or yield loss increases the per-tonne allocation of fixed labor and maintenance cost across a smaller production base.
Without Analytics — Fixed Cost Trap
Reactive maintenance, lagging productivity data
Maintenance cost per tonne rises when production drops — fixed crew cost spread over fewer tonnes
Unplanned downtime events average 4.2 hours per week — 218 tonnes of lost production volume
Labor productivity measured monthly — crew deployment mismatches invisible until payroll audit
Maintenance spend managed to annual budget — no visibility into cost-per-tonne impact of specific asset failures
PM schedules based on calendar — resources deployed at wrong interval for actual operating conditions
Result: $55–$90/t labor + $40–$70/t maintenance with high variance
With iFactory Analytics — Volume Maximization
Predictive maintenance, real-time productivity KPIs
Fixed cost absorption maximized through uptime improvement — same crew cost, more tonnes
Predictive maintenance reduces unplanned downtime by 38% — 83 additional production tonnes per week
Labor productivity tracked per shift per production unit — crew deployment matched to production schedule
Maintenance cost per tonne tracked by asset — failure cost calculated including production volume impact
Condition-based PM deploys maintenance resources at optimal interval — 26% reduction in total maintenance spend
Result: 18–26% lower combined labor + maintenance cost per tonne
Analytics-Driven Cost Reduction — The iFactory KPI Dashboard Framework for Steel Mills
Managing cost per tonne through analytics requires a KPI architecture that connects operational metrics to financial outcomes in real time. The framework below describes the five KPI categories that iFactory's cost analytics dashboard tracks for steel mill operations — each connecting a measurable operational variable to a documented cost-per-tonne impact.
KPI 1
Iron Unit Yield — Raw Material Cost Per Tonne Tracking at the Heat Level
Iron unit yield — the percentage of iron-bearing input that reports to finished steel — is calculated heat-by-heat from charge weights, tap weights, and yield loss points (slag, dust, spillage). When yield trends below the rolling 30-heat average for a specific charge mix, the deviation is flagged with its cost-per-tonne impact calculated at current raw material prices. A 1% yield improvement on a 1,000-tonne-per-day operation running $420/t raw material cost is $4.20 per tonne — or $4,200 per day in recoverable raw material value.
KPI: Yield % by heat · Yield trend vs. charge mix baseline · $ per tonne yield deviation · Supplier yield comparison
KPI 2
Energy Intensity — kWh/t, GJ/t, and $ Per Tonne by Process Unit
Energy intensity is tracked per tonne of output for each major energy consumer — blast furnace coke rate, EAF kWh/t, reheating furnace specific fuel consumption, rolling mill drive energy. When the reheating furnace's specific fuel consumption trends 8% above the baseline for the same product and push rate, the alert includes the cost-per-tonne impact at current gas prices. Peak demand charge tracking identifies which production sequences are generating demand spikes and quantifies the cost-per-tonne savings available from load-shifting those sequences.
KPI: kWh/t by process · GJ/t reheating · Coke rate kg/thm · Peak demand cost allocation · Energy intensity trend
KPI 3
OEE and Downtime Cost — Lost Volume Calculated as Fixed Cost Per Tonne Impact
Overall Equipment Effectiveness for each production asset is tracked as a component of cost per tonne by calculating the fixed cost absorption impact of lost volume. When the rolling mill runs at 82% OEE instead of the target 91%, the 9-point gap represents approximately 90 tonnes of lost production per 10-hour shift — and every tonne of that gap increases the fixed-cost per-tonne allocation for the entire shift's production. iFactory calculates this impact in real time, so the operations team sees not just that OEE is below target, but what it is costing per tonne of production today.
KPI: OEE by asset · Downtime hours and cause classification · Fixed cost per tonne impact of lost volume · Availability trend
KPI 4
Quality Cost Per Tonne — Rework, Downgrade, and Rejection Cost Quantified
Quality-related cost per tonne encompasses three categories: rework cost (reprocessing a heat or coil that failed specification), downgrade cost (selling a higher-grade specification as a lower-grade product at a price discount), and rejection cost (scrap or customer return). iFactory tracks all three at the heat and coil level, calculates the cost-per-tonne impact, and correlates quality events with the upstream process parameters — chemistry deviation, temperature excursion, equipment condition — that caused them. This closes the loop between operational parameter control and cost outcome.
KPI: Rework rate by product · Downgrade cost per tonne · First-pass yield · Chemistry hit rate · Quality cost trend
KPI 5
Maintenance Cost Per Tonne — Asset-Level Spend vs. Contribution to Production Cost
Maintenance cost per tonne is tracked at the asset level — not just as a total plant maintenance budget divided by total production. An asset that consumes $85,000 in maintenance spend per month while contributing to 18,000 tonnes of production has a very different cost profile than one consuming the same spend while contributing to 9,000 tonnes. iFactory's cost analytics surface these asset-level ratios, identify outliers where maintenance spend per tonne is anomalously high relative to asset contribution, and trigger condition-based PM that replaces the fixed-interval schedule with a condition-driven one that optimizes the spend-to-output ratio.
KPI: Maintenance $ per tonne by asset · Corrective vs. preventive ratio · PM compliance rate · Spare parts cost per tonne
$14–$31
Per-tonne cost reduction at comparable iFactory deployments within 18 months
38%
Reduction in unplanned downtime frequency — directly improving fixed cost absorption per tonne
1.8–2.8%
Yield improvement over industry average for mills managing yield at the heat level
Daily
Cost-per-tonne reporting frequency vs. monthly accounting-period reporting at baseline
See Your Cost Per Tonne at the Process Level — Raw Material Yield, Energy Intensity, Downtime Cost, and Quality Cost in One Dashboard.
iFactory's cost analytics platform connects your production data, energy meters, maintenance records, and quality system into a single real-time cost-per-tonne view that replaces monthly accounting reports with daily operational intelligence.
Expert Review: What Steel Mill Operations and Finance Leaders Say About Real-Time Cost Per Tonne Analytics
"The fundamental problem with how most steel mills manage cost per tonne is that they are managing it from accounting data — and accounting data is the wrong tool for operational cost management. When your cost accountant tells you that last month's cost per tonne was $487 versus the prior month's $501, you have a 30-day lagging signal across a period that included six different operational configurations, two raw material price changes, and three unplanned downtime events of varying duration. You cannot make operational decisions from that number — you can only observe it. What changed for us after deploying iFactory's cost analytics was the time horizon. We went from seeing cost per tonne once a month in an accounting report to seeing it once per shift in an operational dashboard. And when the number is updated every shift, you can actually manage to it — you can see that yesterday's afternoon shift ran $23/t above the target because the EAF had a transformer issue that extended average heat time by 11 minutes, and you can have a root cause conversation that day rather than three weeks later when the accounting report lands. In the first year, our documented cost reduction was $19 per tonne. Our raw material yield improved by 2.1 percentage points because we started tracking scrap grade performance heat-by-heat and found that one of our secondary scrap suppliers was running 1.6% below specification yield consistently — something that was completely invisible in the monthly accounting data. The analytics platform paid for itself in 4.2 months. More importantly, it changed how our operations team thinks about cost — as a variable they are managing in real time, not a result they receive once a month."
VP of Operations and Finance Integration
Midwestern EAF Steel Mill — 900,000 Ton Annual Capacity — 24 Years Steel Industry — CPA and Six Sigma Black Belt
Conclusion: Cost Per Tonne Is an Operational Metric, Not an Accounting Output
The steelmakers who manage cost per tonne most effectively are not the ones with the most sophisticated cost accounting systems — they are the ones who have connected their operational data to their cost data at the process level and at the right time frequency. Raw material yield tracked at the heat level. Energy intensity tracked per shift per process unit. Downtime cost calculated in real time as lost volume multiplied by fixed cost absorption rate. Quality cost tracked from chemistry deviation to price discount at the product level. Maintenance spend tracked per tonne of output contribution at the asset level.
iFactory's cost analytics and KPI dashboard platform gives steel mills this operational cost intelligence — replacing the monthly accounting report cycle with a real-time cost management system that connects every operational variable to its per-tonne cost impact. The $14 to $31 per-tonne reduction documented at comparable deployments is not the result of a single cost-reduction initiative — it is the cumulative outcome of managing five cost categories through operational data rather than accounting data, at the time frequency that makes intervention possible rather than retrospective. Book a Demo to see iFactory's cost analytics platform configured for your mill's specific production configuration and cost structure.
Frequently Asked Questions