Energy is the single largest controllable cost in steel manufacturing — consuming 15–20% of total production cost in the BF-BOF route and up to 20–40% when including all fuel and feedstock. For a 2 MTPA integrated plant, that translates to $80–120 million per year flowing through furnaces, motors, compressors, and boilers. Yet most plants track energy cost monthly, in aggregate, weeks after the money is already spent. They know the total bill but not which shift, which furnace, or which process deviation caused the spike. The plants that are winning in 2026 track energy cost per tonne in real time, correlate every spike to a root cause within minutes, and generate AI recommendations that pay for themselves within one billing cycle. With carbon border adjustments now imposing €20–80 per tonne on high-carbon steel imports to the EU and India's CCTS scheme replacing PAT, the cost of ignorance is accelerating. iFactory deploys AI-powered energy cost intelligence for steel plants — book a 30-minute consultation to see exactly how much your plant is overspending.
Energy Cost Intelligence
Know What Every
Tonne of Steel
Costs You in Energy.
Real-Time Cost Tracking, AI-Driven Savings Recommendations & ROI Analytics for Energy-Intensive Steel Operations
Book a Free Consultation
15–20%
Of Total Steel Production Cost Is Energy
$40–60
Energy Cost Per Tonne of BF-BOF Steel
11%
Average Energy Cost Reduction With AI in Year One
$2–5M
Annual Savings for Mid-Sized Integrated Steel Plants
The Real Energy Cost Breakdown: Where $40–60 Per Tonne Actually Goes
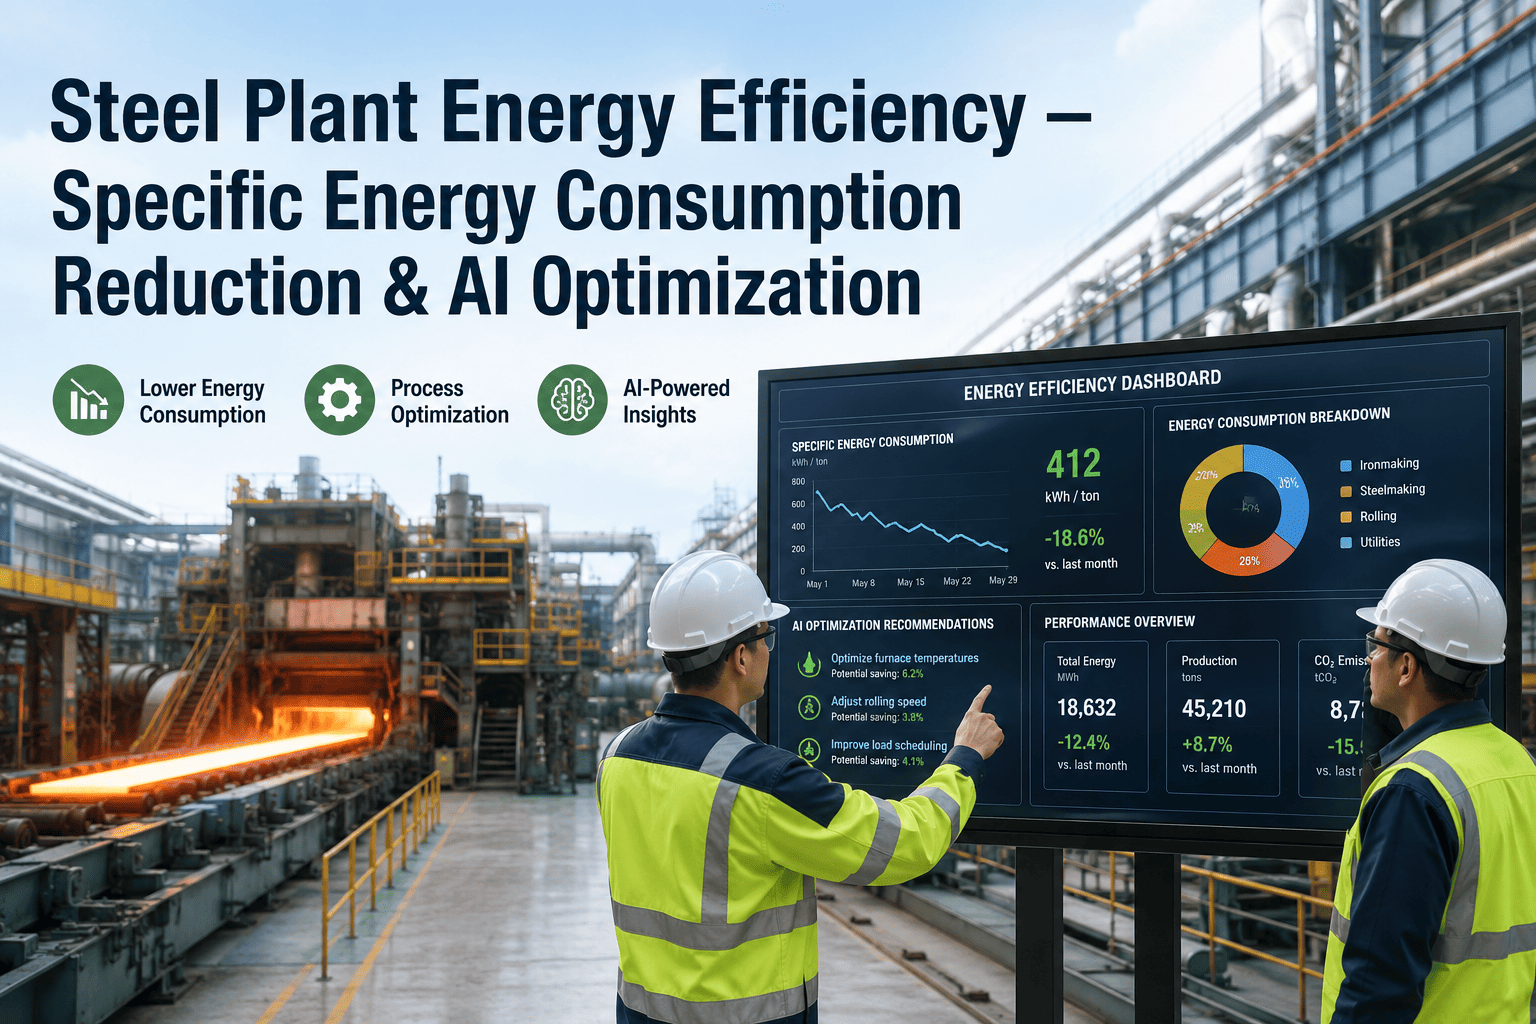
Most plant managers see a monthly electricity bill and a quarterly fuel report. That is not energy cost management — it is energy cost observation. The breakdown below shows where energy cost concentrates across an integrated BF-BOF plant, what drives cost variability, and where AI optimization delivers the highest dollar-per-tonne return.
Coking Coal & Coke
$18–28
Coke rate, coal blend, BF efficiency
$1.5–3.5/t
Electricity (Grid + Captive)
$10–18
Tariff structure, demand peaks, power factor
$1.0–2.5/t
Natural Gas
$5–10
Reheating furnace usage, seasonal pricing
$0.5–1.5/t
Industrial Gases (O2, N2, Ar)
$3–6
ASU load management, O2 venting, over-purging
$0.3–0.8/t
Steam, Water & Compressed Air
$2–5
Leaks, trap failures, cooling inefficiency
$0.2–0.6/t
Total AI Savings Potential:
$3.5–8.9 per tonne of crude steel
At 2 MTPA = $7M–$17.8M annual savings opportunity
The Five Energy Cost Leaks Most Plants Cannot See
Energy cost overruns do not announce themselves. They hide inside aggregate bills, spread across hundreds of meters and thousands of operating hours. By the time the monthly report arrives, the money is gone. AI identifies these cost leaks in real time and quantifies the dollar impact per shift, per furnace, per process.
01
Demand Peak Penalties
A single 15-minute demand peak from uncoordinated motor startups, EAF charges, or rolling mill sequencing can set the demand charge for an entire billing period. Plants pay $200K–$500K/year in avoidable demand penalties because load scheduling decisions happen on the production floor without visibility into tariff impact.
AI staggers large electrical loads across 5–10 minute windows, flattening peak demand by 18–22% and reducing demand charges by $150K–$400K/year.
02
Grid Import During Peak Tariff
Captive power plants running on byproduct gas (BFG, COG) can cover 40–70% of plant electricity demand — but only when gas availability aligns with generation. When the gas holder dips, the plant imports from the grid at peak rates. Plants without predictive gas-to-power scheduling overpay $300K–$800K/year on avoidable grid purchases.
AI predicts gas availability 15–30 minutes ahead and pre-loads captive generation, reducing peak-tariff grid imports by 30–50%.
03
Coke Rate Drift
Coke is the single most expensive energy input. A 10 kg/t increase in coke rate — invisible in weekly production reports — adds $1.5–2.5 per tonne across every heat. At 2 MTPA, that slow drift costs $3M–$5M/year before anyone notices in the quarterly energy review.
AI tracks coke rate per heat against coal blend properties and BF operating parameters, alerting within 24 hours when drift exceeds $0.50/t threshold.
04
Reheating Furnace Over-firing
When rolling schedules change mid-shift, reheating furnaces hold temperature for idle periods, burning fuel for zero throughput. A furnace holding at 1,250°C during a 30-minute mill delay consumes $400–$800 in natural gas. With 2–4 delays per shift across multiple furnaces, over-firing costs $250K–$600K/year.
AI predicts rolling delays from upstream process status and auto-reduces furnace setpoints during anticipated idle periods, cutting holding fuel by 40–60%.
05
Carbon Cost Exposure
The EU CBAM (fully operational January 2026) imposes €20–80 per tonne on high-carbon steel imports. India's CCTS replaces PAT with direct emissions intensity targets. Plants that cannot demonstrate low-carbon performance face growing cost penalties — not just from energy bills, but from market access restrictions.
AI calculates real-time emissions intensity per tonne, models carbon cost scenarios under multiple pricing frameworks, and identifies the lowest-cost decarbonization pathway.
From Monthly Bills to Per-Tonne Intelligence: What Changes
The difference between energy cost management and energy cost intelligence is granularity, speed, and actionability. Most plants operate at Level 1 or 2. AI moves them to Level 4 — where every cost deviation is detected in real time, attributed to a root cause, and accompanied by a dollar-quantified recommendation.
Level 1
Bill Paying
Monthly utility bills reviewed by finance. No process-level attribution. Energy treated as a fixed overhead cost.
Where 60% of plants are today
Level 2
Meter Monitoring
Sub-meters installed on major equipment. Weekly or monthly reporting on consumption by area. No real-time cost correlation.
Sees consumption, not cost impact
Level 3
Cost Tracking
Energy cost per tonne calculated daily. Tariff-aware reporting shows when high-cost consumption occurs. Benchmarks against historical baselines.
Tracks cost, cannot prevent overruns
Level 4
AI Cost Intelligence
Real-time cost per tonne with process attribution. AI predicts cost deviations before they hit the meter. Every recommendation quantified in $/tonne saved. Automated alerts on abnormal cost spikes.
Where iFactory takes you
ROI That Compounds: How AI Savings Grow Over Time
AI energy optimization is not a one-time audit — it is a learning system. Models trained on your plant's specific equipment, operating patterns, and cost structures improve with every heat, every shift, every season. First-year savings are just the starting point.
Months 1–3
Quick Wins
Demand peak flattening via load scheduling
Compressed air leak load quantification
Grid import vs captive generation rebalancing
Typical impact: $0.5–1.5/t savings
Months 3–6
Process Optimization
BF combustion tuning and coke rate reduction
Reheat furnace-rolling mill synchronization
Byproduct gas network balancing
Cumulative impact: $1.5–3.5/t savings
Months 6–12
Structural Gains
Full gas-to-power optimization
Steam network efficiency recovery
Carbon cost modeling and CCTS/CBAM compliance
Cumulative impact: $3.5–8.9/t savings
Year 2+
Compounding Returns
AI models improve with accumulated operational data
Seasonal patterns, grade-mix variations, and equipment aging factored in
Savings compound as optimization scope expands across plant
Typical Year 2 uplift: +15–25% above Year 1 savings
The iFactory Energy Cost Intelligence Platform
iFactory integrates with your existing SCADA, metering infrastructure, ERP, and billing systems to deliver a unified cost intelligence layer that connects physical energy flows to financial outcomes in real time. No control system modifications required. Deployment in 4–6 weeks.
Frequently Asked Questions
How quickly can AI reduce energy costs in a steel plant?
Quick wins — demand peak flattening, grid import optimization, and compressed air leak reduction — typically deliver measurable savings within 2–4 months. Process-level optimization (combustion tuning, gas network balancing) adds another layer within 3–6 months. Most plants achieve positive ROI within 6–12 months, with cumulative savings of $3.5–8.9 per tonne of crude steel by end of Year 1.
Does the platform integrate with our ERP and billing systems?
Yes. iFactory connects to ERP platforms (SAP, Oracle, and others) via standard APIs to pull production data, cost center allocations, and billing information. It also integrates with utility billing systems to apply actual tariff structures — including time-of-day rates, demand charges, power factor penalties, and seasonal variations — to real-time consumption data. This ensures cost calculations reflect what you actually pay, not textbook averages.
How does the platform handle carbon cost accounting?
The platform calculates emissions intensity per tonne of steel using IPCC-aligned methodology, supporting both India's CCTS framework and the EU CBAM simultaneously. It models carbon cost exposure under multiple pricing scenarios (current ESCert prices, projected CCC prices, CBAM rates) and identifies which energy efficiency investments deliver the highest return when carbon cost is factored in alongside direct energy savings.
What ROI can we expect from the platform?
Plants deploying integrated AI energy cost intelligence report 11% average reduction in energy costs within the first year. For a 2 MTPA integrated plant spending $80–120M/year on energy, that represents $8.8–13.2M in annual savings. Platform deployment and annual subscription costs are typically recovered within the first 3–6 months of operation.
Stop Reviewing Last Month's Energy Bill. Start Controlling Tomorrow's.
iFactory deploys AI-powered energy cost intelligence for steel plants — real-time cost-per-tonne tracking, AI-driven savings recommendations, demand peak management, and carbon cost modeling. Every rupee tracked. Every overrun flagged. Every saving quantified.