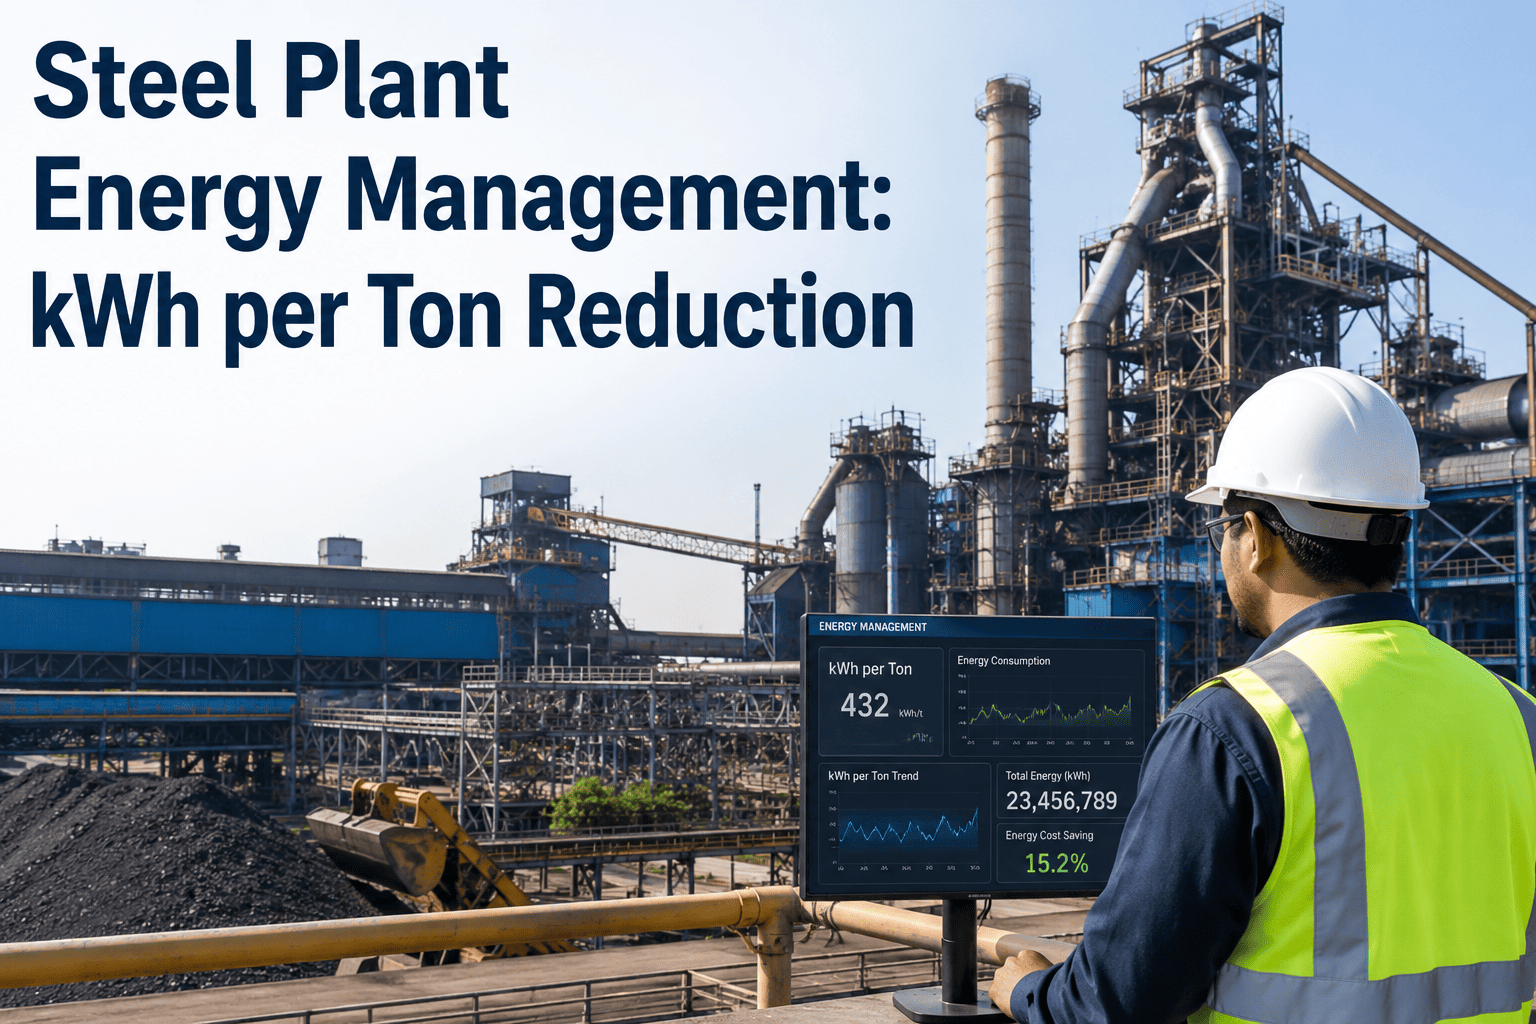
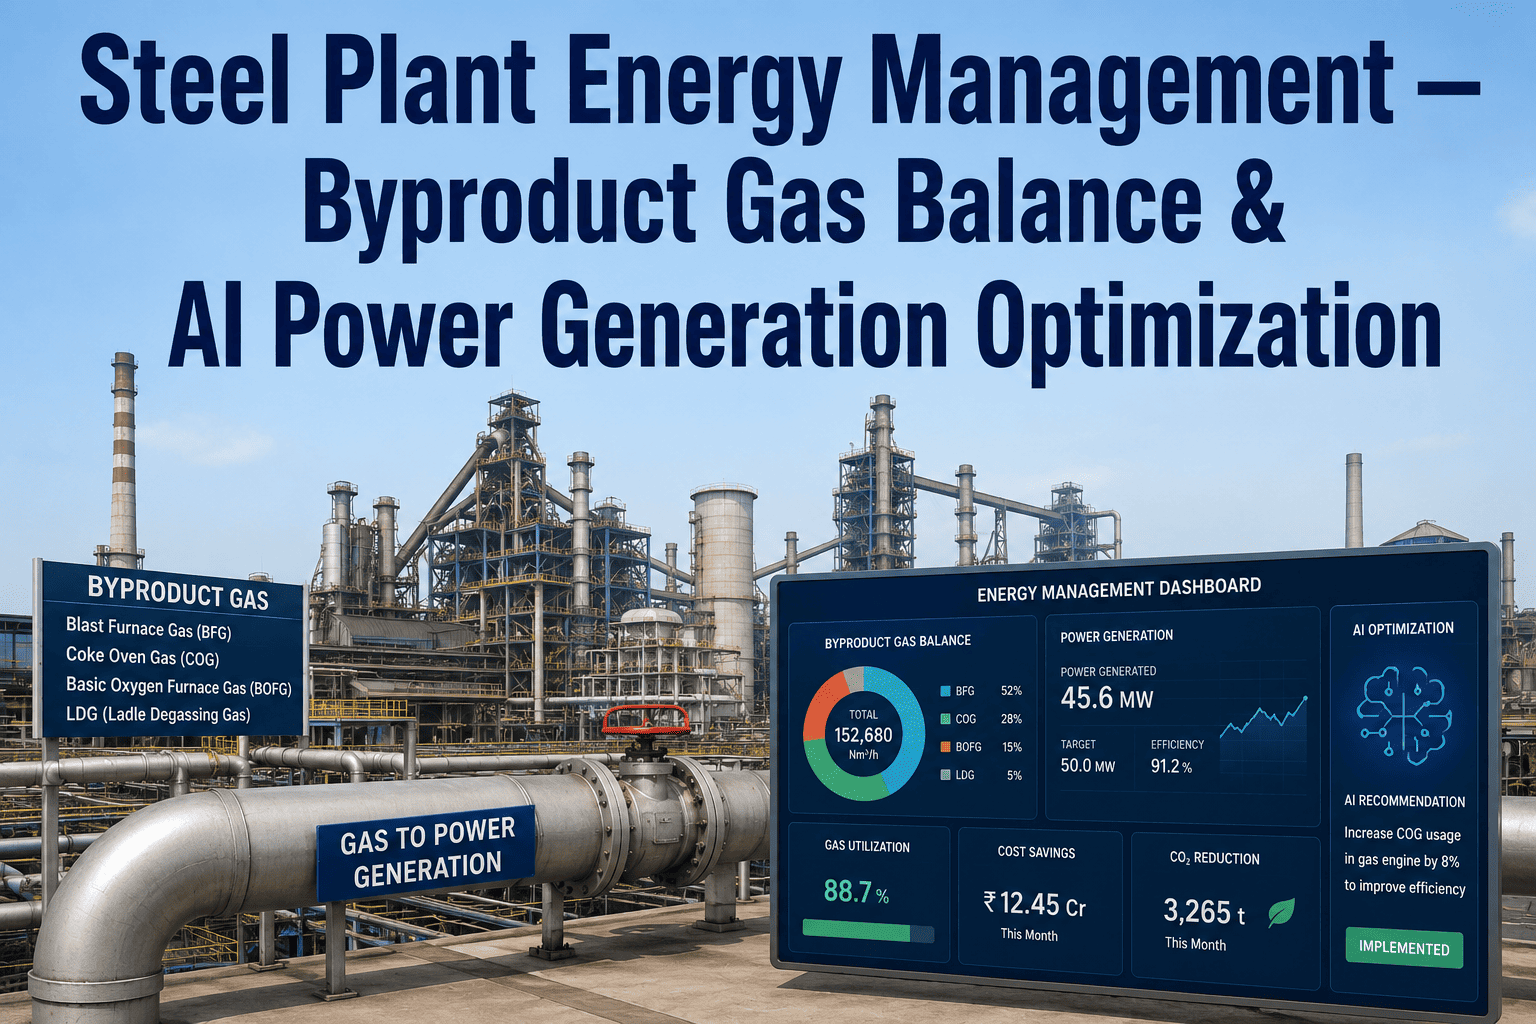
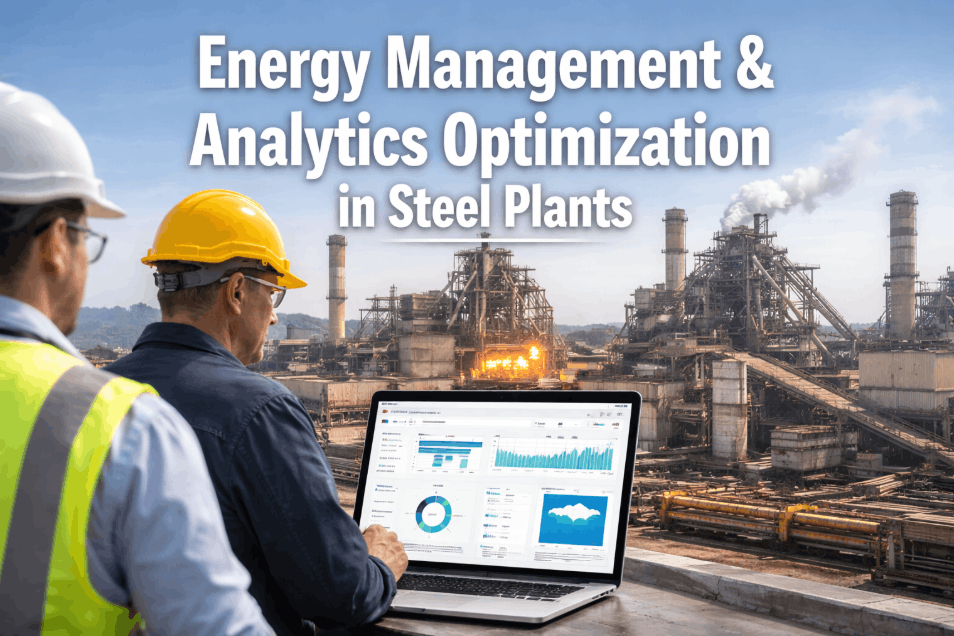
A 4.5 MTPA integrated steel plant in central India was spending ₹312 crore annually on energy — blast furnace gas, coke oven gas, converter gas, grid electricity, and natural gas — across a production route spanning blast furnaces, BOF steelmaking, continuous casting, hot strip mill, and a 210 MW captive power plant. Despite having energy meters everywhere, the plant was flying blind: gas was being flared because the balance sheet was four hours late, peak demand penalties were hitting every third month, and the SEC was consistently 8–12% above the BEE PAT target. Twelve months after deploying iFactory's AI Energy Optimization and Dashboard platform, the plant had saved ₹48.3 crore — verified by plant finance and BEE-accredited energy auditors — through systematic gas balance optimisation, electrical load scheduling, waste heat recovery maximisation, and SEC-driven operational changes across every production unit.
How an Integrated Steel Plant Saved ₹48 Cr Annually Through AI Energy Optimization
4.5 MTPA BF-BOF-HSM plant · Central India · 12-month verified results across gas balance, electrical load, WHR & SEC reduction.
Before iFactory: ₹312 Crore Energy Budget With No Real-Time Visibility
The plant had energy meters, PLC systems, and a legacy SCADA — but none of them talked to each other in real time. The gas balance was compiled manually by engineers every four hours. Peak demand was managed reactively. SEC was reported monthly. Every gap was a loss that had already happened. Schedule an energy gap assessment to see how much your plant is losing to the same visibility problem.
What iFactory Deployed — Across All Five Energy Streams
iFactory connected five AI modules across the plant's full energy infrastructure — gas balance, electrical demand, WHR, SEC tracking, and SAP integration — all operating from a unified energy dashboard visible to shift engineers, energy managers, and plant leadership simultaneously.
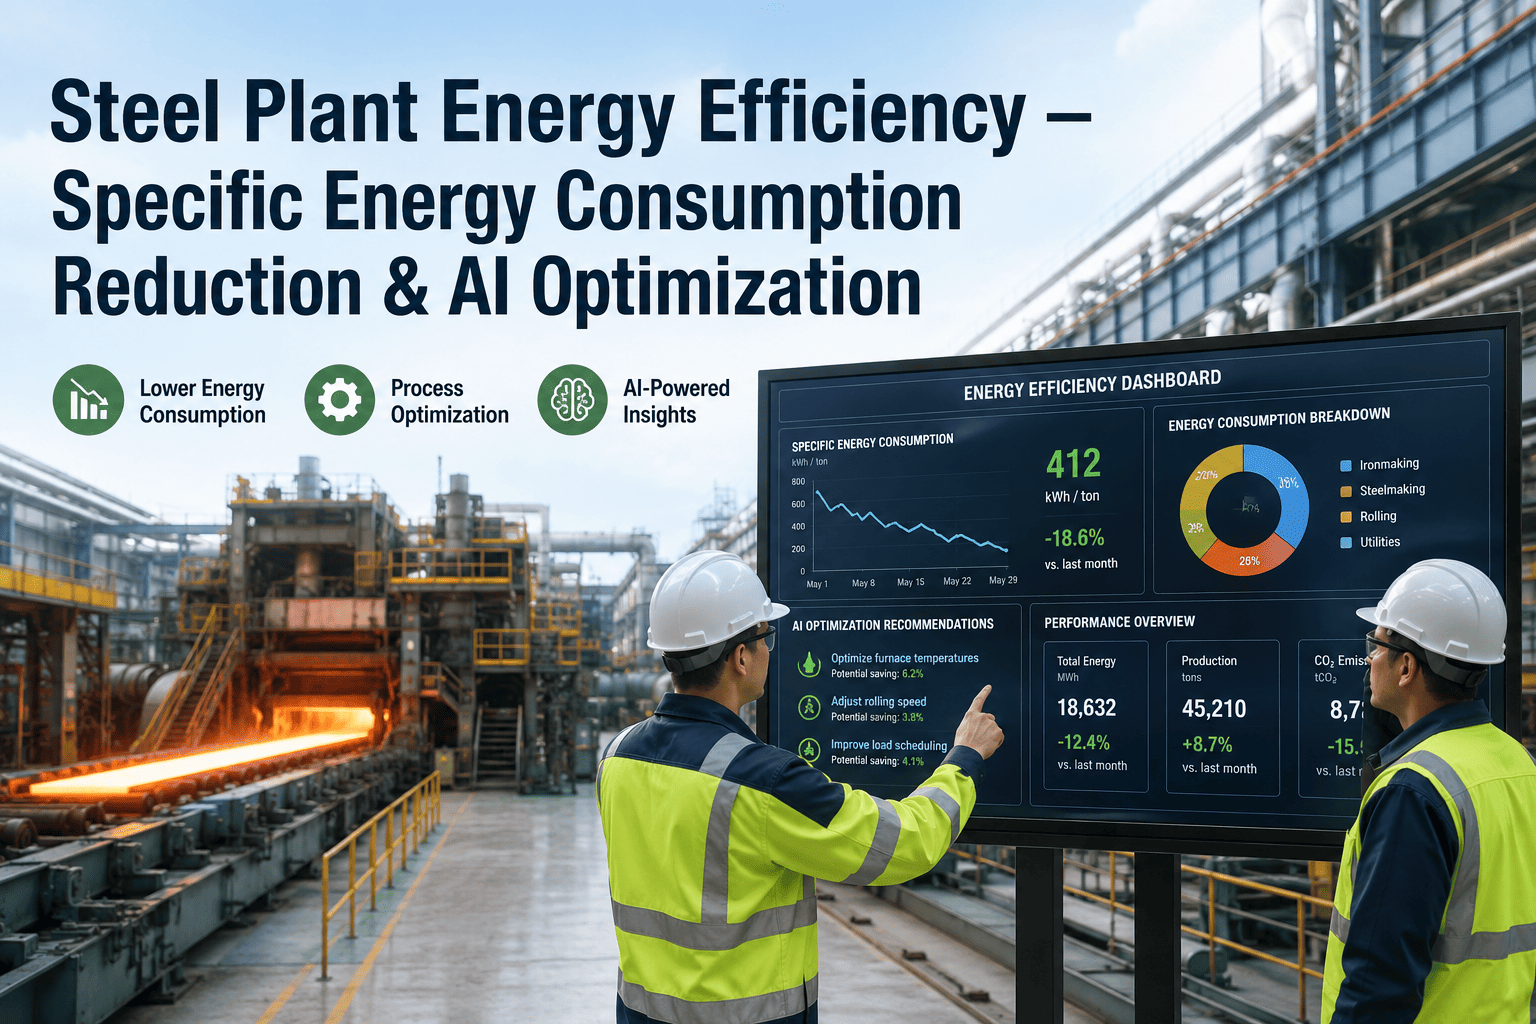
SEC Improvement — 12-Month Journey from 6.82 to 6.04 Gcal/tcs
The iFactory SEC dashboard tracked every unit's energy consumption against the BEE PAT target in real time. The AI Digital Twin identified the highest-impact interventions — reheating furnace practice, coke rate reduction, compressed air SEC — and the operations team executed them sequentially throughout the year.
Where the ₹48.3 Crore Came From — Stream-by-Stream ROI
All four savings streams verified by BEE-accredited energy auditors and plant finance leadership at Month 12. Percentages reflect share of total annual saving.
What the Plant's Energy Director Said
For years we knew we were losing energy — we just didn't know where, or how much, or when. iFactory showed us our gas balance was four hours late, our WHR system was running at 77% of design, and our peak demand was being triggered by three specific EAF charging sequences. Each of those was a fixable problem. Fixing them together was ₹48 crore.
Frequently Asked Questions
How did iFactory improve gas balance management from 4 hours to real-time?
iFactory ingests real-time BF gas, COG, and converter gas flow data via PLC — building a live gas balance updated every 15 minutes and predicting surplus/deficit 2–4 hours ahead for co-gen scheduling.
How did the AI eliminate peak demand violations?
iFactory monitors 15-minute demand windows and automatically defers deferrable loads — identified as EAF charging sequences, compressed air, and pump stations — before the 15-minute window closes and a penalty is triggered.
What was the deployment timeline before savings began?
Data integration and live dashboard were operational by Week 5. Gas balance AI and peak demand deferral went live by Week 8. Measurable savings were visible by Month 3 of the deployment.
Were the ₹48 Cr savings independently verified?
Yes. All four saving streams were verified by the plant's BEE-accredited energy auditor and finance leadership at Month 12, using energy consumption data from iFactory cross-checked against metered actuals.
Can plants with older PLC and SCADA systems still deploy iFactory?
Yes. iFactory integrates with legacy Siemens, ABB, and Honeywell PLC/SCADA systems via OPC-UA and Modbus — no hardware replacement required in most cases.
See What AI Energy Optimization Can Save Your Plant
Demo configured around your gas streams, electrical load profile, and PAT targets.