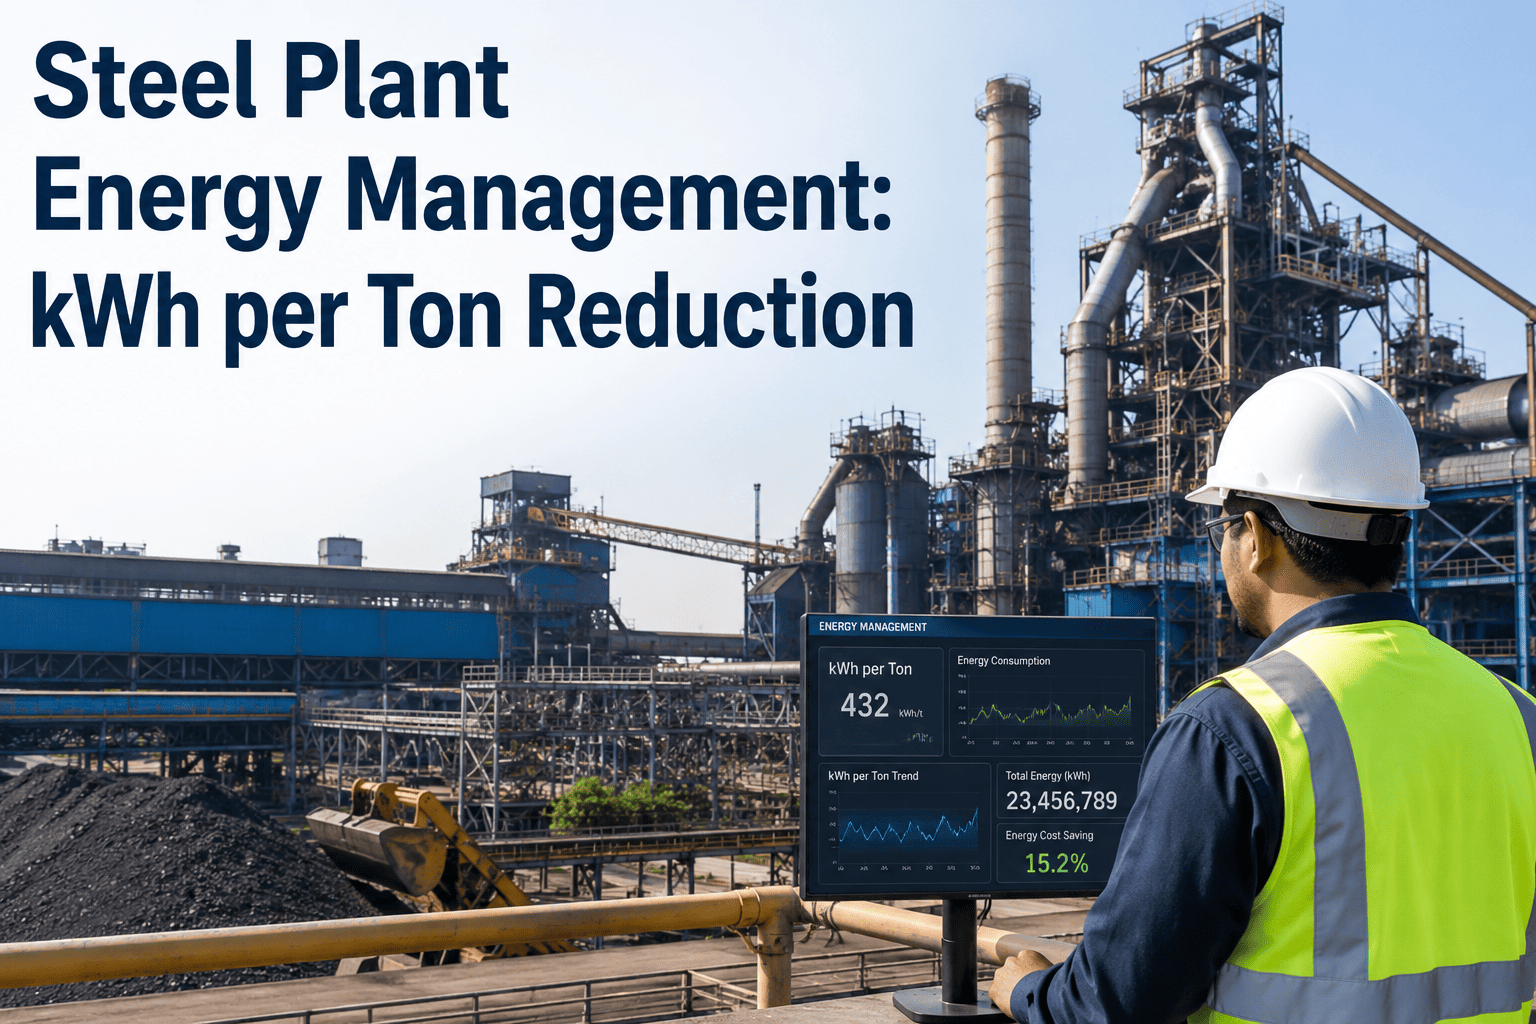
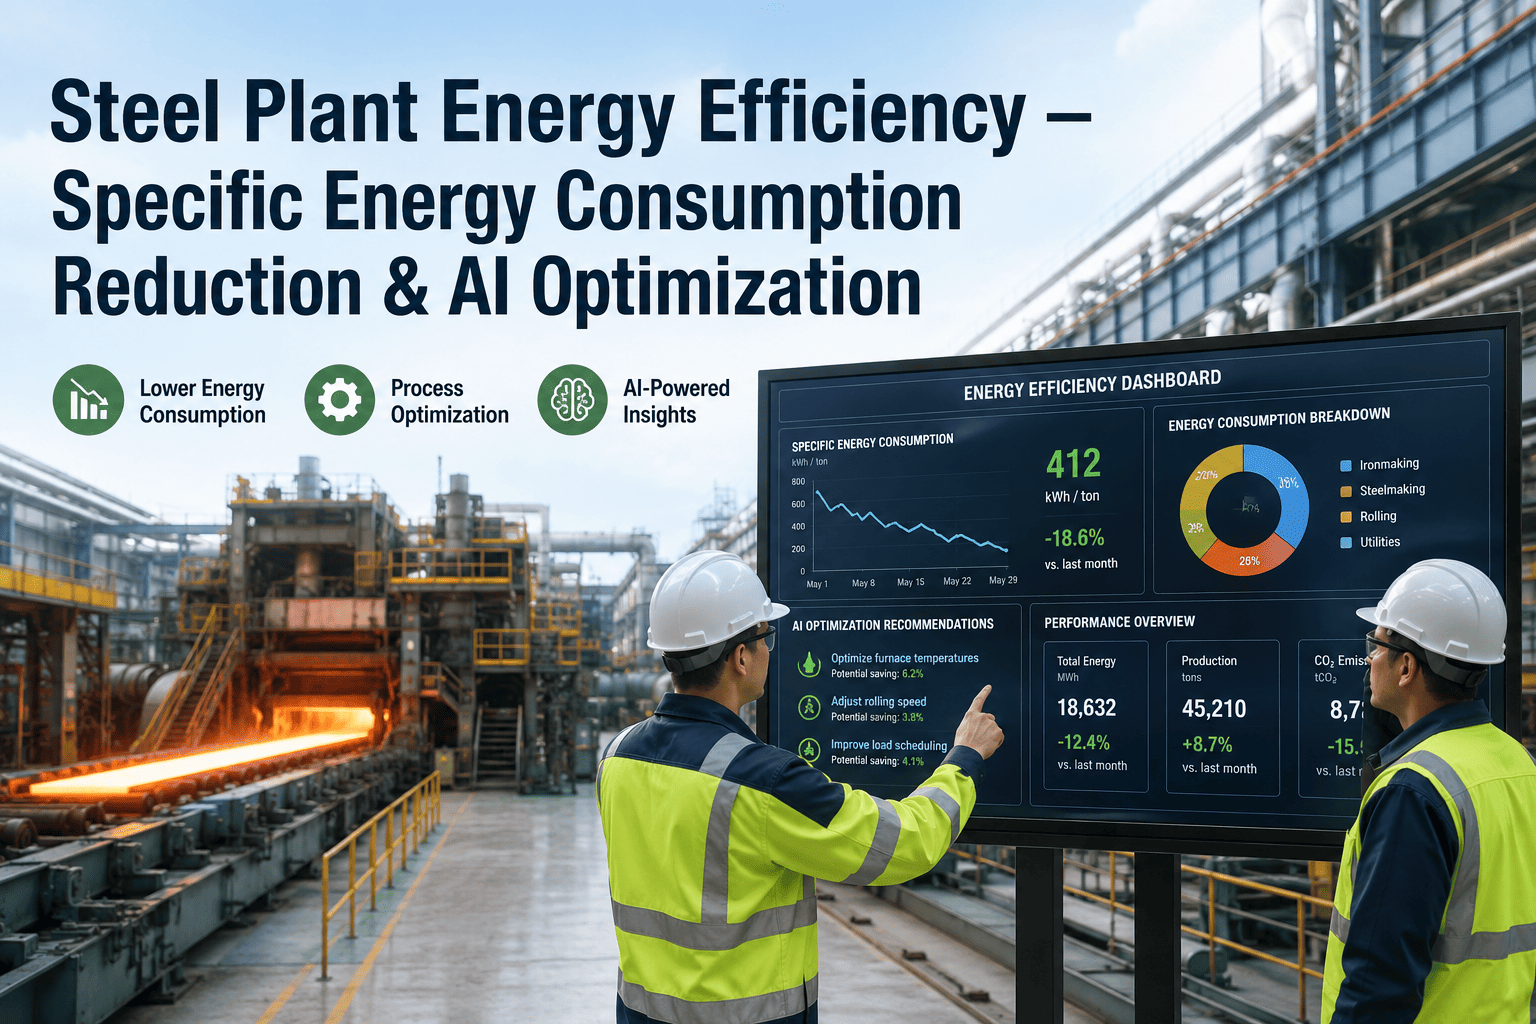
Energy is usually the second largest cost line in a steel plant after raw materials, yet most operations still manage it through a monthly utility bill review rather than tracking consumption per ton at the process level where the actual waste happens. A reheat furnace running slightly hotter than needed, a rolling mill idling between heats without cutting auxiliary load, or a compressor system fighting a leak nobody has located, all show up eventually in the bill, but by then the specific cause is long gone and the next invoice looks the same. iFactory tracks kWh per ton by process stage in real time, benchmarks it against your own historical best performance, and flags the shifts and equipment where consumption is drifting away from target. You can book a demo to see your own energy data broken down by process stage.
ENERGY MANAGEMENT · KWH PER TON · CONSUMPTION BENCHMARKING
Know Exactly Where Every Kilowatt-Hour Per Ton Is Going
iFactory breaks down energy consumption by process stage, benchmarks kWh per ton against your own historical performance and industry ranges, and flags the shifts, lines, and equipment driving cost above target.
KWH PER TON BY PROCESS STAGE, THIS WEEK VS TARGET
Electric Arc Furnace
412 vs 380
Reheat Furnace
198 vs 190
Hot Rolling Mill
64 vs 65
Finishing and Coating Line
31 vs 33
WHY THE MONTHLY BILL IS THE WRONG DASHBOARD
A Utility Invoice Explains What Happened, Not Where or Why
Reviewing a single site-wide utility bill each month tells you total spend went up, but nothing about which process stage, shift, or piece of equipment drove that change, which means every response is reactive and generic rather than targeted. Steel production is energy-intensive enough that even a small percentage improvement per ton translates into a meaningful annual figure, but finding that improvement requires visibility at a resolution most plants have never actually built.
15-20%
Typical gap between best-shift and worst-shift kWh per ton performance on the same equipment
8-12%
Energy cost reduction commonly achieved within the first year of continuous, process-level monitoring
30+ Days
Typical delay before a monthly billing review would even surface a developing consumption trend
THE AUDIT METHODOLOGY
A Structured Path From Bill Review to Continuous Monitoring
A useful energy program moves through a consistent sequence, starting with establishing where consumption actually goes and ending with continuous tracking against target, rather than jumping straight to equipment purchases before the baseline is understood.
01
Sub-Meter the Major Process Stages
Install or connect metering at the furnace, rolling, and utility system level so consumption can be attributed to a specific stage rather than the whole site.
02
Establish a kWh Per Ton Baseline
Normalize consumption against output tonnage so performance is comparable across shifts, product mixes, and seasons.
03
Identify the Highest-Variance Stages
Rank process stages by how much their kWh per ton varies shift to shift, since high variance usually points to controllable behavior, not fixed physics.
04
Prioritize and Launch Improvement Projects
Sequence projects by expected savings versus implementation effort, starting with operational fixes before capital equipment changes.
05
Monitor Continuously Against Target
Replace the periodic audit cycle with ongoing tracking so drift away from an achieved baseline gets caught immediately, not at the next scheduled review.
See Your Own Process Stages Ranked by Energy Variance
iFactory connects to your existing meters and utility data to build a kWh per ton baseline by stage, then flags where consumption is drifting above target. Book a demo and bring a recent billing cycle.
WHERE THE SAVINGS ACTUALLY COME FROM
Improvement Projects That Consistently Move the Number
Once a plant has visibility at the process level, the projects that reliably reduce kWh per ton tend to fall into a small number of recurring categories rather than requiring exotic new technology.
Idle and Standby Load Reduction
Cutting auxiliary equipment load during planned downtime between heats or shift changes, often the fastest win with no capital cost.
Furnace Setpoint Optimization
Tightening reheat and melting temperature targets to the minimum needed for the next process step rather than a conservative fixed setpoint.
Power Factor Correction
Reducing reactive power penalties on the utility bill through capacitor banks or active compensation equipment.
Motor and Drive Upgrades
Right-sizing motors and adding variable frequency drives on fans, pumps, and compressors that currently run at fixed speed regardless of load.
PERIODIC AUDIT VS CONTINUOUS MONITORING
An Annual Energy Audit Finds Yesterday's Problems
A traditional energy audit is a valuable one-time exercise, but its findings start going stale the moment production schedules, equipment condition, or raw material mix change, which happens constantly in a steel plant.
| Factor |
Periodic Energy Audit |
iFactory Continuous Monitoring |
| Frequency |
Once a year or less, often outsourced to a consultant |
Continuous, updated as new consumption data arrives |
| Resolution |
Site-wide or department-level estimates |
Process-stage and shift-level detail |
| Drift Detection |
Not detected until the next scheduled audit |
Flagged automatically against established baseline |
| Project Tracking |
Savings estimated once, rarely verified afterward |
Actual post-project performance tracked against projection |
| Cost |
Recurring consulting fees for each audit cycle |
One platform providing ongoing visibility |
WHO THIS SERVES
Any Energy-Intensive Producer Managing Cost Per Ton
Structured energy management earns its place wherever electricity or fuel cost per ton of output is large enough to matter to the bottom line, which describes most of the metals production value chain.
Electric Arc Furnace Operations
Track melting energy per ton against scrap mix and power supply configuration shift by shift.
Integrated and Reheat Operations
Monitor fuel and electricity consumption across reheat furnaces where setpoint discipline drives most of the variance.
Rolling and Finishing Lines
Benchmark auxiliary and drive system consumption against throughput to catch idle load creep.
Multi-Site Producers
Compare kWh per ton across plants on a consistent basis to prioritize capital energy projects.
FREQUENTLY ASKED QUESTIONS
Questions Energy and Operations Teams Ask First
Do we need new sub-metering hardware before we can start tracking kWh per ton by stage?
Many plants already have more metering in place than they are actively using for analysis, so the first step is usually connecting to existing meters and utility data rather than installing new hardware. Where genuine gaps exist at a critical process stage, targeted sub-metering can be added incrementally rather than requiring a full site rebuild before any visibility is possible.
Book a demo to review what your current metering already supports.
How is a fair baseline established when product mix and scrap quality change constantly?
The baseline is normalized against output tonnage and, where relevant, product mix or input material characteristics, rather than treating every ton as identical. This keeps the comparison fair between a shift processing a difficult scrap mix and one processing cleaner material, so flagged variance reflects genuine controllable difference rather than an unfair comparison.
Contact our support team to discuss baseline methodology for your product mix.
Can this help us with power factor penalties and demand charges, not just consumption?
Yes, demand charges and power factor penalties are tracked alongside consumption, since both directly affect the total energy cost line even when raw kWh usage looks unchanged. Identifying which equipment or operating pattern drives reactive power charges is often one of the faster paybacks available to an energy-intensive plant.
Book a demo to see demand and power factor tracked against your billing structure.
How long before we see enough data to prioritize our first improvement project?
Most plants see enough shift-to-shift variance within the first few weeks of connected data to identify at least one or two high-variance stages worth investigating, since energy-intensive processes generate frequent readings compared to slower-moving metrics. A more complete baseline across seasonal and product mix variation typically firms up over a full production cycle.
Contact our support team to discuss a realistic timeline for your production schedule.
Does this replace the need for a certified energy audit for incentive or rebate programs?
Continuous monitoring complements rather than replaces a certified audit where one is required for a specific incentive, rebate, or regulatory program, since those programs often have formal documentation requirements a platform alone cannot satisfy. What it does provide is the ongoing data that makes a future formal audit faster and better supported with real operating history.
Book a demo to discuss how this fits alongside a formal audit requirement.
Turn Your Energy Bill Into a Process-Level Answer
iFactory tracks kWh per ton by stage, flags drift against your own baseline, and helps you prioritize the projects that actually move the number. Book a demo and see it running on your own energy data.