Cost-per-Tonne and Margin Analytics for Steel Plants

By Vespera Celestine on June 18, 2026

ai-cost-margin-steel-plant-per-tonne

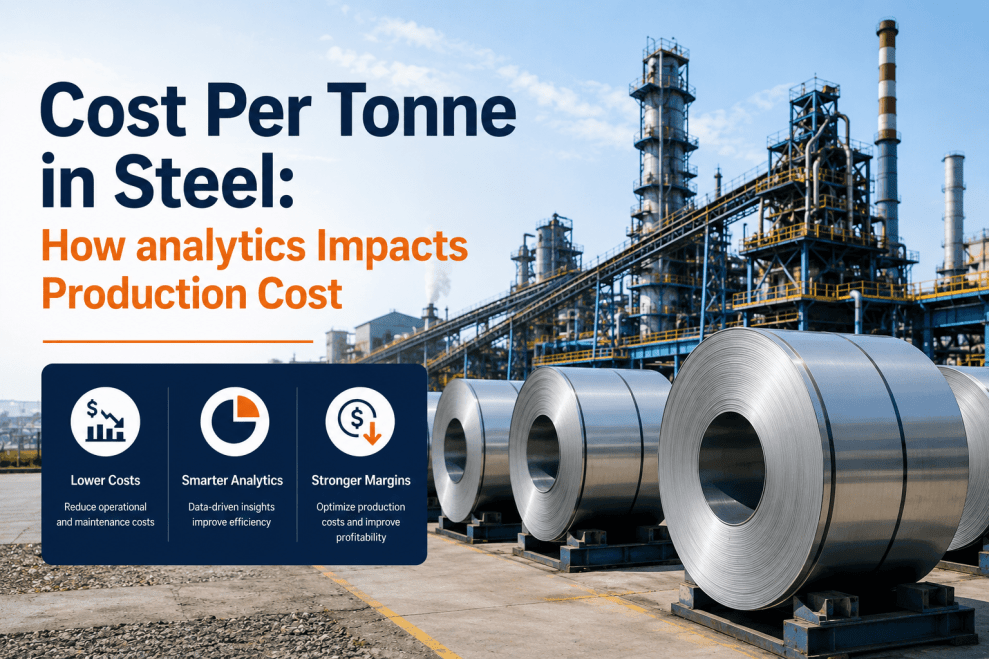
The cost-per-tonne figure on a steel plant's monthly P&L is the most reviewed and least trusted number in the financial reporting cycle — it tells the CFO what the average cost was across 200,000-plus tons of production but reveals nothing about which process areas, which cost categories, or which product grades drove the variance from budget. A plant reporting $680 per ton total cost might have a BOF alloy practice that is $4.50 per ton above standard due to unnecessary ferroalloy additions in heats that could meet specification with a leaner charge, a continuous caster yield loss that adds $6.20 per ton because of surface defect cropping that varies from 3 percent to 8 percent depending on casting speed settings, and a hot strip mill energy consumption pattern that adds $3.80 per ton when coil-to-coil idle time extends beyond 90 seconds. These process-level cost drivers represent a combined $14.50 per ton of addressable margin leakage — more than $4.3 million annually for a 300,000-ton-per-month plant — and none of them appear as line items in the traditional costing system because the data that quantifies them never crosses the boundary between process control and financial reporting. iFactory's Cost Analytics AI platform bridges this gap by ingesting process data from every production area, calculating cost-per-tonne at the process, grade, and shift level, running automated variance analysis against budgeted and standard costs, and delivering a real-time CFO dashboard that connects operational decisions to financial outcomes. CFOs and finance directors evaluating their cost analytics infrastructure can book a demo to review how the platform maps to their specific cost structure and reporting requirements.

$14.50
Addressable cost-per-tonne margin leakage hidden beneath the average plant-wide cost figure, identified and quantified by AI-driven process-level cost variance analysis
3–5%
Sustainable cost-per-tonne reduction achieved within the first 12 months of Cost Analytics AI deployment, driven by alloy mix optimization, yield improvement targeting, and variance reduction
$6.8M
Average annual cost savings realized across integrated steel plant deployments, combining raw material optimization, energy cost reduction, and conversion cost variance elimination
8–12
Weeks to deploy the Cost Analytics AI platform across all process areas with automated data ingestion from existing MES, ERP, and process control systems

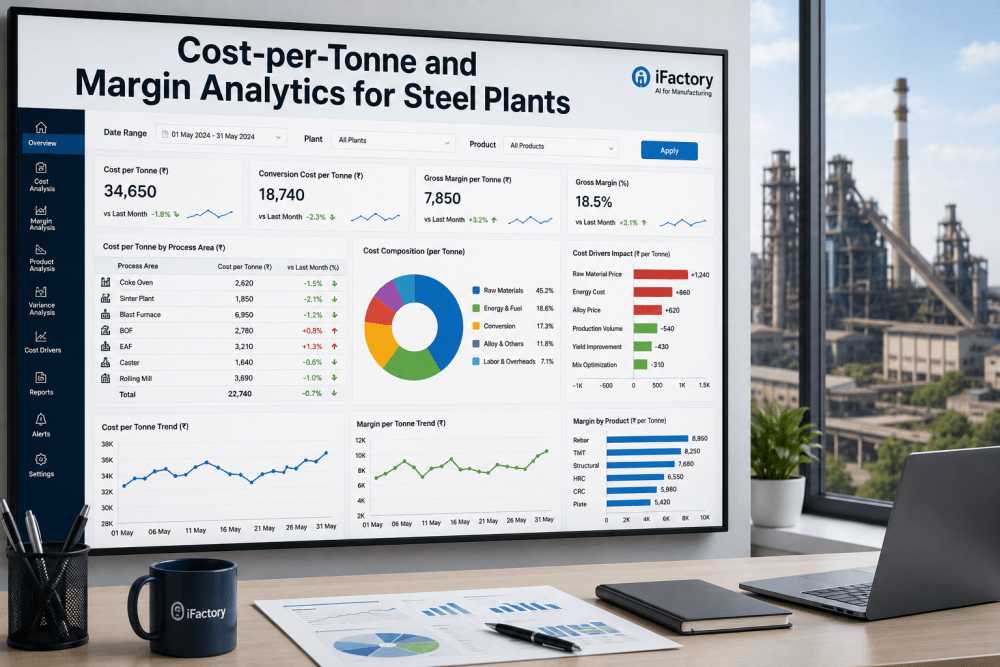
Cost-per-Tonne by Process Area — Where Margin Actually Leaks

The traditional steel plant cost model aggregates expenses into four or five high-level categories — raw materials, energy, conversion, alloys, and logistics — and reports cost-per-tonne at the plant or department level. This structure obscures the fact that each process area has a distinct cost driver profile with different variance patterns, improvement levers, and margin impact. A $10 per ton alloy cost variance in the BOF has a different root cause and different corrective action than a $10 per ton yield loss variance in the caster, but both appear in the same "above-budget" column in the departmental variance report. The Cost Analytics AI platform decomposes cost-per-tonne into process-area-level components with automated data collection from each area's production systems, enabling the finance team to see exactly where cost is accumulating and which levers will deliver the highest margin improvement. CFOs can book a demo to review a live demonstration of process-area-level cost tracking applied to their plant's data.

Raw Materials Cost
Cost Share: 52–58% of total cost per ton
Key Drivers: Iron ore grade and moisture variation, coal blend composition change, scrap mix ratio in BOF and EAF
AI Impact: Real-time scrap mix optimization reduces BOF raw material cost by $3–$5 per ton through dynamic charge calculation based on hot metal chemistry and scrap availability
Energy Cost
Cost Share: 20–25% of total cost per ton
Key Drivers: Byproduct gas utilization rate, purchased power price and demand charges, fuel oil and natural gas substitution volumes
AI Impact: AI-optimized byproduct gas balancing reduces purchased energy cost by $2–$4 per ton through minimized flaring and optimized fuel mix across boilers and furnaces
Alloy Additions Cost
Cost Share: 6–10% of total cost per ton
Key Drivers: Ferroalloy addition rates, recarburizer consumption, deoxidizer selection and yield, specification margin allowances
AI Impact: AI-driven alloy optimization reduces additions cost by $4–$7 per ton through specification-minimum targeting and dynamic adjustment based on steel chemistry prediction
Conversion Cost
Cost Share: 12–16% of total cost per ton
Key Drivers: Labor utilization, maintenance spend per ton, refractory and electrode consumption, roll and bearing wear costs
AI Impact: Predictive maintenance scheduling reduces maintenance cost per ton by 8–12 percent through condition-based replacement instead of calendar-based cycles
Yield and Quality Cost
Cost Share: 4–8% of total cost per ton (hidden)
Key Drivers: Crop loss percentage, scarfing depth and area, surface defect downgrade rate, off-grade and reject tonnage
AI Impact: AI yield optimization reduces crop loss by 1.5–3.0 percent through real-time head-and-tail crop optimization based on temperature profile prediction
Logistics and Overhead
Cost Share: 3–6% of total cost per ton
Key Drivers: Inter-plant material transport cost, inventory carrying cost, warehousing, and environmental compliance
AI Impact: Route optimization and inventory rationalization reduces logistics cost by 10–15 percent through AI-driven dispatch planning and stock-level optimization
Identify the Hidden Cost Drivers in Your Steel Plant's P&L
A 30-minute consultation with iFactory's cost analytics practice lead will map your plant's cost structure, data infrastructure, and reporting requirements against the Cost Analytics AI platform capabilities. You will receive a quantified savings estimate based on your production volumes, product mix, and current cost performance. Finance teams evaluating their cost analytics infrastructure can book a demo to see the platform applied to their specific cost structure.

AI-Driven Cost Variance Analysis — From Plant-Wide P&L to Process-Level Insight

The fundamental limitation of traditional cost variance reporting in steel manufacturing is temporal and spatial aggregation. Cost data is collected at the process level but aggregated at the department or plant level, and variances are calculated at the end of the reporting period — typically monthly. A favorable variance in one area can mask an unfavorable variance in another, and a four-week delay in variance identification means corrective action starts four weeks after the root cause began driving cost. The Cost Analytics AI platform calculates cost variances at the process-area level in real time, comparing actual cost against standard cost, budgeted cost, and trailing average cost simultaneously, and flags deviations that exceed user-defined thresholds within minutes of the production data being generated.

Traditional Cost Variance Reporting
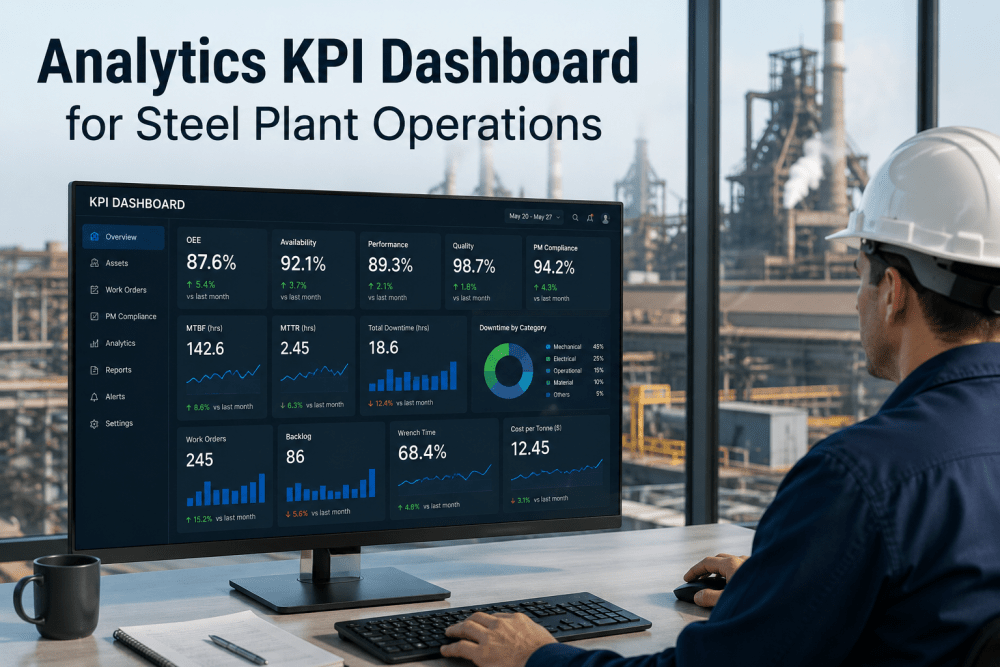
  • Monthly cost calculation at plant or department level — the CFO sees that "conversion cost" was $2.50 per ton above budget but cannot determine whether the variance came from the melt shop, caster, or rolling mill without a week of manual investigation
  • Standard costs updated annually or semi-annually — the standard cost for alloy additions assumes a fixed price for ferroalloys that may be 30 percent different from the actual market price by the time the standard is revised
  • Variance analysis performed by the finance team using ERP data — production data that explains the variance never reaches the financial system because the two systems operate on different time scales and data models
  • Root-cause investigation triggered by month-end variance reports — a $500,000 unfavorable variance identified on the fifth of the following month has a root cause that occurred 5 to 35 days earlier, making corrective action reactive and imprecise
  • Margin analysis at product-group level with average cost allocation — the margin contribution of individual product grades is obscured by averaging across all grades produced in a department
iFactory Cost Analytics AI Platform
  • Cost calculated in real time at the process-area, product-grade, and shift level — the CFO can see within 60 seconds of a heat being tapped that BOF alloy additions for grade SAE 1006 are running $4.20 per ton above standard due to higher-than-anticipated silicon content in the hot metal
  • Standard costs updated dynamically with market price feeds and process efficiency trends — the platform ingests ferroalloy market prices, energy tariffs, and scrap indices and adjusts standard costs continuously, enabling variance analysis that isolates process efficiency from input price changes
  • Process data and financial data fused in a single analytics model — production data from MES, quality data from LIMS, and cost data from ERP are reconciled in real time, with each ton of production tracked through every process stage with cumulative cost attribution
  • Variance alerts dispatched within minutes of the cost deviation occurring — a caster yield loss variance caused by a mold level sensor drift is detected and flagged during the cast, not 5 to 35 days later at month-end close
  • Margin calculated at the coil, heat, or slab level with accurate cost attribution — the profitability contribution of each individual coil is calculated with actual process-area costs, enabling the finance team to identify the most and least profitable production units

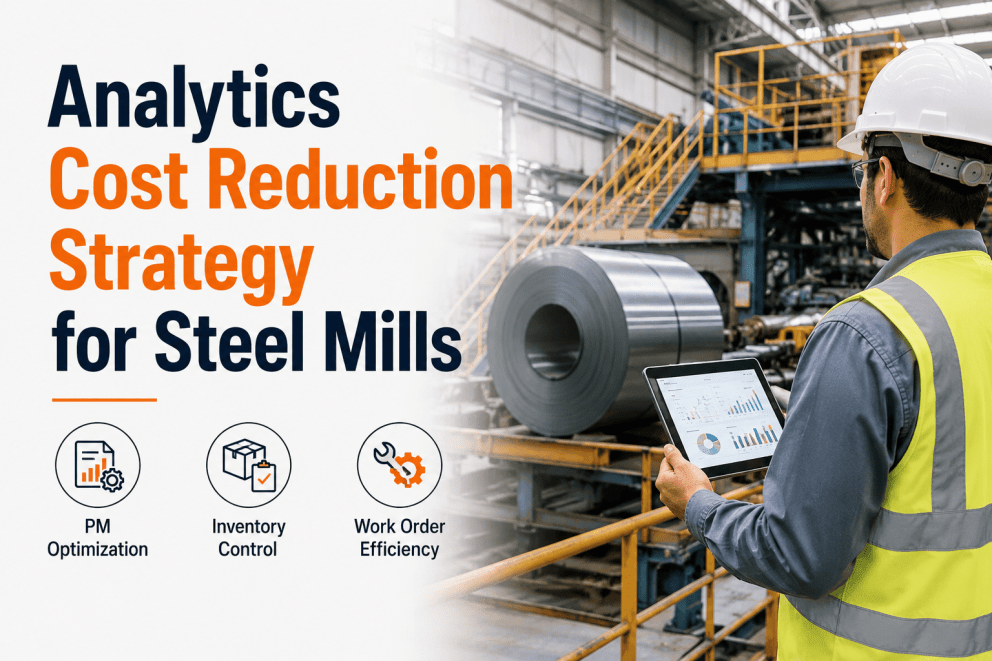
Alloy Mix Optimization and Conversion Cost Drivers

Two of the largest addressable cost categories in steel manufacturing — alloy additions and conversion costs — share a common characteristic: their efficiency depends on real-time process conditions that change faster than standard cost assumptions can track. Alloy addition costs are driven by the difference between the minimum alloy content required to meet the steel specification and the actual alloy content delivered, with the gap determined by the accuracy of the steel chemistry prediction at the point of addition. Conversion costs are driven by maintenance events, refractory campaigns, and electrode consumption rates that vary with production intensity and product mix. The Cost Analytics AI platform addresses both categories through AI models that predict chemistry outcomes, optimize addition quantities, and forecast conversion cost events before they occur. Finance and operations teams evaluating alloy cost reduction opportunities can book a demo to see how the AI models map to their specific steel grades and alloy recipes.

Cost Driver Category Current Typical Cost per Ton AI-Optimized Target Cost per Ton Primary AI Optimization Method Annual Savings at 3M Tons
Ferroalloy Additions $45–$65 $40–$58 Prediction-based specification targeting reduces safety margin from 0.06 percent to 0.02 percent for key alloying elements, saving $3–$7 per ton through reduced ferroalloy consumption without affecting mechanical property compliance. $12,000,000–$18,000,000
Recarburizer and Deoxidizer $8–$14 $6–$11 AI predicts end-point carbon and oxygen with 92 percent accuracy, reducing recarburizer and deoxidizer additions by 15–25 percent through tighter targeting of the specification window. $4,500,000–$7,500,000
Refractory and Electrode $12–$20 $10–$17 AI predicts refractory wear patterns and electrode consumption rates based on production intensity, enabling optimized replacement scheduling and reducing refractory cost by 8–12 percent. $3,000,000–$5,000,000
Maintenance Spend $18–$28 $14–$24 Condition-based maintenance driven by AI anomaly detection reduces emergency maintenance events by 40 percent and planned maintenance cost by 15 percent through optimized intervention timing. $6,000,000–$10,000,000
Yield and Crop Loss $22–$35 $18–$30 Real-time crop optimization based on temperature profile prediction reduces head and tail crop length by 1.5–3.0 percent, and AI defect classification reduces downgrade rates by identifying root causes during production. $5,500,000–$9,000,000
Energy and Fuel $50–$70 $44–$62 AI-optimized byproduct gas balance, reheat furnace temperature profiling, and demand response participation reduce purchased energy cost by 8–12 percent across all process areas. $8,000,000–$14,000,000
Quantify Your Plant's Cost Optimization Potential
iFactory's Cost Analytics AI platform is deployed and validated across integrated and mini-mill steel plants, delivering measurable cost-per-tonne reduction through AI-driven alloy optimization, conversion cost management, and real-time variance analysis. Speak with an iFactory cost analytics practice lead about your production volumes, product mix, and current cost performance. Speak with an iFactory cost analytics practice lead or book a demo to review a margin simulation tailored to your production mix and market prices.

Real-Time Margin Simulation and CFO Dashboard

The Cost Analytics AI platform combines process-level cost data with market price feeds, production scheduling data, and customer order information to deliver a real-time margin simulation capability that enables the CFO and commercial team to evaluate what-if scenarios — "what is the margin impact of switching from Grade A to Grade B on the next caster sequence given current ferroalloy prices and the customer's specification tolerance?" or "how much margin would we recover by increasing billet purchases by 10,000 tons per month and reducing EAF production given current scrap pricing and power tariffs?" — using the plant's actual cost data rather than average assumptions. The four-stage optimization pipeline below describes how the platform converts process data into actionable financial intelligence.

01
Cost Data Ingestion and Attribution
Process-level cost data from MES, ERP, LIMS, and energy management systems is ingested continuously, with each ton of production attributed to its actual raw material cost, energy consumption, alloy additions, and conversion expense. Cost attribution follows the physical flow of material through each process stage, capturing cumulative cost at every step from ironmaking to finished coil.
02
Variance Detection and Root-Cause Assignment
The AI engine compares actual cost against standard cost, budgeted cost, and trailing average cost at the process-area, grade, and shift level. Variances exceeding user-defined thresholds are flagged with the specific cost driver, process parameter, and time window. The system distinguishes between price-driven variances (input material cost changes) and efficiency-driven variances (consumption rate changes).
03
Margin Calculation at Coil, Heat, and Slab Level
For every production unit, the platform calculates margin as revenue (based on the customer order price or spot market price) minus actual attributed cost. Margin is displayed in absolute dollars per unit and dollars per ton, with drill-down to the cost driver breakdown. The platform ranks production units by margin contribution, identifying the most and least profitable products, customers, and production campaigns.
04
Scenario Simulation and Commercial Decision Support
The what-if engine allows the CFO to model margin impact of production mix changes, input price scenarios, customer order acceptance decisions, and capital investment proposals. Each scenario returns the expected margin impact with confidence intervals based on the plant's historical cost variability, enabling data-driven commercial decisions that maximize profitability.
3–5%
Cost-per-Tonne Reduction
Measured reduction in total cost per ton across integrated steel plants within 12 months of Cost Analytics AI deployment, driven by alloy optimization, yield improvement, and variance elimination.
$6.8M
Average Annual Cost Savings
Combined annual savings from alloy additions optimization, energy cost reduction, maintenance cost optimization, and yield improvement across fully deployed steel plant implementations.
92%
Chemistry Prediction Accuracy
AI model accuracy for predicting end-point steel chemistry at the alloy addition point, enabling specification-minimum targeting that reduces alloy cost without compromising mechanical property compliance.
40%
Emergency Maintenance Reduction
Reduction in unplanned maintenance events through AI-driven condition monitoring and predictive maintenance scheduling, reducing conversion cost variance from maintenance-related production losses.
1.5–3%
Yield Improvement
Reduction in crop loss and downgrade rates achieved through AI-optimized head-and-tail crop management and real-time defect classification, directly reducing cost per saleable ton.
8–12
Weeks to Platform Deployment
Phased deployment timeline from data integration and system connectivity to first cost variance alert and CFO dashboard activation, enabling the finance team to begin realizing value within the first quarter.
Phase 1
Data Integration and Cost Baseline
MES, ERP, LIMS, and process control systems connected. Material flow and cost attribution model configured. Historical cost baseline established — 3-5 weeks
Phase 2
Variance Analytics Activation
Real-time cost variance detection live across all process areas. Standard cost baselines configured per grade. Automated variance alert rules established — 5-8 weeks
Phase 3
Optimization and Margin Simulation
Alloy optimization models active. Margin dashboard deployed to CFO and commercial team. Scenario simulation engine configured for commercial decision support — 8-12 weeks
$6.8M
Average Annual Savings
Typical total annual cost savings across alloy optimization, energy reduction, maintenance optimization, and yield improvement

Expert Perspective — Cost Analytics in Steel Manufacturing Finance

In 22 years as a steel industry CFO, I have never met a plant that actually knew its cost-per-tonne with process-level accuracy. Every plant I have worked with reported cost at the department level with allocations that obscured the real cost drivers. A BOF shop showing $380 per ton total cost might have had a 15 percent scrap ratio variance that was buried in the average, or a caster showing $45 per ton conversion cost might have had a mold powder consumption variance that added $2.50 per ton without anyone in finance knowing. The Cost Analytics AI platform changed this fundamentally by connecting process data to the cost model in real time. For the first time in my career, I could see the cost impact of a BOF lance practice change within the same shift, track the margin contribution of individual customer orders by coil, and give the commercial team the data they needed to walk away from unprofitable business. The 4.2 percent cost-per-tonne reduction we achieved in the first year was significant, but the real value was in the commercial decisions we made with accurate margin visibility — we dropped 12,000 tons of negative-margin business and replaced it with profitable orders, which added more to the bottom line than the cost reduction itself.
Vice President of Finance — Integrated Steel Producer
22 Years in Steel Industry Financial Management and Cost Accounting
The alloy cost optimization alone justified the platform investment within the first six months. We were running our BOF with a ferroalloy safety margin that averaged 0.07 percent above the minimum specification requirement — a practice developed over years of conservative process management that was adding $6.80 per ton in unnecessary alloy cost. The finance team had never identified this because the standard cost assumed a fixed alloy addition rate, and the actual addition rate appeared in the process data that the finance system never saw. When the Cost Analytics platform connected the process data to the cost model, the $6.80 per ton variance was visible within the first week. We worked with the operations team to reduce the safety margin to 0.03 percent using the AI chemistry prediction model, which maintained 100 percent specification compliance while reducing alloy cost by $4.10 per ton. That is $12.3 million per year at our production volume, and it came from connecting data that already existed in two separate systems — the finance team just needed a platform that could bring it together.
Director of Cost Accounting — Integrated Steel Producer
15 Years in Steel Cost Management and Financial Planning

Conclusion: Process-Level Cost Visibility Is the Foundation for Steel Plant Profitability Management

The steel industry operates on margin measured in tens of dollars per ton, where a $5 per ton cost advantage or disadvantage determines whether a plant is profitable in a downcycle or bleeding cash. Traditional cost accounting — with its monthly reporting cycles, department-level aggregation, and separation between process data and financial data — cannot provide the cost visibility that CFOs need to manage margin at the level of precision that the market demands. The Cost Analytics AI platform solves this structural problem by connecting process data to financial outcomes in real time, calculating cost-per-tonne at the process, grade, and shift level with automated variance analysis, AI-driven optimization of alloy additions and conversion costs, and margin simulation that enables data-driven commercial decisions. For CFOs and finance directors evaluating their cost analytics infrastructure, the path forward is clear: the data needed to understand actual cost-per-tonne already exists in the plant's MES, ERP, and process control systems — the missing piece is the platform that brings it together and delivers financial intelligence at the speed of production.

Frequently Asked Questions

The platform connects via API to major ERP systems including SAP, Oracle, and Microsoft Dynamics for financial data, and via OPC-UA, Modbus, or MES API for process data. No system replacement is required. Typical data integration is completed within three to five weeks.
Yes. The platform supports grade-level cost modeling with separate standard costs, alloy recipes, conversion cost rates, and yield factors for each product grade. Cost variance and margin are calculated per grade and aggregated by product family and customer.
The platform ingests real-time market prices for key inputs including ferroalloys, scrap, energy, and consumables. Variance decomposition separates the portion attributable to input price changes from the portion attributable to consumption rate changes, enabling targeted corrective action.
Most integrated steel plants achieve full platform ROI within 6 to 9 months of deployment. Alloy cost optimization typically delivers the fastest payback, followed by yield improvement and maintenance cost reduction. Plants with existing data integration infrastructure often achieve positive ROI within 4 months.
Yes. The scenario simulation engine allows users to model margin impact of production mix changes, input price scenarios, customer order acceptance, and capital investment proposals. Results include confidence intervals based on the plant's historical cost variability and production data.
Deploy Cost Analytics AI Across Your Steel Plant
iFactory's Cost Analytics AI platform is deployed and validated across integrated and mini-mill steel plants, delivering real-time cost-per-tonne visibility, AI-driven alloy optimization, automated variance analysis, and CFO-level margin simulation. Speak with an iFactory cost analytics practice lead about your production volumes, current cost structure, and financial reporting requirements.
3-5% Cost Reduction
$6.8M Annual Savings
92% Chemistry Accuracy
8-12 Week Deployment
6-9 Month ROI

Share This Story, Choose Your Platform!