A steel plant maintenance department that cannot measure its performance cannot improve it. Yet most plant maintenance teams operate with fragmented reporting — MTBF calculated on some assets, OEE tracked for some lines, maintenance cost reported monthly in a spreadsheet, and PM compliance measured by a different system than work orders. The result is a leadership team making asset investment decisions without reliable data, and a maintenance team working hard without knowing whether they are making measurable progress. iFactory's KPI Dashboard and Analytics platform consolidates every maintenance performance metric — MTBF, MTTR, OEE, PM compliance rate, maintenance cost per tonne, reactive-to-planned ratio, and 40+ additional KPIs — into a single real-time dashboard that updates from SAP PM work order completions, sensor data, and production system feeds automatically.
Steel Plant Maintenance KPI Dashboard: MTBF, MTTR, OEE & Cost Metrics
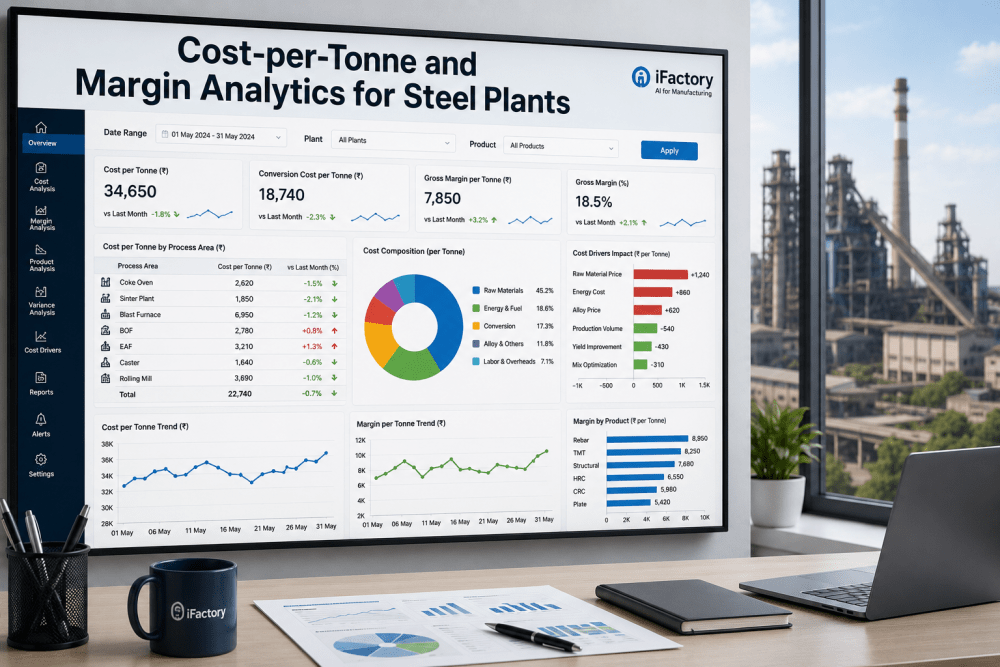
Real-time MTBF, MTTR, OEE, PM compliance, maintenance cost per tonne & reactive-to-planned ratio — all calculated automatically from SAP PM data and displayed in iFactory's unified KPI dashboard.
The Eight Core Maintenance KPIs — Definitions, Formulas & Steel Industry Benchmarks
These eight KPIs form the foundation of any steel plant maintenance performance framework. iFactory calculates each automatically from SAP PM data, sensor feeds, and production records — no manual entry, no spreadsheet aggregation. Schedule a KPI benchmarking session to compare your plant's current performance against world-class targets.
| KPI | Formula | World Class Target | Industry Average | iFactory Source |
|---|---|---|---|---|
MTBFMean Time Between Failures |
Total uptime ÷ Number of failures | >2,000 hrs (critical assets) | 800–1,200 hrs | SAP PM breakdown orders |
MTTRMean Time To Repair |
Total repair time ÷ Number of repairs | <2 hrs (critical assets) | 4–8 hrs | SAP PM work order duration |
OEEOverall Equipment Effectiveness |
Availability × Performance × Quality | >85% world class | 55–65% | SCADA + quality + production |
PM CompliancePlanned Maintenance Rate |
PM completed on time ÷ PM scheduled × 100 | >95% | 60–75% | SAP PM order completion |
Maint. Cost/TonneMaintenance Cost per tonne |
Total maint. cost ÷ Steel produced (tonnes) | ₹180–220/tonne | ₹380–480/tonne | SAP CO + production data |
Reactive RatioReactive-to-Planned Work |
Reactive hours ÷ Total maintenance hours | <10% reactive | 35–55% reactive | SAP PM order type split |
Wrench TimeDirect Work Efficiency |
Direct hands-on time ÷ Total shift time | >55% wrench time | 25–35% | iFactory mobile time tracking |
Backlog (Weeks)Work Order Backlog |
Open work order hours ÷ Maint. team capacity/wk | 2–4 weeks | 8–16 weeks | SAP PM open order queue |
OEE Decomposition — Availability × Performance × Quality Live in iFactory
OEE is the product of three independent metrics. A plant achieving 76% OEE may be losing primarily to Availability (breakdowns), Performance (speed loss), or Quality (defects) — and each requires a completely different corrective action. iFactory shows all three in real time so the right team is working on the right problem.
iFactory KPI Dashboard — Six Live Panels, Zero Manual Entry
Every KPI in the iFactory dashboard is calculated automatically from source system data — SAP PM, SCADA, production MES, and iFactory's own sensor and work order system. No spreadsheets, no manual aggregation, no end-of-month reporting delay. Schedule a live dashboard demo to see your plant's own KPIs in iFactory within 2 weeks.
MTBF and MTTR by asset, equipment class, and area — with trend line vs 90-day baseline. Failure frequency heat map by equipment tag. Top-10 repeat failure list with downtime cost per asset.
OEE by shift, line, and equipment type — decomposed into Availability, Performance, and Quality. Pareto of OEE losses by category. Target vs actual waterfall chart per production area.
PM compliance rate by week, department, and equipment class. Overdue PM list with escalation status. PM schedule adherence trend — 13-week rolling chart. Auto-escalation to department head at 80% compliance.
Maintenance cost per tonne — vs budget, vs prior period, vs world-class benchmark. Labour vs material vs contractor split. Top-20 highest-cost assets by cumulative maintenance spend. Emergency vs planned cost ratio.
Reactive-to-planned work order ratio by department, shift, and equipment class. Week-on-week trend — target trajectory to <10% reactive. Emergency work order cause analysis by failure mode category.
Wrench time by team and shift. Backlog in weeks with trend and capacity projection. Work order backlog age distribution — how many orders are >4 weeks old. Training compliance rate by department.
KPI Performance — Before vs After iFactory Dashboard at a 3.6 MTPA Plant
Results from a 3.6 MTPA integrated plant after 18 months using iFactory KPI Dashboard — verified by plant finance and maintenance director. All KPIs calculated from the same SAP PM data source before and after.
| KPI | Before iFactory | After 18 Months | Improvement |
|---|---|---|---|
| MTBF — critical assets | 840 hrs | 1,680 hrs | +100% |
| MTTR — critical assets | 6.4 hrs | 2.8 hrs | −56% |
| OEE — rolling mill | 58% | 76% | +18pp |
| PM compliance rate | 62% | 94% | +32pp |
| Maintenance cost / tonne | ₹440/tonne | ₹262/tonne | −41% |
| Reactive work ratio | 48% | 14% | −34pp |
| Work order backlog | 11.2 weeks | 3.1 weeks | −72% |
What a VP Maintenance Said
Before iFactory, our monthly KPI report took 3 engineers 4 days to compile from SAP exports, Excel files, and SCADA screenshots. By the time the report was published, the data was already 2 weeks old. Now the same KPIs update every hour on the dashboard. In the first 6 months, we identified and eliminated 4 chronic failure patterns that had been invisible in our monthly reporting — simply because we could finally see them in real time.
Frequently Asked Questions
How does iFactory calculate MTBF and MTTR automatically from SAP PM?
iFactory reads SAP PM breakdown notification creation timestamps (failure start), PM order technical completion timestamps (repair end), and equipment functional location hierarchy to calculate MTBF and MTTR per asset, equipment class, and plant area — updated automatically whenever a breakdown order is completed in SAP, with no manual data entry required.
What is a realistic OEE target for an integrated steel plant, and how is it decomposed?
World-class OEE for continuous steel processes is 85%+, but most Indian integrated plants operate at 55–65%. iFactory decomposes OEE into Availability (uptime vs planned production time), Performance (actual vs theoretical throughput rate), and Quality (good product vs total product) — pulling each component from SCADA, MES, and quality systems separately so the right corrective action targets the right loss category.
Can iFactory benchmark our plant's KPIs against industry peers?
Yes. iFactory's benchmark database contains anonymised KPI ranges from 80+ steel plants across India and Southeast Asia — segmented by plant size (MTPA), technology type (BF-BOF, EAF, sponge iron), and product mix. Each KPI in the dashboard shows the plant's current value against the percentile range for comparable plants, so leadership can see whether they are in the top, middle, or bottom quartile on each metric.
How quickly can iFactory go live with KPI dashboards connected to our SAP PM system?
SAP PM RFC/BAPI connection, data extraction configuration, and initial dashboard go-live typically takes 3–4 weeks for a standard SAP ECC or S/4HANA environment. First KPI dashboard with MTBF, MTTR, PM compliance, and backlog is live in Week 3 — OEE and cost panels requiring MES and CO integration follow in Weeks 5–8.
See Your Plant's KPIs Live in iFactory — In 3 Weeks
Demo built around your SAP PM configuration, KPI priorities, and benchmark targets.