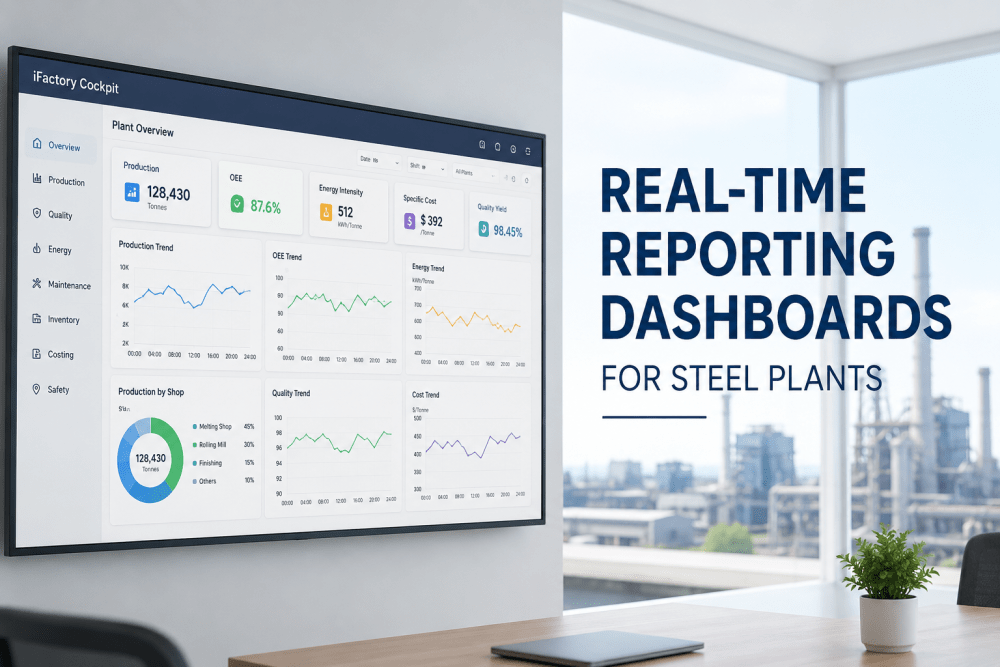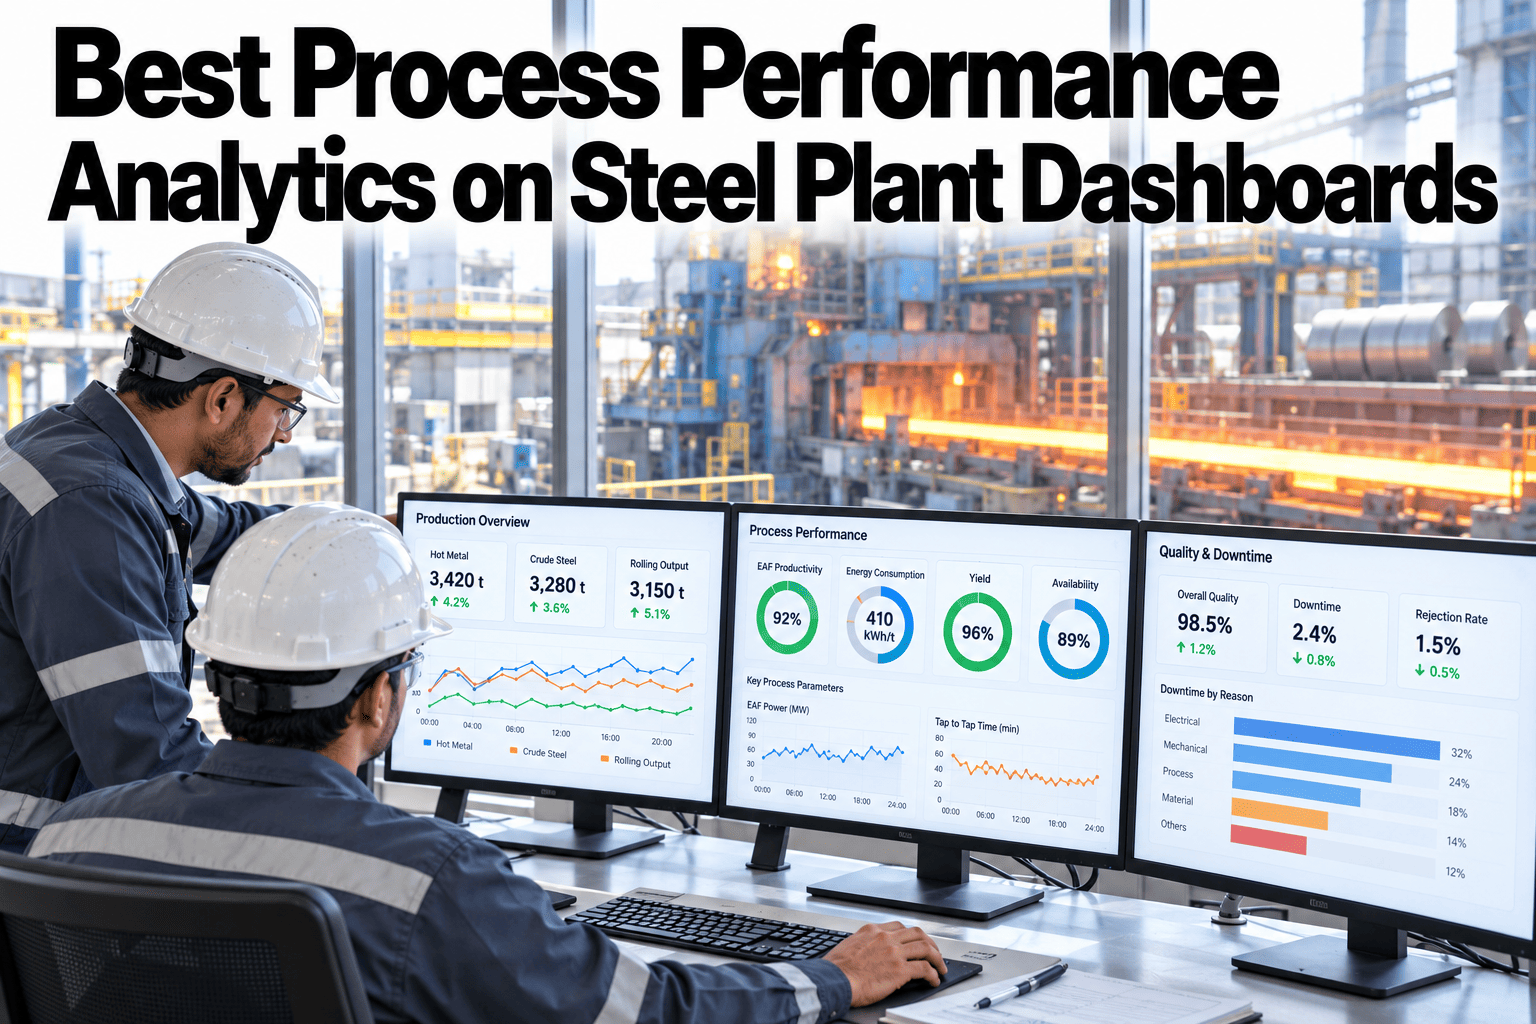
A steel plant can know its overall OEE and still have no idea which shop is actually dragging it down. Plant-wide averages are good for a headline number and almost useless for deciding where to send an engineer on a Tuesday morning. This guide covers building process performance analytics that show OEE, yield, availability and quality per shop, with a clear path down to the root cause behind any one of them. Teams ready to get shop-level visibility can book a demo with the iFactory AI team.
Best Process Performance Analytics on Steel Plant Dashboards
OEE, yield, availability and quality, shown per shop rather than as one plant average, with a clear drilldown path from any weak number down to the event behind it.
Why a Plant Average Hides the Real Problem
In the illustrative grid above, the plant-wide OEE might look like a reasonable 76 percent, a number that would not alarm anyone in a leadership review. The rolling mill sitting at 61 percent, dragged down mainly by availability, tells a completely different story, and it is the one worth acting on.
One blended number
Smooths over a weak shop with a strong one, leaving leadership with a comfortable but uninformative figure.
Four numbers, every shop
Shows exactly where to send attention first, and which specific metric is driving the gap.
The Four KPIs and What Each One Isolates
OEE is a single blended score, but each of its components points to a different kind of problem, and knowing which one is weak changes what action makes sense.
| KPI | What It Isolates | Typical Response |
|---|---|---|
| Availability | Downtime, planned and unplanned | Maintenance scheduling, changeover review |
| Yield | Material lost to scrap or rework | Process parameter review, material quality check |
| Quality | Output meeting specification | Inspection and process control review |
| OEE | The combined effect of all three | A starting point, not an endpoint, for investigation |
Drilldown From Shop to Root Cause
A weak number on the grid is a starting point, not an answer. The real value of per-shop analytics is the path it opens down to the specific event behind the number.
See Which Shop Actually Needs Attention
iFactory AI shows OEE, yield, availability and quality per shop, with a clear drilldown to root cause. Book a 30-minute walkthrough.
Line of Sight for Different Audiences
The same per-shop data supports very different conversations depending on who is looking at it, from a shift supervisor planning the next few hours to a plant manager planning the next quarter.
Plain-Language Glossary
A shared vocabulary keeps operations, engineering and leadership reading the same performance data the same way.
Expert Review
Plant engineers who have rolled out per-shop analytics across steel plants keep returning to the same two notes.
Watch the gap, not just the number
A shop at 61 percent OEE that has been stable there for a year tells a different story than one that dropped from 85 percent last month. The trend matters as much as the current value.
Keep the grid to four KPIs
Adding more metrics to the summary grid tends to dilute attention rather than add insight. Keep the top-level view to OEE, yield, availability and quality, and push everything else into the drilldown.
Frequently Asked Questions
How is OEE different from availability on its own?
OEE combines availability with performance and quality into one score, while availability alone isolates just the downtime component. Seeing both together shows whether downtime or another factor is driving the result. Book a demo to see all four metrics together.
Can this work if our shops use different legacy systems?
Yes, provided the underlying data is connected and aligned to a shared asset hierarchy, similar to the master data groundwork used in other connected analytics projects. Ask support which systems are commonly connected.
How often should the shop-level grid be reviewed?
A daily glance catches acute issues, while a weekly deeper review is where trend and root cause work usually happens.
Can the drilldown reach all the way to a single event?
Yes, the path is designed to go from the summary grid down to the individual downtime or quality event behind any weak number. Book a demo to see a full drilldown example.
Does this replace our existing MES reporting?
No, it sits above existing systems as an analytics layer, pulling from the same underlying data rather than replacing the systems that generate it.
Find the Shop That Actually Needs Attention
iFactory AI shows OEE, yield, availability and quality per shop, with a direct path to root cause. Book a walkthrough built around your plant.