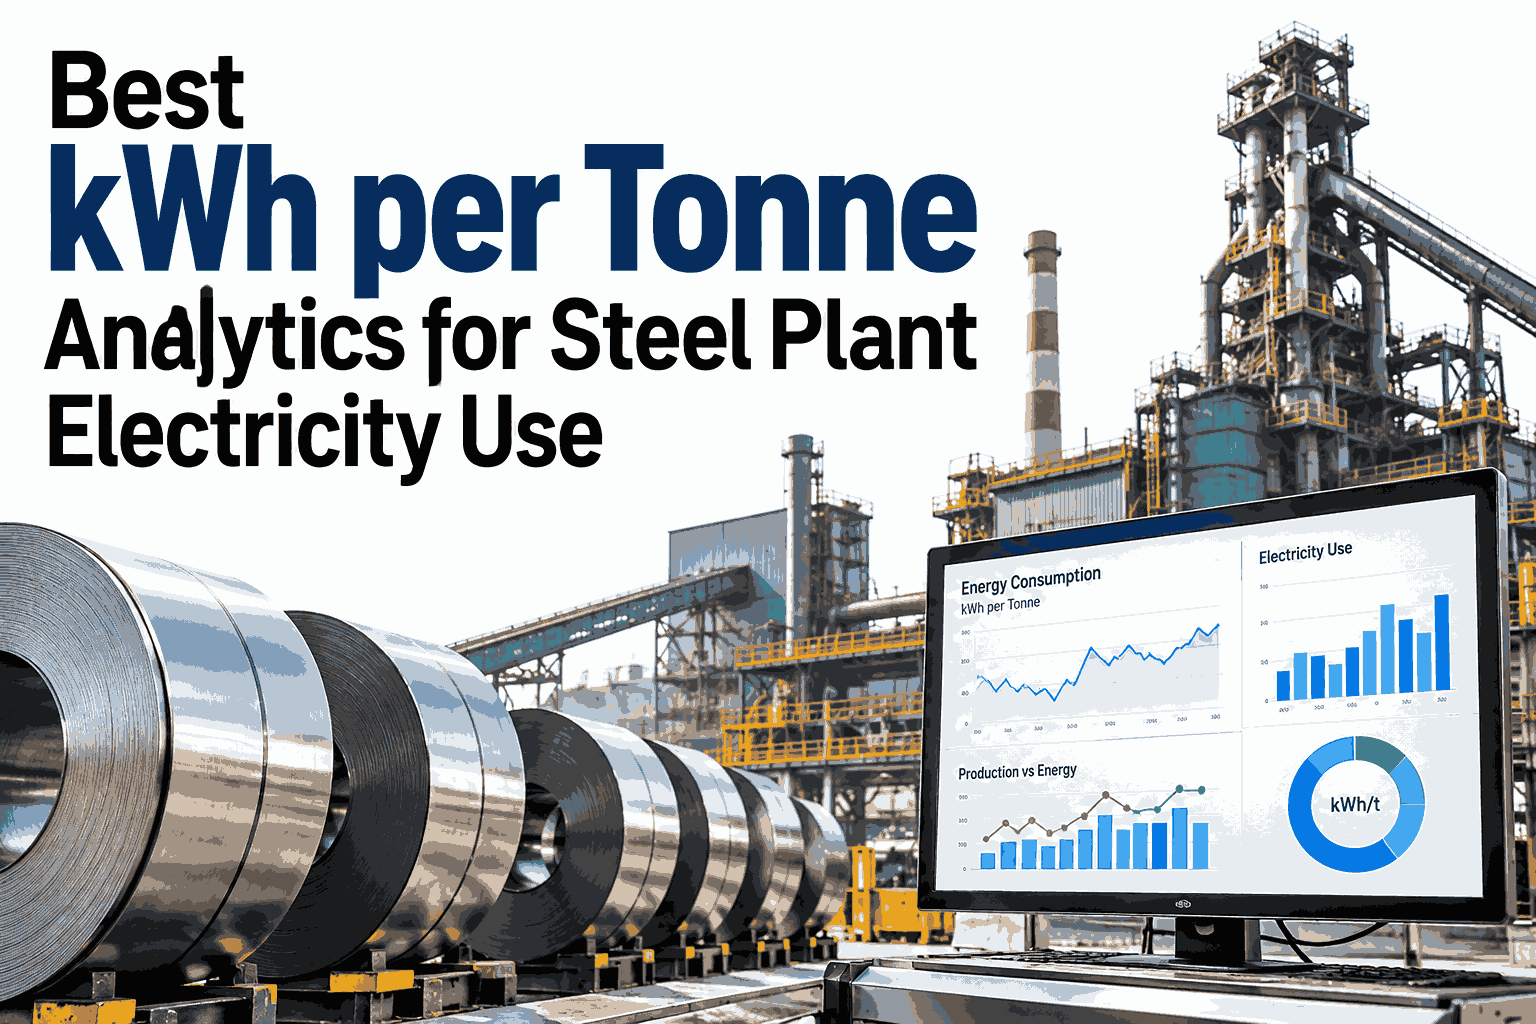
Electricity intensity is the number every steel plant reports and few can explain. A kWh per tonne figure that rises by a few points could mean lower output, an idle furnace, oversized motors or simply a different grade mix, and the plant meter alone cannot say which. Explaining it takes three views working together: how electricity splits across process steps, how much of it is fixed regardless of output, and which motors are running far below their useful load. Plants that want that breakdown can ask iFactory AI's team to review their electricity meter structure and show what is driving intensity on their own tonnes.
Explain Every kWh Per Tonne Instead of Just Reporting It
iFactory AI attributes electricity to process steps, separates base load from productive load and screens motors for savings, so intensity has causes you can act on.
Where the Electricity Goes
The first question is the split by process step. The blocks below are sized to an illustrative share of plant electricity, and the pattern will differ by route and product.
The Output Penalty
Part of the electricity a plant uses does not depend on how much steel it makes. When output falls, that fixed part is spread over fewer tonnes and kWh per tonne rises. The columns assume a fifth of consumption is fixed, using illustrative values.
index 100
102
105
109
113
Separate Base Load From Real Efficiency Loss
Book a 30-minute session and iFactory AI will split your kWh per tonne into base load, output effect and process efficiency using your own data.
Motors Running Below Their Useful Load
A motor is most efficient near its rated load and loses efficiency when it runs lightly loaded. The columns show an illustrative share of motors by load band. Dark columns mark the bands worth investigating.
18% of motors
26% of motors
34% of motors
22% of motors
The VFD Opportunity, and Its Limit
For fans and pumps, power falls roughly with the cube of speed, so a modest slowdown saves a lot. The columns show that ideal relationship. Real savings are lower once static head, drive losses and process limits are counted.
Power 100%
73%
51%
34%
22%
Screening Motors for VFD Fit
Not every motor is a candidate. The table separates strong candidates from weak ones and lists what to confirm first.
| Load Type | Fit | Why | Confirm Before Applying |
|---|---|---|---|
| Cooling and process fans | Strong | Flow is often throttled by dampers | Real flow demand across a full day |
| Centrifugal pumps | Strong | Valves burn energy to control flow | Share of head that is static |
| Air compressors | Medium | Variable demand suits speed control | Leak level and pressure setting first |
| Conveyors | Medium | Gains depend on load variation | Torque needs at low speed |
| Constant-load drives | Weak | Speed cannot fall without hurting output | Whether the load is truly constant |
Three Rules for a kWh Per Tonne You Can Defend
Two plants can report different intensity for the same performance if they define it differently. Settle these three points first.
Fix the Boundary
Decide which meters count, including shared services and auxiliary plant.
Fix the Denominator
Use one tonnage basis, such as liquid steel or saleable product, and never mix them.
Normalise for Mix
Compare like grades and products, so a mix change is not read as an efficiency change.
A Composite Scenario: Three Fixes, Ranked
A plant worked through its intensity in order of ease. The bars show each fix's illustrative share of the total kWh per tonne reduction.
Where iFactory AI Fits
Meters, drives and production records sit in separate systems. iFactory AI joins them at the level of the step, the shift and the tonne.
Step Attribution
Electricity is assigned to the process step and heat that used it.
Base and Output Split
See how much of a change comes from output, and how much from efficiency.
Motor Load Screening
Rank motors by load factor and run pattern to shortlist drive candidates.
Shift-Level Intensity
Compare kWh per tonne by shift and unit on a fair, normalised basis.
Frequently Asked Questions
What is a good kWh per tonne figure for a steel plant?
There is no single good number, because route, product mix, scrap quality and automation level all change it. Electric arc and integrated routes are not comparable, and different products within one route differ too. The useful benchmark is your own trend, normalised for mix, alongside peers on a similar route. iFactory AI's team can help set a fair internal baseline for your plant.
How do we know if a rise is efficiency or just lower output?
Separate the fixed part of consumption from the variable part. If the variable kWh per tonne is steady while the total rose, the cause is output spread over base load. If the variable part itself rose, efficiency has slipped somewhere in the process. Plotting intensity against output over several weeks makes the two effects clear, and it takes only meter and production data.
Are VFD savings guaranteed?
No. Savings depend on how much the load actually varies, how much of the head is static and how well the drive is set up. Ideal cube-law figures overstate real results. A short logging period on the target motor gives a realistic estimate before you buy anything. See a motor screening in a short walkthrough using your own load data.
Do we need a meter on every motor?
No. Start with the main incomers, the largest process areas and the biggest fans, pumps and compressors. Motor loads can often be estimated from drive data or short portable logging campaigns. Permanent sub-meters are worth adding where the data shows a large unexplained share of consumption, and the analytics will point you to those places.
How does this connect to overall cost per tonne?
Electricity is one of the largest utility buckets in the cost per tonne stack. Because iFactory AI attributes kWh to steps and heats, a movement in cost per tonne can be traced to the electricity behind it. Ask support how electricity rolls into your cost view alongside other drivers.
Turn kWh Per Tonne Into a Number With Causes
iFactory AI links meters, motors and heats so electricity intensity can be explained and reduced. Book a walkthrough to see it on your own plant data.