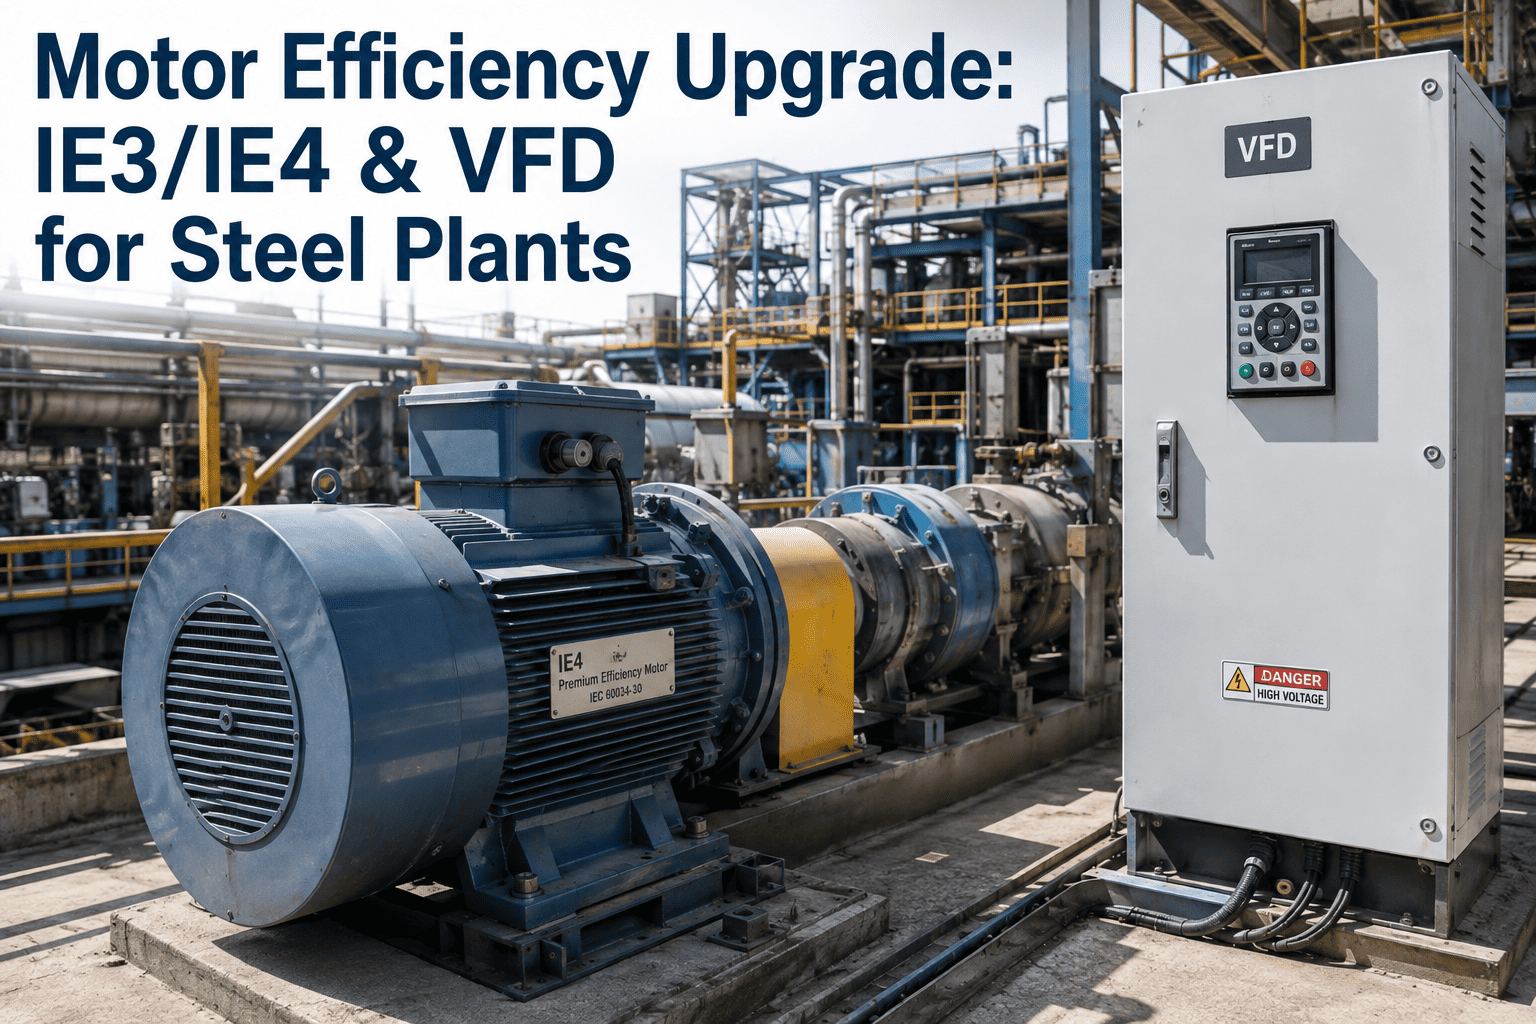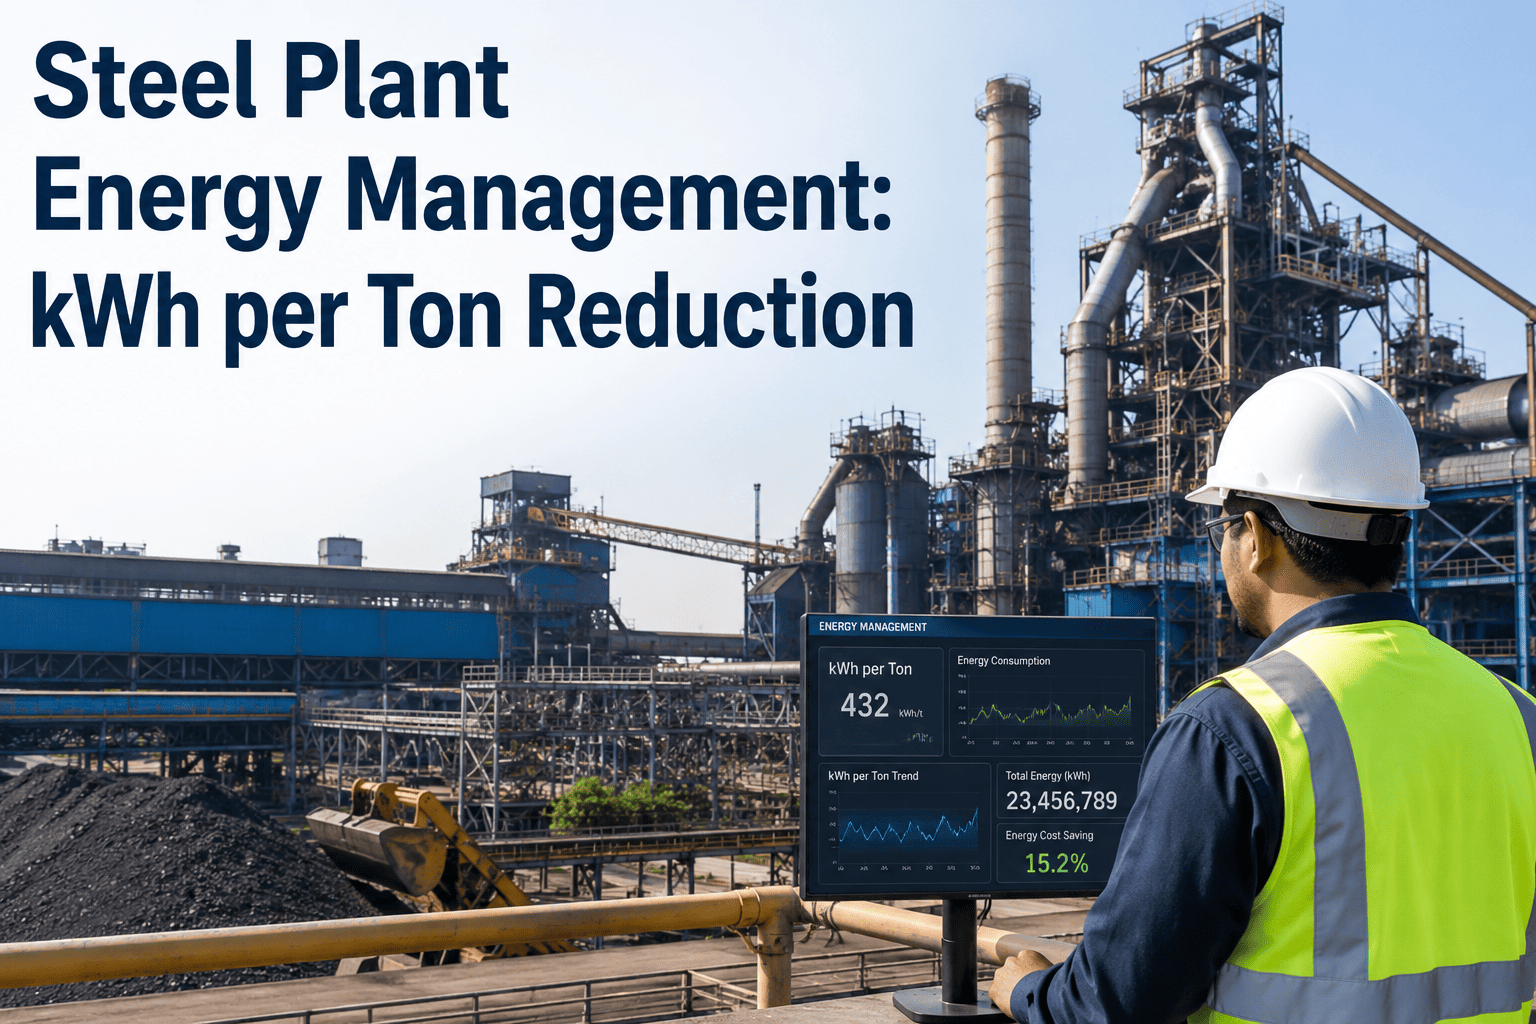
Electric motors drive fans, pumps, compressors, conveyors and mills across a steel plant, and together they account for a very large share of electricity use. Yet most plants cannot say which motors are oversized, which run lightly loaded for hours and which would pay back an upgrade. Nameplate lists and maintenance records describe what was installed, not how hard each motor really works. Motor load analysis closes that gap by measuring actual load against rated capacity and ranking the savings. Energy teams that want a motor fleet ranked on their own plant data can see a motor shortlist built from live load data in a short session.
Know Which Motors Are Working Hard and Which Are Wasting Power
iFactory AI reads real load against every motor's rating, so right-sizing, VFD and efficiency upgrades are ranked by the energy they will save.
Why Load Factor Matters
A motor is most efficient when it runs near its rated load. Below roughly forty percent, efficiency and power factor both fall away. The columns show an illustrative curve, and real curves vary with motor size and design.
80%
90%
93%
94%
93%
Which Action for Which Motor
Not every motor needs the same fix. Four questions, asked in order, sort a fleet into the right action. Teams that want this sorting done automatically can review a sorted fleet on their own motors.
Get Your Motor Fleet Sorted by Savings, Not by Guesswork
Book a 30-minute session and iFactory AI will show load factor, running hours and ranked actions for the motors on your own plant.
A Few Motors Carry Most of the Energy
Fleet energy is lopsided. The columns group motors into ten equal bands, from the biggest energy users on the left. Values are illustrative, and your own curve will be just as steep.
Ranking by Annual Energy Cost
A simple product puts every motor on the same scale. Rank on cost first, then look at how much of it is avoidable.
Common Steel Plant Motor Loads
Different applications call for different first moves. The table gives a starting guide.
| Application | Typical Load Pattern | Best First Action | Caution |
|---|---|---|---|
| ID and cooling fans | Variable, often throttled | Variable speed drive | Confirm real flow range first |
| Cooling water pumps | Variable, valve controlled | Drive or impeller trim | Check static head share |
| Dust extraction fans | Steady, long hours | Right-size, efficiency class | Do not starve capture points |
| Compressor motors | Variable demand | Fix leaks, then control | Leaks hide the real load |
| Conveyors | Load varies with feed | Review starting and speed | Needs torque at low speed |
| Mill and roll drives | Cyclic, high power | Review drive and efficiency | Process limits dominate |
The Efficiency Class Ladder
Motors are graded by efficiency class under IEC standards. Each step costs more and saves a little more, so the case depends on running hours.
Three Ways to Measure Load
Accuracy and effort rise together. Most plants use all three on different parts of the fleet. A short demo can show how each level feeds one fleet view.
Nameplate and Run Hours
Quick screen of rating, age and hours. Good for ranking, weak on true load.
Portable Logging
Power logged for a week or two on shortlisted motors. Best value for decisions.
Permanent Monitoring
Continuous data on the largest motors. Tracks drift and verifies savings.
A Composite Scenario: Four Hundred Motors, Fourteen Actions
A plant screened its motor fleet and let the data narrow the work. The strip shows illustrative counts at each stage.
Where iFactory AI Fits
Meters, drive data and maintenance records sit in different systems. iFactory AI brings them together for each motor.
Fleet Register
Every motor is listed with rating, application, hours and measured load.
Savings Ranking
Actions are ranked by avoidable kWh and cost, with assumptions visible.
Drift Alerts
A motor whose load or draw changes is flagged before it becomes a failure.
Savings Verification
After a retrofit, kWh per tonne confirms whether the saving arrived.
Frequently Asked Questions
How do we know a motor is oversized?
Measure its actual power over a representative period and compare it with the rating. A motor that averages well below about forty percent of rated load, with little variation, is a candidate for right-sizing. Peak starting needs and process margins must be checked first. iFactory AI's team can help interpret the measurements before any replacement is ordered.
Is replacing a working motor with IE4 or IE5 worth it?
Only when running hours are long and the motor is correctly sized. The extra efficiency is a few percentage points, so the saving scales with hours and load. For motors that run a few hundred hours a year, the payback is rarely attractive. A common policy is to choose a higher class at the next failure and replace early only where the numbers clearly support it.
Can a drive be added to any motor?
Not usefully. Drives suit loads that vary and where flow is currently throttled, such as fans and centrifugal pumps. Constant-load drives gain little and add cost and losses. Cable length, motor insulation and harmonics should also be checked. See a drive suitability screen in a short walkthrough built on your own motor list.
How long should we log a motor before deciding?
Long enough to cover a full operating cycle, which is often one to two weeks for continuous processes and longer where campaigns change. Logging for a single shift can mislead if the load swings between grades or products. The goal is a representative picture of both typical and peak load, since sizing must respect the peaks.
How does this connect to kWh per tonne?
Motor savings reduce electricity use directly, and iFactory AI measures that effect against production. After a retrofit, kWh per tonne for the affected line is compared with its earlier signature, adjusted for output. Ask support how savings are reported alongside your other energy metrics.
Put the Right Motor Action on the Right Motor
iFactory AI turns real load data into a ranked list of right-sizing, drive and upgrade actions. Book a walkthrough to see it on your own fleet.