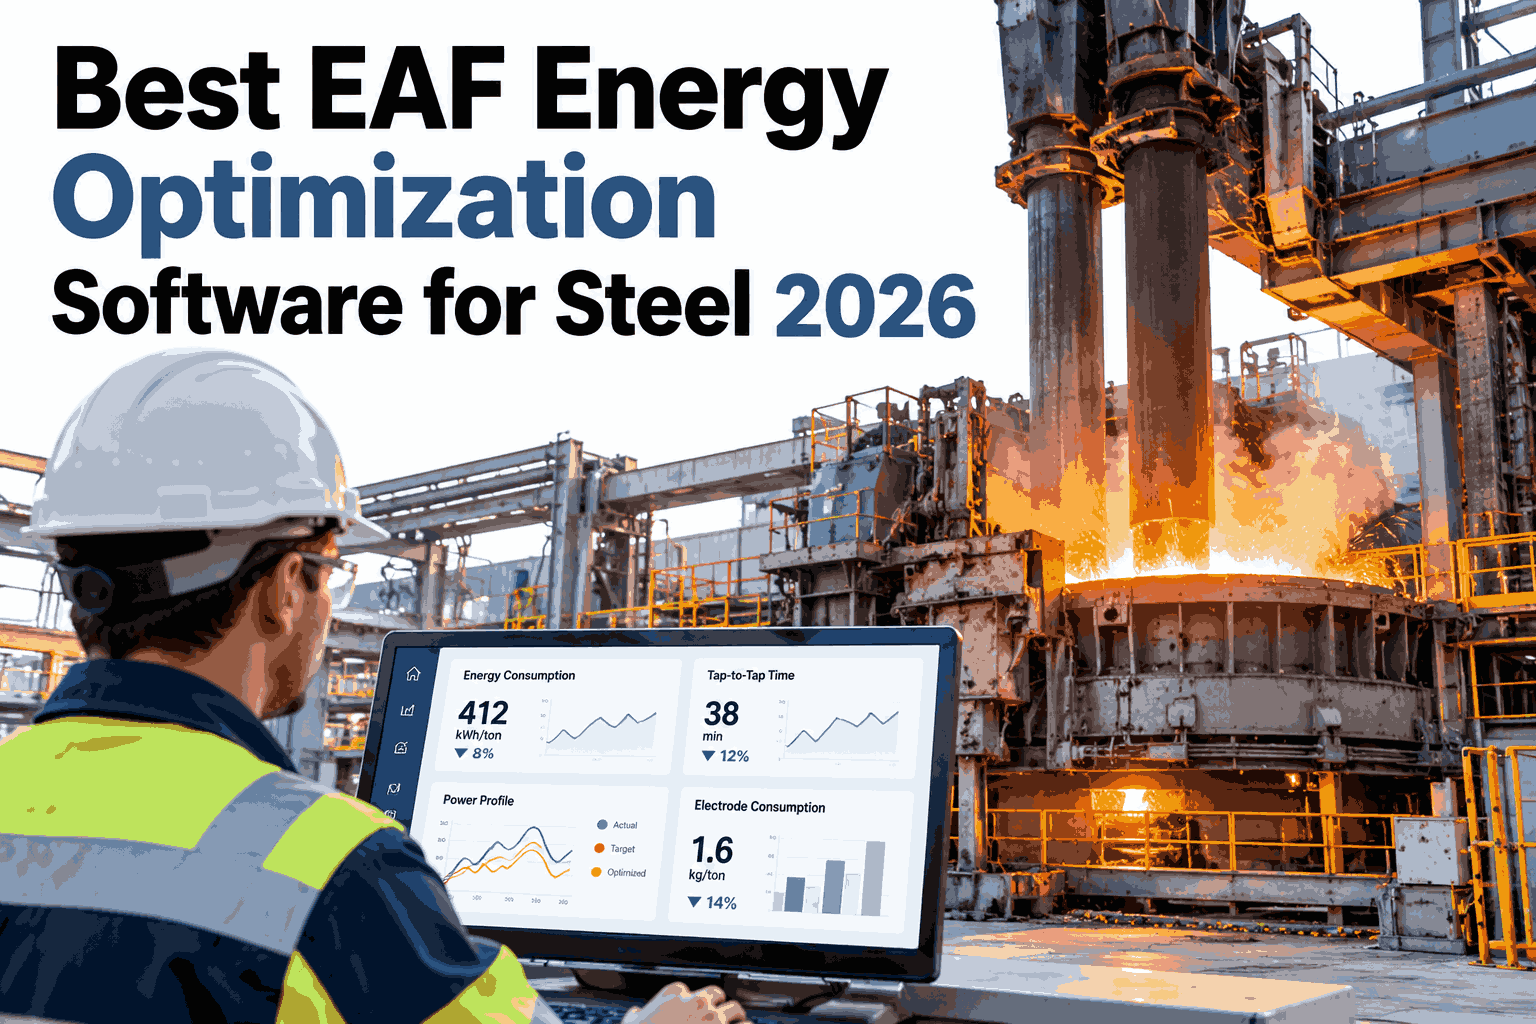
Electric arc furnaces burn through more electricity than almost any other single process in a steel plant, and small inefficiencies in power delivery compound fast across thousands of heats a year. Most shops still tune power profiles by instinct, nudging tap settings after a rough heat instead of before one, so energy use swings wildly between heats of the identical grade, on the identical scrap practice. A furnace running at the edge of its transformer rating can lose real power to arc instability, thin foam slag coverage and mistimed bus work long before tap-to-tap even finishes, and none of that loss shows up anywhere until the monthly power bill lands. This guide looks at what actually drives EAF energy use, how to separate the levers that matter from the noise, and what strong optimization software should do about it, and if you want a quick read on your own power curves, you can book a power profile review.
AI-Driven EAF Energy Optimization Software for Steel Plants
Match power input to scrap condition heat by heat, hold arc stability through bore-in, and turn kWh per ton into a number your furnace team can actually move.
Why EAF Energy Use Swings Heat to Heat
The furnace does not know your target. It only reacts to what it is fed and how it is driven.
Scrap arrives in mixed density and moisture, tap-to-tap targets get set by habit rather than by what is actually in the bucket, and operators trade stable arc for faster melt-in when the schedule is tight. None of this shows up as one clean root cause. It shows up as a kWh-per-ton number that moves heat to heat for reasons nobody can point to on the log sheet. Our EAF support team can help you trace where it starts on your furnace.
Scrap density guesswork
Light, bulky scrap melts slower and holds the arc open longer than dense scrap of the same weight, and most yards sort by grade rather than by how a load will actually behave in the furnace.
Static power curves
One tap-voltage schedule applied to every heat regardless of basket mix or furnace wear, carried over from a setup sheet nobody has revisited since the transformer was commissioned.
Thin or patchy foam slag
Weak foam exposes the arc to the roof and walls, radiating away energy that should melt steel, and often goes unnoticed until electrode or refractory wear forces a closer look.
No heat-to-heat comparison
Operators see this heat's trend chart in isolation, rarely last week's heats on the same grade laid alongside it, so a slow drift in practice never gets caught early.
Four Levers That Decide Your kWh per Ton
Energy use is not one number to chase. It is four variables that move together.
Chasing a single kWh-per-ton target without watching what feeds it usually backfires, trading energy for electrode wear or refractory life instead of actually saving anything. These four levers cover most of the swing between a tight heat and a wasteful one, and they interact more than most schedules assume.
Scrap mix and charge sequence
Dense scrap first, light bulky scrap layered on top, keeps the arc buried and shortens bore-in time. Shredded or HBI in the wrong bucket position can stretch melt-in by several minutes on an otherwise normal heat.
Power profile by phase
Bore-in, main melt and flat-bath each want a different voltage tap and reactor setting, not one curve run start to finish. A tap chosen for melt-in and left unchanged through refine wastes energy nobody notices.
Arc stability and foam slag
A stable, well-foamed arc transfers more energy into the bath instead of radiating it to the shell and roof. Thin foam is one of the most common and most fixable sources of wasted heat.
Tap-to-tap discipline
Minutes added at any stage carry their own electrical cost even when the arc itself runs efficiently, since power-on time and transformer draw rarely pause for a schedule delay.
Move one lever without watching the others and gains often cancel out. That is why set-point changes should be trialed, not rolled out plant-wide on day one.
Cutting power-on time by rushing bore-in looks good on the tap-to-tap clock, but an unstable early arc can burn more energy chasing scrap than a patient, well-sequenced charge does.
See Your Own kWh-per-Ton Spread
We pull a few weeks of heat data from your furnace and show where energy use is drifting from grade to grade, at no cost before you commit to anything.
What we pull from your logs
- Power curve per phase, per heat
- Scrap mix and charge weight by bucket
- Tap-to-tap time broken into stages
- Electrode consumption against kWh/t
What to Look for in EAF Energy Optimization Software
Not a feature list. A short checklist to judge any option against.
Plenty of tools will show you a trend chart. Far fewer connect that chart to scrap mix, electrode wear and tap-to-tap stage, which is where the real savings usually hide. Use the points below on any shortlist, including a tool you already own.
Reads power signals live
Voltage, current and reactor tap pulled directly from the furnace electricals, not entered by hand after the fact or reconstructed from a shift report.
Knows the scrap charged
Links each heat's power curve to the scrap grades and weights that actually went into the bucket, so a light-density heat is never compared against a dense one as if they were equal.
Breaks tap-to-tap into stages
Shows bore-in, main melt, refine and tap separately, since each has its own energy signature and a single blended number hides where the time and power actually went.
Flags arc instability
Catches flicker and erratic current before it shows up as a bad kWh-per-ton number days later, when the cause is harder to trace back to a specific heat.
Turns kWh into cost
Converts energy use into money per heat and per ton, using your own tariff structure including demand charges and time-of-use rates where they apply.
Proposes, never forces
Suggests new tap and reactor settings for your team to trial, never writes to the controller unsupervised, and keeps a record of who approved each change.
Electrode Consumption Tracks Energy Waste Too
A furnace burning more electrodes than usual is often burning more power too.
Electrode tip wear and energy use share many of the same root causes, which is why they are worth watching together rather than on separate reports from separate departments. An unstable arc that radiates energy to the furnace walls also erodes electrode tips faster, and a power profile pushed too hard during bore-in tends to show up as both a high kWh-per-ton number and a shorter electrode column. Reading them side by side, rather than as two unrelated line items, usually points straight at the furnace practice that needs attention. For a look at how your own electrode and energy trends line up, reach out to our EAF team.
Tip wear rate
Electrode consumption per ton, tracked against the same heats as power use, not reported separately by month.
Column breakage events
Sudden breaks often follow a stretch of unstable arc behavior that also cost extra kWh in the same heats.
Reactor tap at bore-in
An aggressive early tap can trade a faster melt-in for both heavier electrode wear and a higher power draw.
Benchmarking a Furnace Against Its Own Best Heats
Industry averages tell you little. Your own best heats tell you what is actually achievable.
Comparing a furnace to a published industry figure rarely leads anywhere useful, since scrap practice, transformer size and grade mix differ too much plant to plant for the comparison to mean anything. A more useful benchmark is built from a furnace's own best heats on a given grade, gathered over a few weeks and used as the pattern every other heat on that grade is measured against. That pattern becomes the baseline a power-profile change is trialed against, and the number a shift supervisor can actually explain to an operator on the floor.
Group by grade and scrap mix
Heats only compare fairly against others charged with a similar scrap grade and weight.
Pull the top quartile
The best-performing heats on each grade become the pattern, not a plant-wide average that hides good and bad practice together.
Re-baseline after real change
A transformer upgrade, new scrap supplier or refractory relining should reset the baseline, not be compared against an outdated one.
Tap-to-Tap Time vs Energy: The Trade-off Table
Faster is not always cheaper per ton. Here is where the trade-off usually sits.
Shaving minutes off tap-to-tap looks like a clean win until the energy cost of getting there is counted. A faster heat can still cost more per ton if it was bought with extra power pushed through an unstable arc, so the table below lays out where time savings tend to pay off and where they tend to cost more than they save, based on typical EAF operating patterns across furnace sizes.
Shares are illustrative and vary by furnace size, transformer rating and scrap practice. Your own breakdown is what the audit above is for.
How iFactory Optimizes EAF Energy
Every heat, every lever, next to the power bill it produced.
iFactory reads voltage, current, reactor tap and scrap charge data from the furnace electricals and scale systems you already run, and lines it up heat by heat against tap-to-tap stage and cost. It flags heats that drifted from the pattern your best heats show, and explains why in plain terms your furnace team can act on. Questions on fit go to our support desk.
Read-only links to furnace electricals, scale systems and the Level 2 historian. Nothing changes on the controller until your team decides it should, and the connection adds no new hardware to the furnace itself.
Each heat against your best heats on the same grade, scrap mix included, not just last week's plant-wide average that blends good and bad practice together.
Arc instability, light scrap charge or slow bore-in surfaced as the likely cause of a costly heat, in language a shift supervisor can act on without a data science background.
Trial set points tracked against yield, electrode wear and refractory condition, so an energy saving never quietly costs you quality or furnace life.
iFactory's EAF energy programme quotes electrical savings in the low single digits as typical, with larger gains possible on furnaces running far from their best-heat pattern. An audit on your own data shows which you have.
Turnkey AI: Delivered, Connected and Live in 6–12 Weeks
You do not build this. It arrives ready to run.
iFactory ships as a pre-configured NVIDIA AI server, racked and ready, with the EAF energy model pre-loaded. Rack it, connect power and Ethernet, and it is live on your network within days, with our team handling the furnace electrical integration from there.
Connect and baseline
Furnace electricals, scale system and historian connected. Best-heat patterns built per grade from several weeks of heat history.
Trial and tune
First power-profile trial on one grade, checked against yield and electrode wear by your team before it spreads to other grades.
Go-live and training
Energy tracking live across all grades. Furnace crew trained on the dashboards and alerts. 24×7 remote monitoring begins.
Frequently Asked Questions
What is a good kWh per ton for an EAF?
Most EAFs sit somewhere between 400 and 700 kWh per ton of electrical energy, depending on scrap grade, furnace size and transformer rating. The useful number is not an industry average but your own best heats on a given grade, which is the target any optimization effort should chase rather than a published figure from a furnace unlike yours.
Does scrap mix really change energy use that much?
Yes, often more than the power profile itself. Light, bulky scrap takes longer to melt and keeps the arc exposed for longer, while dense scrap layered correctly shortens bore-in and protects the roof from radiant loss. Charge sequence is one of the first places to look when energy use swings between otherwise identical heats on the same grade.
Will cutting tap-to-tap time always save energy?
Not always. A rushed bore-in or a short refine window can trade a faster clock for a less efficient arc or rework later, which can cost more in energy and yield than the minutes actually saved. See our power profile review for a look at where your own trade-off sits before changing anything on the floor.
How is EAF energy optimization software different from the furnace PLC?
The PLC runs the melt in real time against whatever set points it is given, heat after heat, with no memory of how other heats performed. Optimization software looks across heats, grades and scrap mixes to show which set points actually produce your best, lowest-energy heats, then hands proposed changes to your team to trial under their own change control.
How quickly can we expect to see savings?
Many plants see the first useful pattern within a few weeks of connecting data, since the fix is often a scrap sequencing or tap-setting change rather than new equipment or a furnace rebuild. Larger gains tied to electrode practice or transformer upgrades take longer to show up. Contact our team to scope your starting point.
Find the Energy Hiding in Your Heat Logs
In thirty minutes we walk through a sample of your heats, scrap mix and power curves, and point out where kWh per ton is drifting furthest from your best runs.
Bring to the call
- A month of heat-log data, any format
- Scrap grade mix by bucket if logged
- Your furnace size and transformer rating
- Current tap-to-tap target by grade