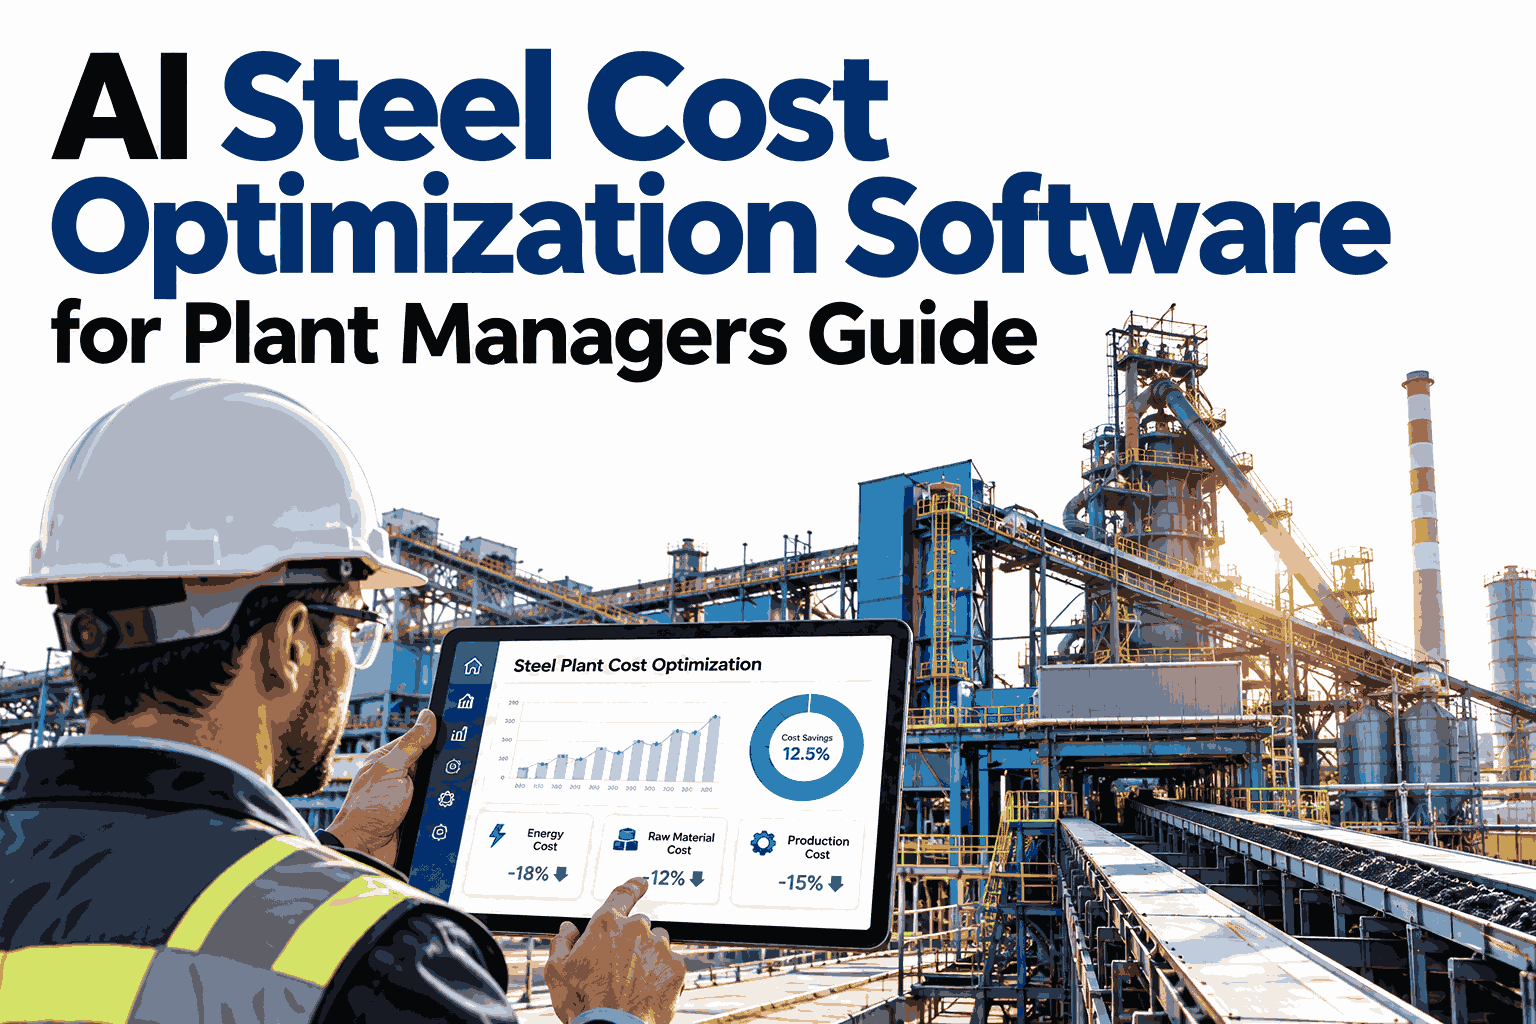
A plant manager does not need another dashboard. The job is to decide, in the first hour of a shift, what to change so cost per tonne moves the right way by the end of it. Reports describe what already happened, while AI cost optimization software works on what to do next: it reads live plant and cost data, finds the drivers that are drifting, and suggests actions with a value attached. The manager still decides, but with a ranked shortlist instead of a search through spreadsheets. Managers evaluating this approach can see how iFactory AI turns live plant data into ranked cost actions before shortlisting any software.
AI Steel Cost Optimization Software for Plant Managers
From what happened to what to do next: a practical guide to how AI finds cost drivers, ranks actions and shows the value of each.
Four Levels of Cost Analytics
Many plants stop at the first level. The value for a manager grows with each step, and the last one is the one that changes decisions.
Descriptive
What was cost per tonne last month?
Diagnostic
Which drivers moved it, and where?
Predictive
Where is it heading if nothing changes?
Prescriptive
What should we change now, and what is it worth?
A Shift-Start Briefing, Illustrated
This is an example of the kind of ranked shortlist a plant manager might see at the start of a shift. It is illustrative, not real plant output.
See Your Own Ranked Cost Actions
Book a 30-minute session and iFactory AI will show how live plant data becomes a ranked list of cost actions, each with a value attached.
Worked Examples: What a Few Dollars a Tonne Can Look Like
Small per-tonne gains add up. The three examples below use assumed prices and rates to show the arithmetic, and are not promises of results at any plant.
Fuel use falls by 0.4 GJ per tonne after dwell limits are tightened. At an assumed $4 per GJ:
Yield rises from 92.0% to 92.3% on an assumed $500 cost per input tonne:
Electrode use falls by 0.1 kg per tonne. At an assumed $4 per kg:
On a plant shipping a million tonnes a year, the same illustration would be worth several million dollars. Your inputs will differ, so test the arithmetic with your own prices in a guided session.
Where the Manager Stays in Charge
Good software supports judgement, it does not replace it. Clear boundaries build trust on the floor.
A 30-60-90 Day Adoption Path
Adoption goes best when scope stays small at first and grows with confidence.
Where iFactory AI Fits
iFactory AI connects production, energy, maintenance and cost data, then presents the drivers and actions in plain language.
Real-time driver analysis
Cost per tonne is split into production, energy, maintenance, downtime and raw-material drivers as data arrives.
Prescriptive suggestions
Each flag comes with a suggested action and an estimated value, so the shortlist is ranked by impact.
Evidence you can inspect
Managers can see the data behind every recommendation, which keeps decisions explainable to the floor and the board.
Ask in plain language
Ask why cost rose this week and receive the ranked drivers instead of building a report.
iFactory AI arrives pre-configured on an NVIDIA server that ships racked and ready with software pre-loaded. Scope covers cabling, network, ERP and MES integration, team training and 24x7 remote monitoring.
Frequently Asked Questions
What does AI cost optimization software do for a plant manager?
It watches cost drivers continuously, flags the ones drifting from benchmark and suggests actions ranked by value. The manager gets a short list to act on instead of a large report to interpret. You can watch a live briefing built from sample plant data.
Are savings of a few dollars per tonne realistic?
They can be, but results depend on the plant, its starting point and how consistently actions are taken. The worked examples on this page use assumed prices and are illustrations only. To test the arithmetic on your numbers, request a savings modelling session with the iFactory AI team, or ask support what inputs are needed.
Does the AI make changes to the plant automatically?
No. It recommends actions and shows the evidence, while people decide and carry them out within safety and quality limits. Keeping the manager in control makes recommendations easier to trust and to audit. A short product tour of how recommendations are reviewed shows the workflow.
What data is needed to get started?
You need production and quality records, energy and consumable usage, maintenance and downtime logs, and cost data from finance. Most plants already hold this across separate systems. See which of your systems can be connected first so early briefings arrive within weeks.
How long before managers see results?
Deployment takes 6 to 12 weeks, and the first useful briefings usually follow once data is connected and benchmarks are agreed. Measured cost impact builds as more actions are taken and tracked. Schedule a walkthrough of the adoption timeline to see what to expect at each stage.
Give Your Shift a Ranked List of Cost Actions
iFactory AI turns live plant data into driver analysis and ranked recommendations. Book a walkthrough to see it built around your own plant.