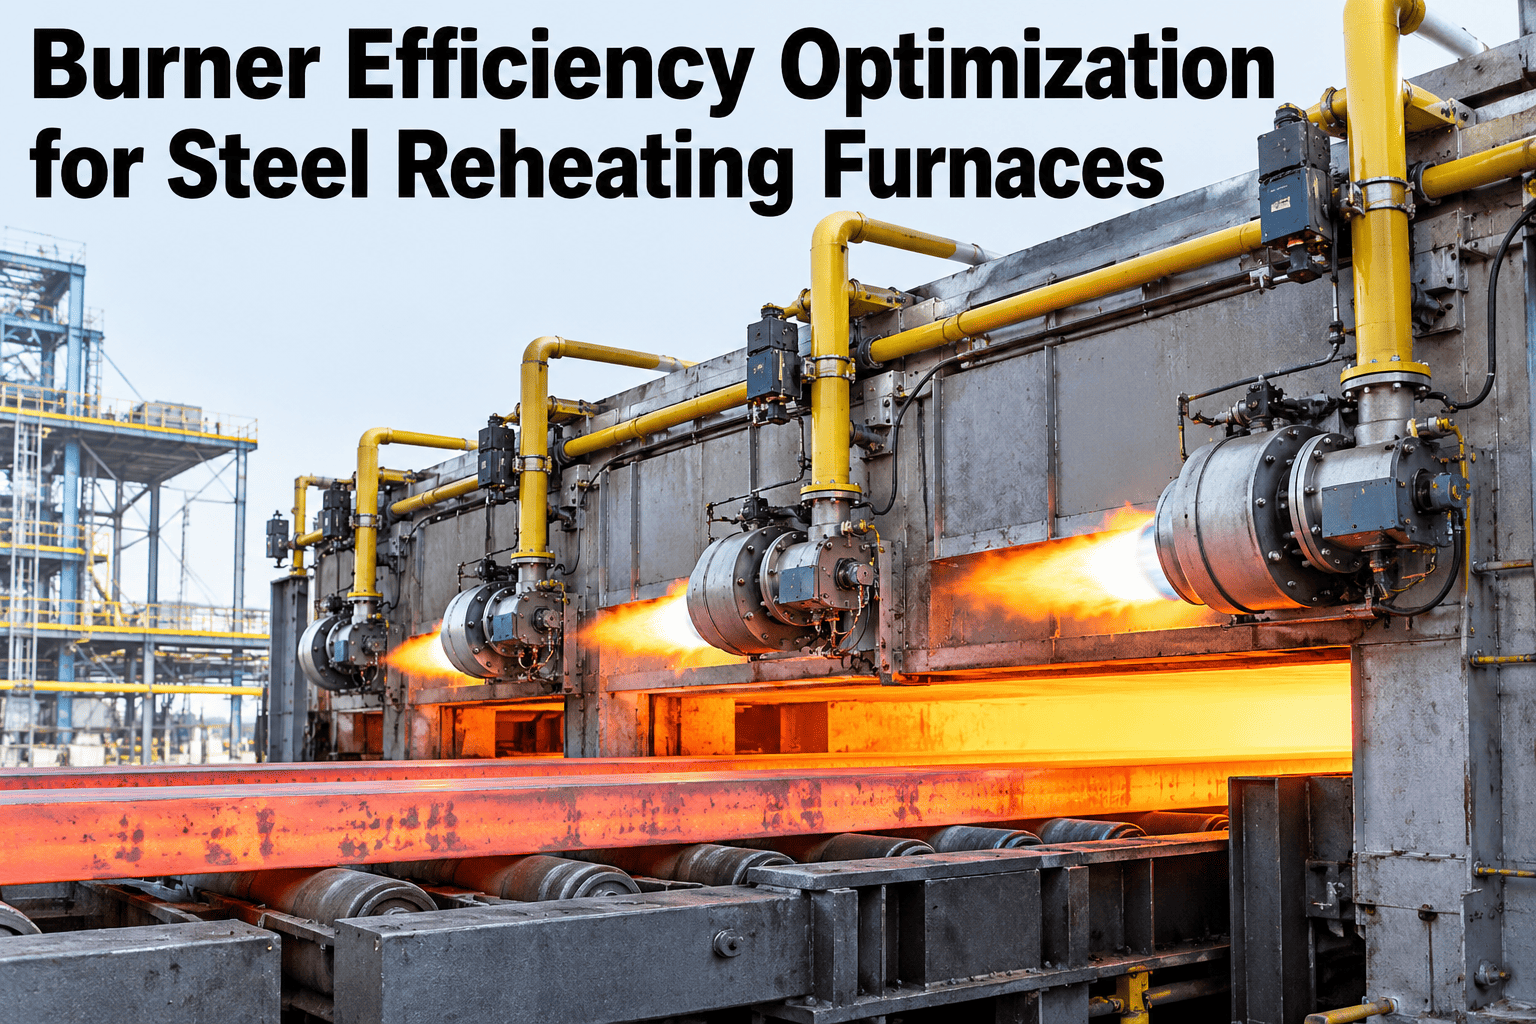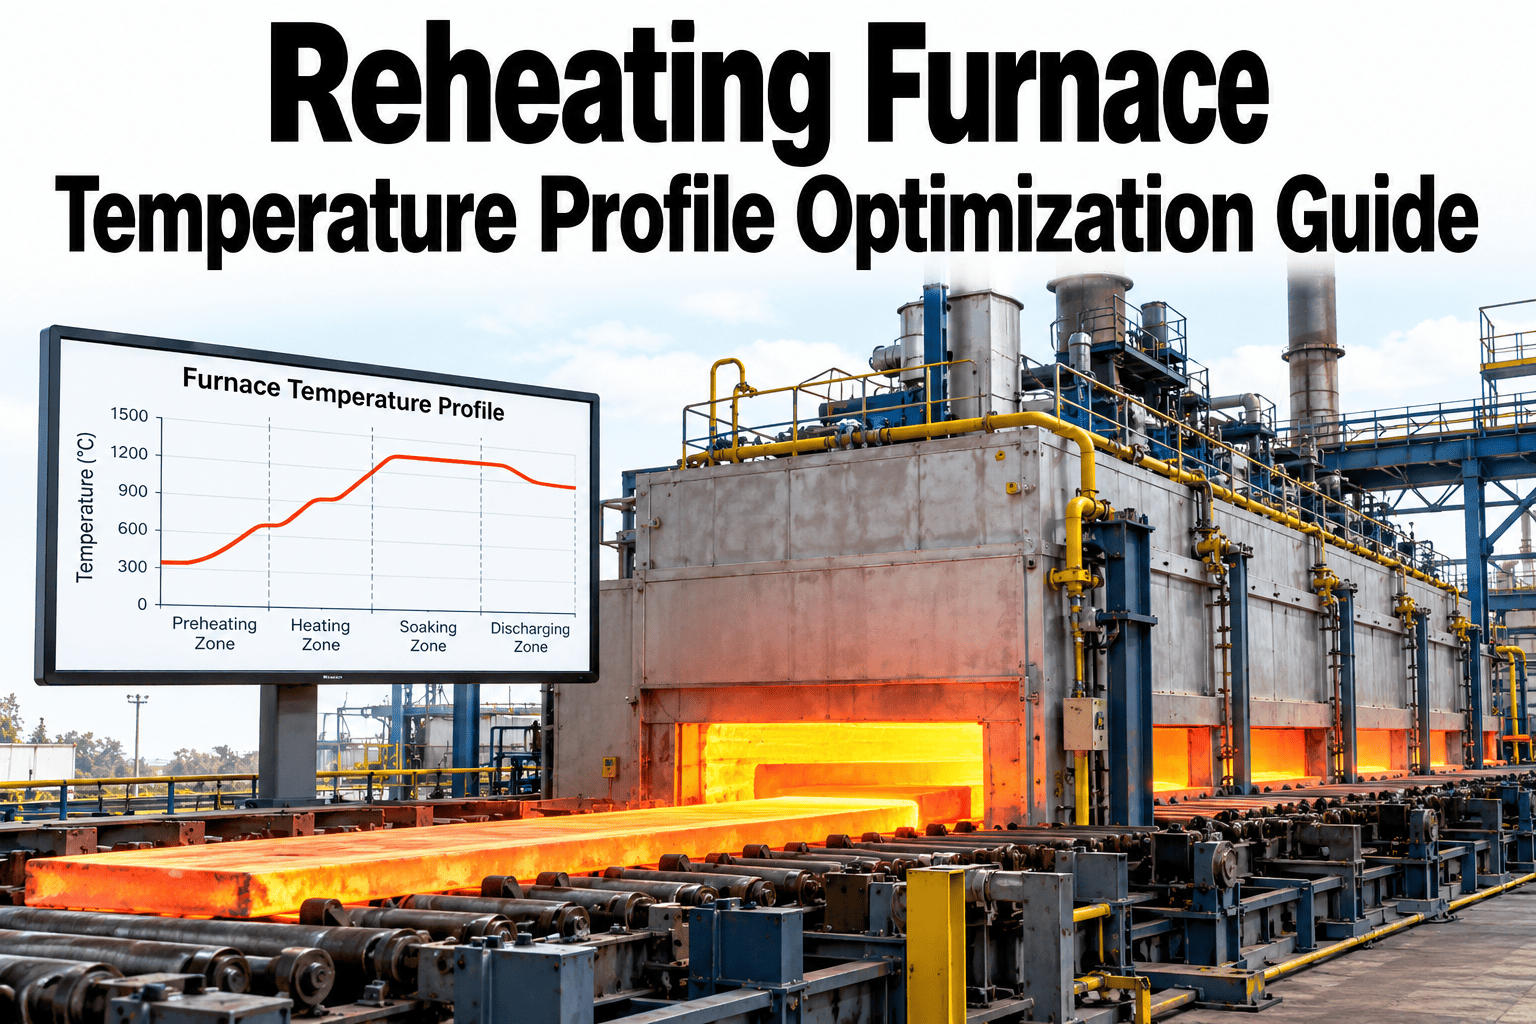
A reheating furnace burns gas to bring billets or slabs to rolling temperature, and small inefficiencies compound fast across thousands of pieces a month: an uneven temperature profile that forces longer soak times, burner tuning that drifts from optimal zone to zone, and scale loss that wastes both yield and the energy already spent heating metal that ends up as mill scale. None of these show up clearly in a monthly GJ per tonne number until someone breaks it down by cause. See your furnace's GJ per tonne broken down by driver in a short session.
Find the GJ per Tonne Hiding in Furnace Profile and Scale Loss
iFactory AI tracks temperature profile, burner tuning, and scale-loss analytics zone by zone, turning a single energy number into a map of where it is actually spent.
An Uneven Profile Costs More Than It Looks
When one zone runs cooler than planned, the fix is usually a longer soak time, not a burner adjustment.
A longer soak burns more fuel per piece and slows throughput, and the root cause, an uneven cross-sectional temperature profile, often goes unaddressed because the soak time fix works well enough to mask it.
Where GJ per Tonne Actually Goes
A composite breakdown of controllable energy drivers across a typical reheating furnace.
See Your Own Furnace's Energy Breakdown
Book a 30-minute session and iFactory AI will walk through zone-by-zone GJ per tonne on your own furnace.
Scale Loss Is an Energy Problem, Not Just a Yield Problem
Every tonne lost to scale formation carried energy that was already spent heating it.
| Factor | Effect on Scale | Effect on Energy | Correction |
|---|---|---|---|
| Extended soak time | More scale formation | Wasted on both heat and loss | Tighten profile, reduce margin |
| Excess air ratio | Accelerated oxidation | Lower combustion efficiency | Re-tune burner air-fuel ratio |
| Furnace atmosphere drift | Uneven scale pattern | Inconsistent heat transfer | Zone-level atmosphere check |
Four Signals Worth Tracking Daily
These four readings explain most of the energy variance reheating furnaces see week to week.
Cross-Sectional Profile
Temperature spread across the piece, not just the surface reading at discharge.
Burner Air-Fuel Ratio
Tracked per zone against the target, flagged when it drifts outside range.
Scale Loss Estimate
Modeled from soak time and atmosphere conditions, tied back to yield reports.
GJ per Tonne by Cause
The headline number broken into base heating, margin, tuning, and scale loss.
A Composite Before and After
Twelve shifts of GJ per tonne tracked before and after profile and tuning correction. Darker cells show shifts running above target.
Rolling It Out on the Furnace
iFactory AI arrives turnkey, built to connect to existing furnace zone controls and production data.
Frequently Asked Questions
How does this measure temperature profile without new sensors?
It combines existing zone sensor readings with a thermal model calibrated to your furnace's piece sizes and throughput, estimating cross-sectional profile without requiring new instrumentation. Support can walk through the modeling approach for your furnace type.
Can this reduce soak time without risking underheated pieces?
Soak time recommendations are built with a safety margin informed by actual profile data rather than a blanket reduction, so the goal is tightening an oversized margin, not eliminating margin entirely. See how margin adjustments are validated on your own furnace.
Does this connect to our yield and scale loss reporting?
Yes, scale loss estimates tie back to your existing yield reports, so a GJ per tonne shift tied to scale loss shows up consistently across both systems rather than as a separate number.
What data do we need to get started?
Zone temperature readings, burner air-fuel ratio logs, piece schedule, and yield reports are the core inputs. Most mills already hold these across furnace control and MES systems.
How does burner tuning drift get flagged?
Air-fuel ratio is checked continuously per zone against its target range, and a drift outside tolerance is flagged with the specific zone and burner identified. Ask support how tuning alerts route to your maintenance team.
Break Down Your GJ per Tonne by Cause, Not Guesswork
iFactory AI tracks temperature profile, burner tuning, and scale loss on one furnace view. Book a walkthrough to see it on your own line.