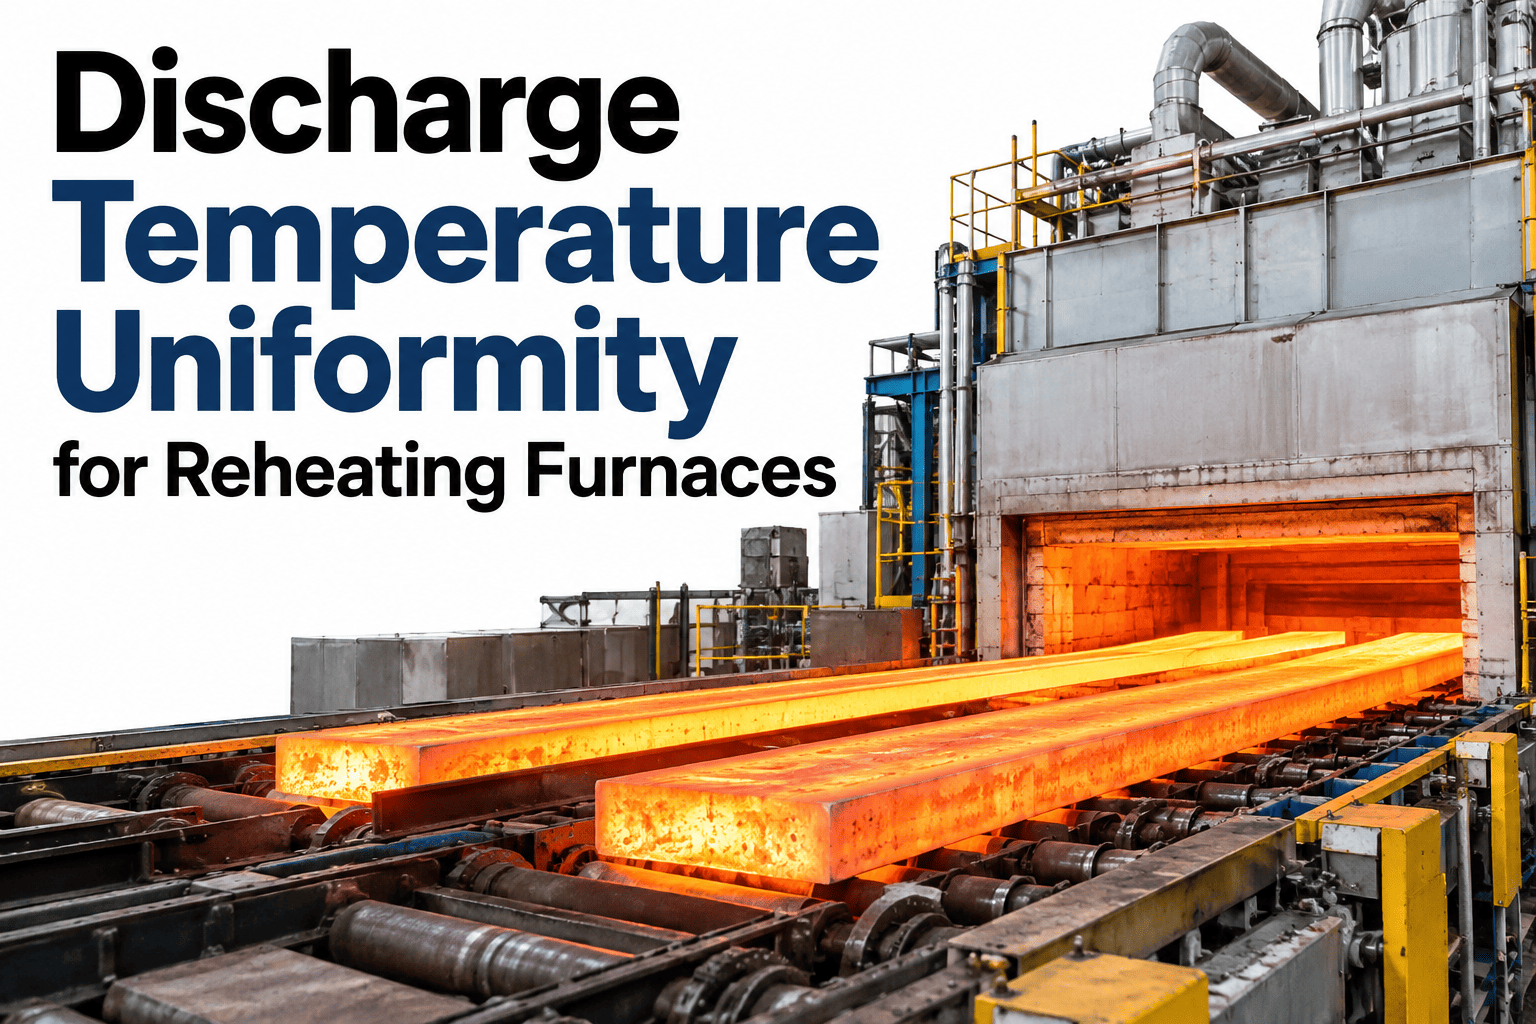
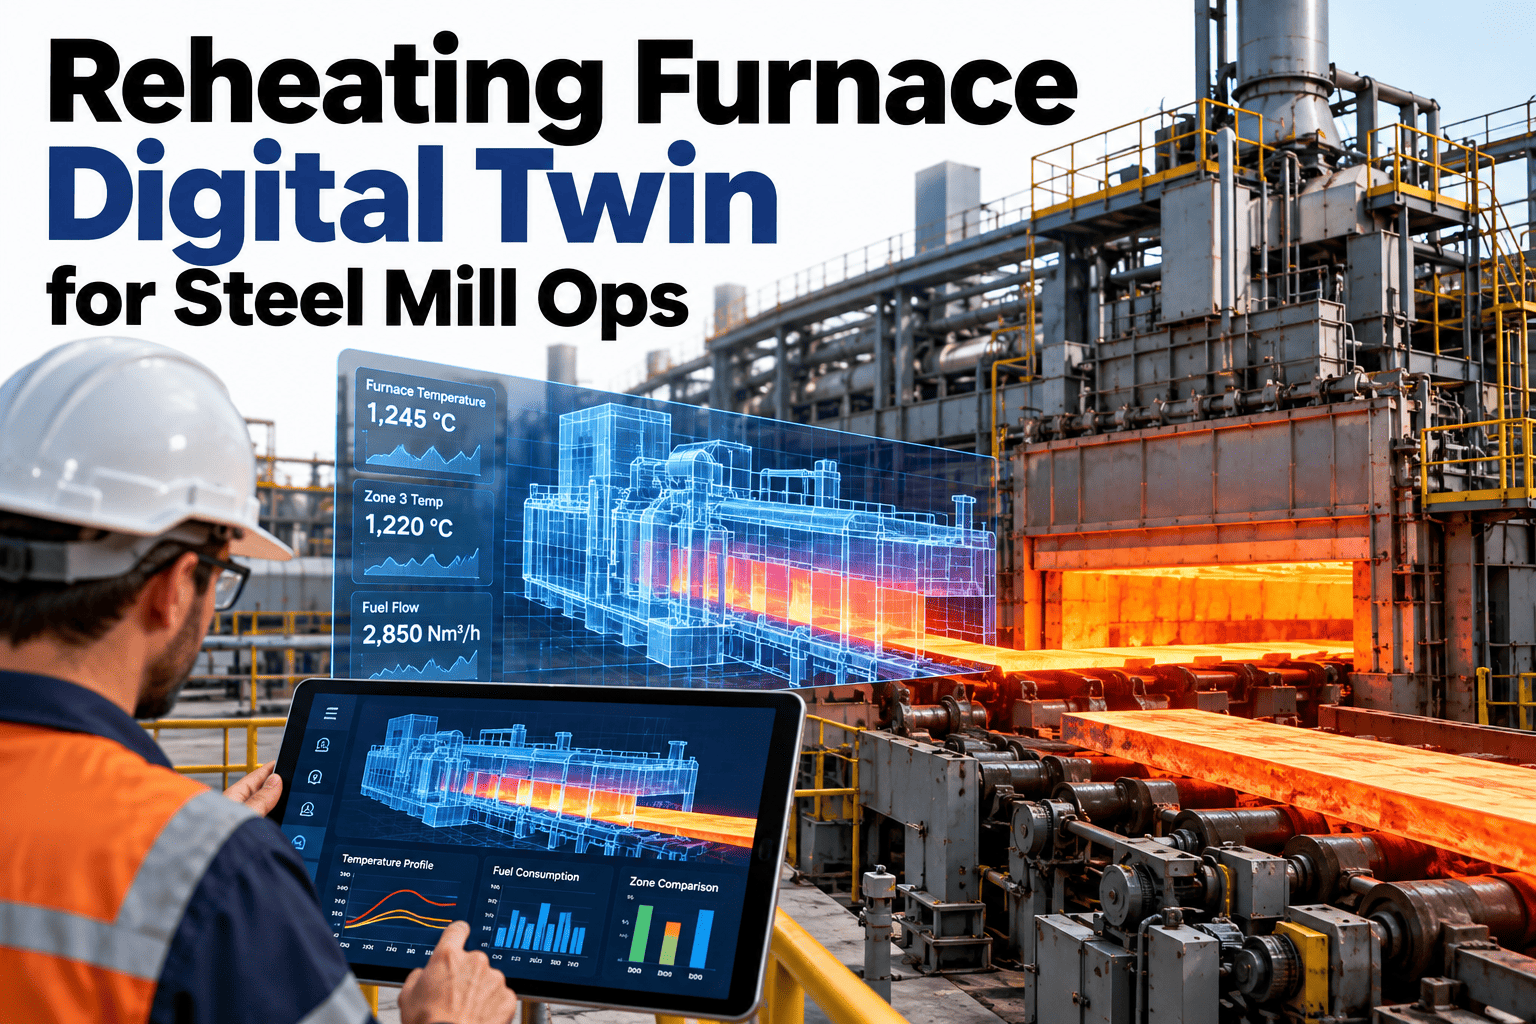
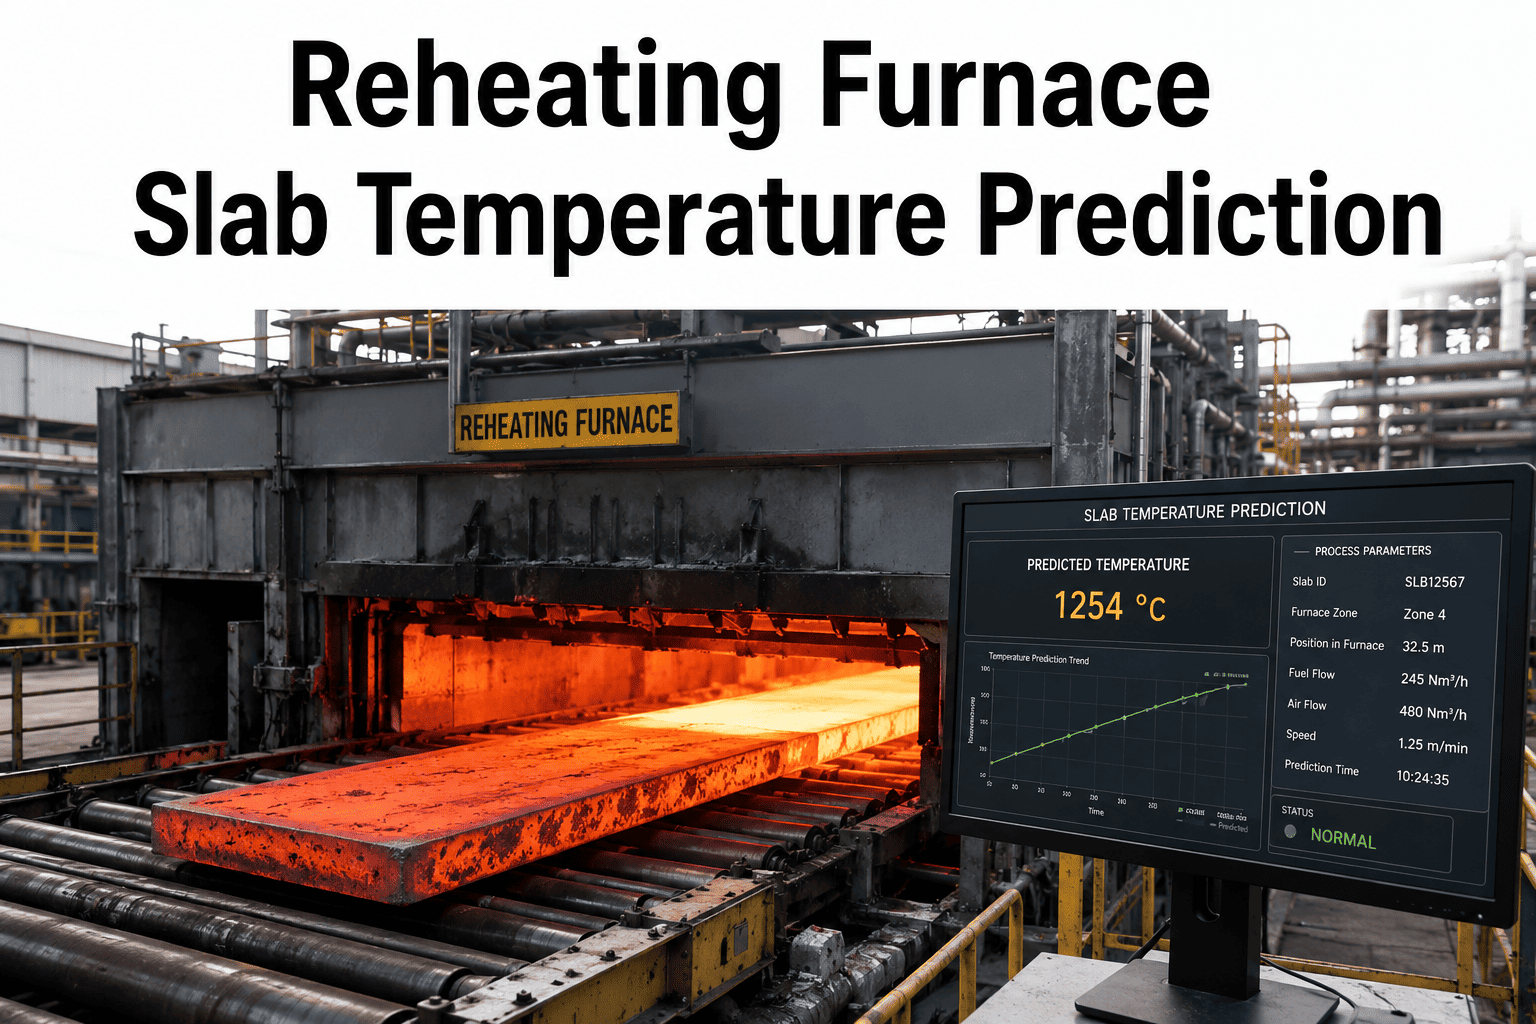
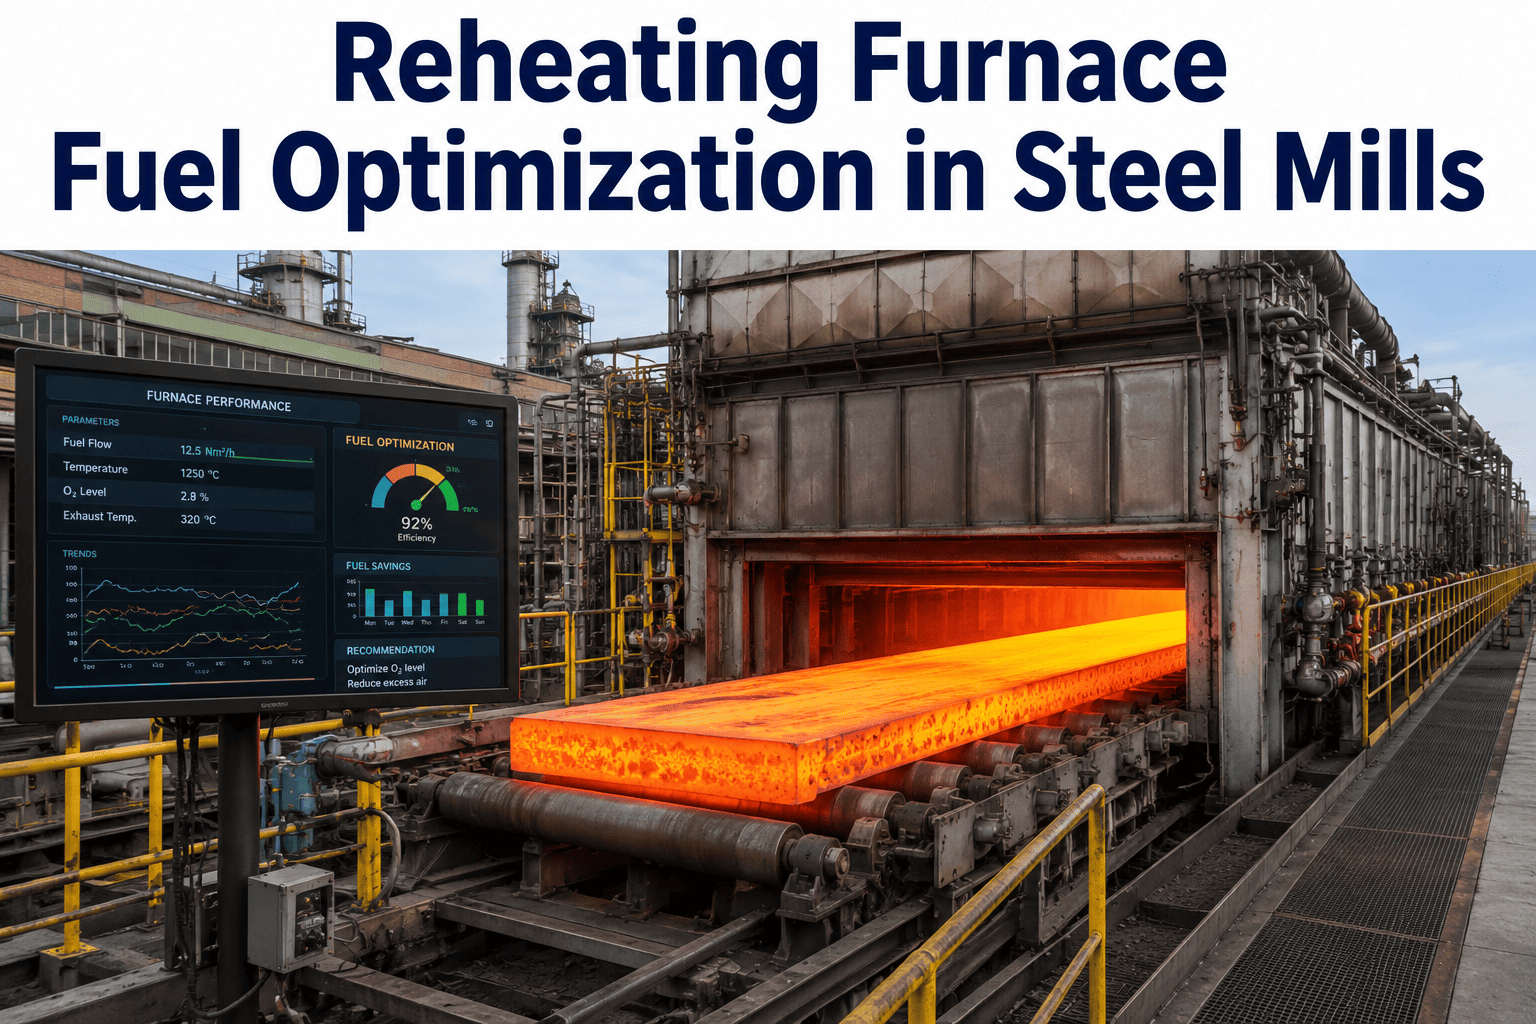
Every reheating furnace has a temperature profile, the pattern of zone setpoints that takes a slab from cold to rolling temperature. Many profiles were set years ago and are applied to every product, which often means some slabs are heated hotter or longer than they need. A product-specific profile aims to deliver the right discharge temperature and uniformity with the least fuel. Quoted savings vary widely, so each mill should test its own. To explore your profiles, you can review your furnace setpoints with our team.
Reheating furnace energy optimisation
Design Zone Temperature Profiles That Match Each Product, Not the Whole Mill
iFactory AI uses slab tracking and heating models to propose profiles that deliver the right temperature with less fuel.
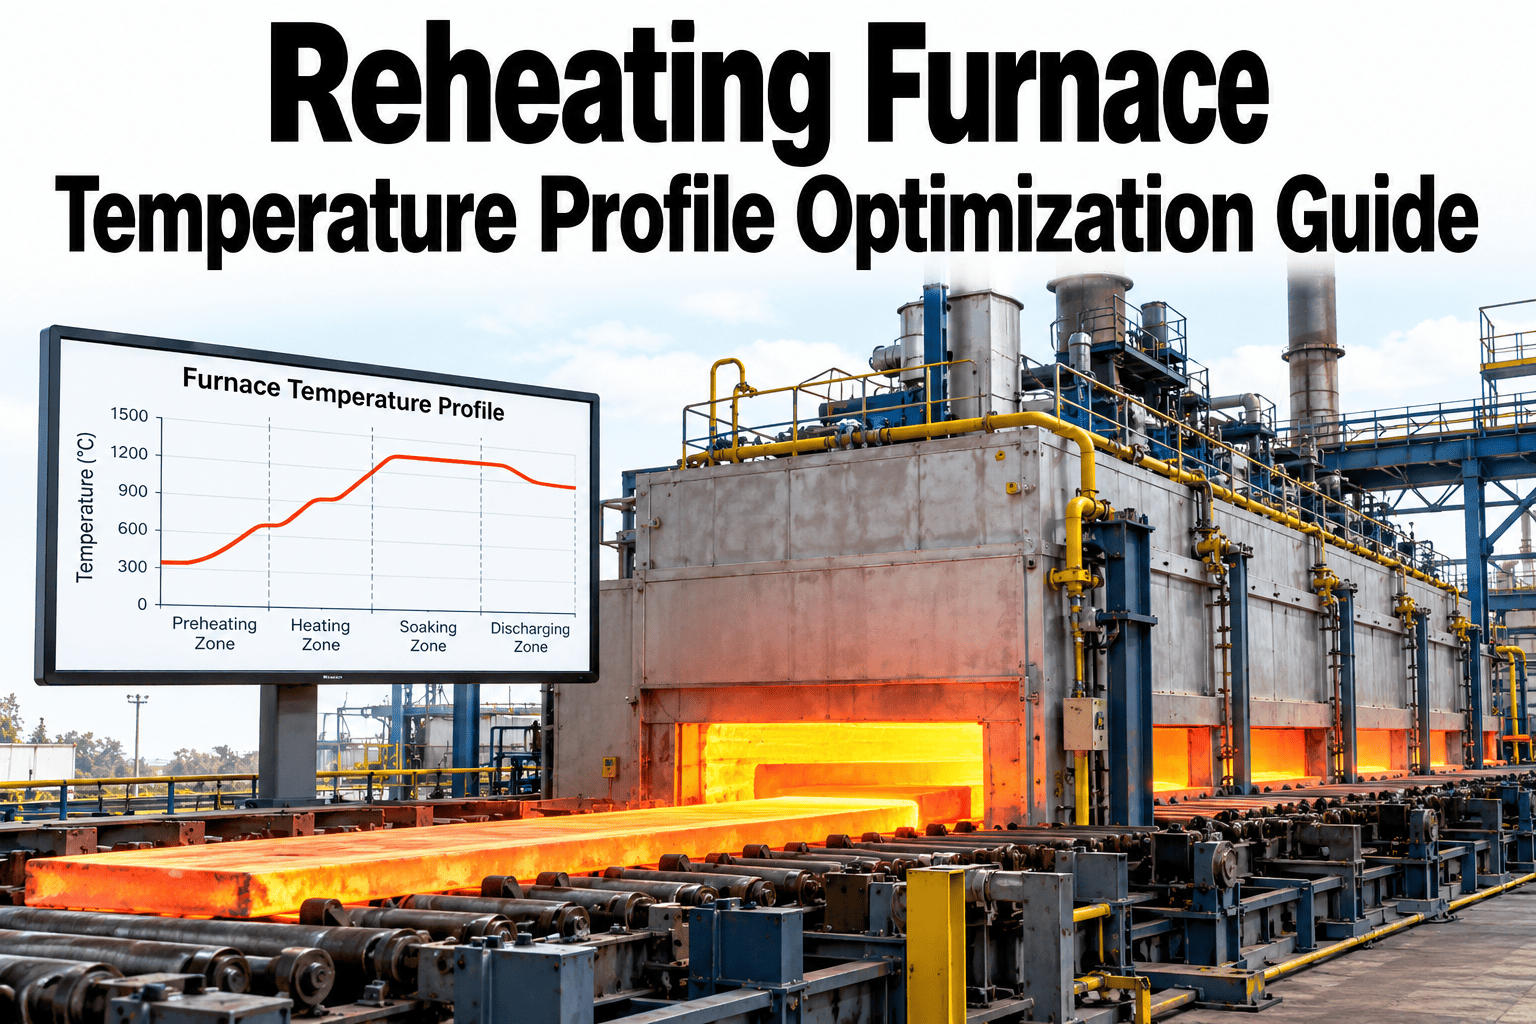
Illustrative zone setpoint profile
What a profile doesFrom Cold Slab to Rolling Temperature in Three Stages
A furnace usually has preheating, heating and soaking zones. Each does a different job.
Preheat
Slabs warm up gently using flue gas heat
Heating
High firing raises surface temperature quickly
Soaking
Temperature equalises between surface and core
Discharge
Slabs leave at the target temperature and uniformity
The setpoints and timing of each zone decide the fuel used and the quality of the heating.
What the profile must achieveFive Targets in One Profile
1
Discharge temperature
Slabs must reach the temperature the mill needs.
2
Uniformity
Surface and core should be close enough for rolling.
3
Scale control
Excess time or temperature increases scale loss.
4
Fuel use
Hotter and longer means more fuel.
5
Throughput
The profile must keep pace with the mill.
Underheating risks rolling load and quality problems. Overheating wastes fuel and creates scale. A good profile finds the safe middle.
Why one profile is rarely rightProducts Differ in Ways That Matter
Steel grade
Different grades need different temperatures and soaking.
Slab thickness
Thick slabs need more time to equalise.
Charging temperature
Hot slabs need less heating than cold ones.
Mill pace
Delays change how long slabs sit in each zone.
Target gauge
Finishing needs differ by product.
Quality requirements
Surface and mechanical targets differ.
A profile tuned for the hardest product wastes fuel on the easiest. Product-specific profiles avoid that.
See Which Products Are Being Heated More Than They Need
Share your setpoints, discharge temperatures and product mix and see how iFactory AI would identify over-heating.
Profile guideTypical Setpoint Choices and Their Trade-Offs
| Choice | Benefit | Risk |
|---|
| Lower soak temperature | Less fuel and less scale | Risk of cold cores if time is short |
| Longer soak at lower temperature | Better uniformity with less peak heat | Reduces throughput if furnace is limited |
| Higher heating zone temperature | Faster heating | More scale and uneven heating |
| Hot charge adjustment | Lower fuel for hot slabs | Needs accurate charging temperature |
| Pacing change during delays | Avoids overheating when the mill waits | Needs reliable delay information |
Heating modelFour Steps From Setpoints to Slab Temperature
1
Track the slab
Know where each slab is and how long it has been in each zone.
2
Estimate temperature
Use a heating model to estimate surface and core temperature.
3
Plan setpoints
Choose zone setpoints that meet the discharge target with least fuel.
4
Check at discharge
Compare predicted and measured temperatures and learn.
Measure discharge temperature reliably. Pyrometers need cleaning and calibration, since the model learns from them.
Where heat goesAn Illustrative Heat Balance
Profile changes mainly affect heat in the slab and flue gas. This split is illustrative.
50 percent: Heating the slab
Useful heat that reaches the steel.
30 percent: Flue gas
Hotter zones raise this loss.
10 percent: Cooling and skids
Heat lost to cooling water.
10 percent: Walls and openings
Radiation and leaks.
Savings claimsTreat Quoted Percentages as a Range to Test
Common claims
Savings quoted as a fixed percentage
Rarely tied to product mix
May ignore throughput limits
Hard to compare across mills
Better practice
Measure baseline fuel by product
Test profile changes in trials
Check discharge temperature and quality
Report savings by product group
Some suppliers quote savings in the range of several percent to over ten percent. Results depend on how conservative current practice is.
Autonomy levelsTake Control Step by Step
Advise
The model recommends profiles for each product.
Approved profiles
Operators confirm before setpoints change.
Automatic within limits
Selected profile changes apply inside strict limits.
Quality and rolling teams should help set limits. To plan yours, ask our team about profile control limits.
What improvement looks likeBefore and After Profile Optimisation
Track fuel per tonne and temperature quality. This view is illustrative.
Product-specific profiles
RolloutFive Steps to Product-Specific Profiles
1
Baseline
Record setpoints, discharge temperatures and fuel by product.
2
Group products
Cluster products with similar heating needs.
3
Model and propose
Create candidate profiles for each group.
4
Trial
Test on one product group with quality checks.
5
Extend
Roll out to other groups and review monthly.
Baseline fuel and temperature by product
Reliable discharge temperature measurement
Products grouped by heating need
Candidate profiles reviewed with rolling and quality
Trial plan with stop criteria
Scale loss and quality tracked
Fuel savings normalised for product mix
Owner from furnace, rolling mill and quality
Expert reviewWhat a Reheating Furnace Process Engineer Would Check First
Never trade rolling quality for fuel. Profile changes should be trialled on one product group with discharge temperature and quality closely watched.
Verdict
Strong when profiles are product-specific and verified at discharge.
Watch for
Savings that come from underheating and show up later as rolling problems.
Do next
Group your products and trial a lower soak on the easiest group.
Frequently asked questionsWhat Steel Mills Ask About Temperature Profile Optimisation
How much fuel can profile optimisation save?
Quoted figures range from several percent to over ten percent, but your result depends on how conservative your current profiles are and your product mix. Measure a baseline and test changes in trials.
Estimate your own savings.
Will lower setpoints hurt rolling?
They can if cores are left cold. Profiles must be verified with discharge temperature measurement and rolling feedback, with stop criteria for any trial.
Ask about safe trials.
What data does the model need?
Slab identity and tracking, zone temperatures, fuel use, discharge temperature, product details and delay information. Reliable pyrometers are important.
Check your data readiness.
Can profiles change during delays?
Yes. Good models adjust setpoints when the mill waits, to avoid overheating slabs that are stuck in the furnace. Delay information must be reliable.
Ask about delay handling.
How long before we see savings?
Trials on one product group can show results within weeks, with wider rollout over months. Track savings by product group against the baseline.
Plan a trial timeline.
Right temperature, less fuel
Heat Each Product to Exactly What It Needs
Book a session with iFactory AI to review your setpoints, group your products and plan a safe trial of product-specific profiles.