Every steel plant knows its cost per tonne. Very few know why it moved last week. The monthly number arrives after the books close, long after the furnace campaign, the maintenance stop, or the coal blend that caused it has passed. The best cost per tonne software in 2026 does something different: it breaks the figure into production, energy, maintenance, downtime and raw-material drivers while the shift is still running. Finance and works teams that want that view can ask iFactory AI how live cost driver tracking fits their plant before the next budget review.
The Best Steel Plant Cost Per Tonne Software for 2026
iFactory AI shows what is driving cost per tonne in every unit of the plant, so CFOs and works managers act on causes instead of month-end variances.
Why Cost Per Tonne Is Hard to Explain
A single cost per tonne figure blends dozens of moving parts. When it rises by a few percent, the reasons are scattered across the coke oven, blast furnace, steel melt shop and rolling mill, and each team sees only its own slice. Plants that want to see the split on their own data can schedule a 30-minute walkthrough with iFactory AI.
A total variance against budget, days or weeks after the events that caused it.
Tonnes, yields and stoppages, with no link to what each one cost.
Cost software earns its place by closing this gap: every stoppage, blend change and energy spike gets a rupee or dollar value attached at the moment it happens.
Where the Cost of a Tonne Comes From
The split below is illustrative and varies by route and plant. It shows why raw materials and energy dominate, yet downtime and maintenance are the drivers a plant can change fastest.
Small percentages still matter. On a plant producing millions of tonnes a year, one point of cost per tonne is a very large annual figure.
The Five Drivers the Software Must Surface
When comparing platforms, check that each driver is measured at unit level and tied to tonnes, not reported as a plant-wide total.
Yield and throughput
Tonnes per hour, yield loss by unit, and rework or downgrade rates, so a slow heat shows up as cost, not just delay.
Power, gas and fuel
Energy per tonne by furnace, mill and utility, with peak tariff periods visible against production schedules.
Planned and reactive spend
Repair cost, spares consumption and the share of work that was emergency rather than planned.
Lost hours with a price
Every stoppage valued by the tonnes and margin it removed, ranked so the costliest causes come first.
Ore, coal, scrap and alloys
Consumption per tonne, blend changes and quality variation linked to their effect on furnace performance.
One cost per tonne, fully explained
iFactory AI joins them so a rise in the total always points to a named cause.
See Your Own Cost Drivers Ranked
Book a 30-minute session and iFactory AI will walk through how your cost per tonne could be split across production, energy, maintenance, downtime and raw materials.
How to Judge Cost Per Tonne Software
Use this table as a shortlist filter. A platform that fails the first two rows will only reproduce the monthly report faster. To test any vendor against these rows with your own numbers, reserve a live session with the iFactory AI team.
| Criterion | What Good Looks Like | Warning Sign |
|---|---|---|
| Update speed | Cost per tonne refreshed every shift or daily | Figures appear only after month-end close |
| Driver breakdown | Variance split into named causes by unit | One total variance with no attribution |
| Data sources | Reads ERP, MES, energy and maintenance data together | Needs manual spreadsheet uploads |
| Audience fit | Views for CFO, works manager and unit heads | One dashboard for everyone |
| Deployment | Live in weeks, with training and monitoring included | Long project with no early value |
One Number, Two Different Questions
The CFO and the works manager look at the same tonne but ask different things. Good software answers both from one dataset, and a joint session for finance and operations is the quickest way to prove it.
A Composite Example: The Variance Nobody Could Place
Consider a mid-sized steel plant whose cost per tonne rose more than budgeted for two consecutive months. Finance blamed raw material prices, while operations blamed a run of unplanned stops.
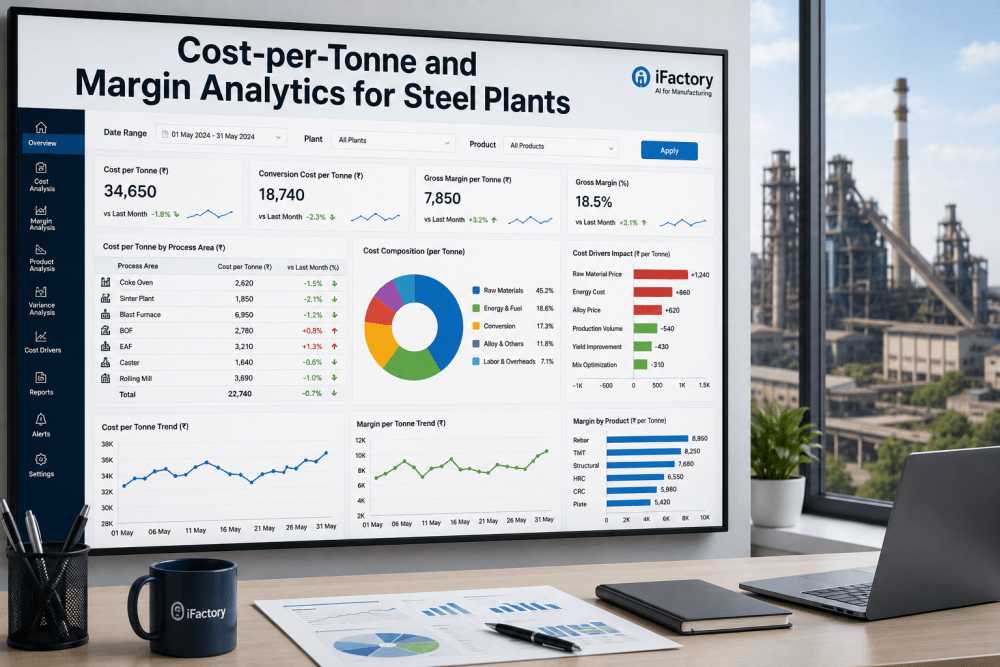
The cost dashboard shows the rise and splits it by driver group.
Reactive maintenance and repeat stops on one mill outweigh the price effect.
A planned outage replaces recurring emergency stops on that unit.
The next weeks show cost per tonne returning toward budget.
This is an illustrative scenario, not a customer result. It shows the pattern: attribution first, then a targeted fix. See how the same attribution would look on your plant in a short guided session.
Where iFactory AI Fits
iFactory AI connects plant and finance data into a single cost per tonne model, then keeps it current as production, energy and maintenance data change. The fastest way to judge the fit is to watch it run against a sample of your own cost data.
Live driver attribution
Each change in cost per tonne is traced to a driver group and unit, not left as an unexplained variance.
Downtime valued in money
Stoppages are ranked by their cost impact, so the maintenance plan targets the events that cost most.
Energy and raw material links
Consumption per tonne is shown next to production data, making blend and load decisions visible.
Ask in plain language
Managers can ask why cost rose this week and receive the ranked drivers instead of building a report.
iFactory AI arrives pre-configured on an NVIDIA server that ships racked and ready with software pre-loaded. Scope covers cabling, network, ERP and MES integration, team training and 24x7 remote monitoring.
Frequently Asked Questions
What is steel plant cost per tonne software?
It is a platform that calculates cost per tonne continuously and breaks it into drivers such as energy, maintenance, downtime and raw materials. Instead of one month-end number, teams see what moved it and where. Most plants start by seeing a live demonstration on their own unit structure, which shows quickly whether the driver split matches how the plant actually runs. Questions about scope can go to the iFactory AI support team.
How is this different from our ERP cost report?
An ERP report is accurate but usually delayed and aggregated, so it confirms a variance without explaining it. Cost driver analytics combines plant data with finance data and refreshes far more often. It complements the ERP by adding the causes behind each movement, ranked by value. A side-by-side session comparing your ERP report with a live driver view makes the difference easy to see.
Which teams benefit most from the software?
CFOs and finance controllers gain faster, explained variances, while works managers and maintenance heads gain ranked causes they can act on. Procurement also benefits from seeing how raw material choices affect furnace and mill performance. Because each group works from the same numbers, review meetings shift from debating figures to deciding actions. You can bring finance and operations leads to one shared demo session to see both views.
How long does deployment take?
iFactory AI is delivered turnkey and typically goes live in 6 to 12 weeks, covering installation, integration, training and remote monitoring. The first phase connects data, the second validates the cost model against actuals, and the third hands over dashboards. Request a timeline walkthrough for your plant to see which systems would be connected first, or ask support for the integration checklist.
Can it work across different steel routes?
Yes. Integrated plants and scrap-based mills have different driver mixes, so the cost model is set up around your own units and process stages. The same principle applies in both: attribute each change in cost per tonne to a specific cause and unit, then rank the causes by value. To see it configured for your route, arrange a tailored product tour with the iFactory AI team and share your unit list beforehand.
Know What Moves Your Cost Per Tonne
iFactory AI turns cost per tonne from a monthly report into a live, explained number. Book a walkthrough to see it built around your own units and cost drivers.