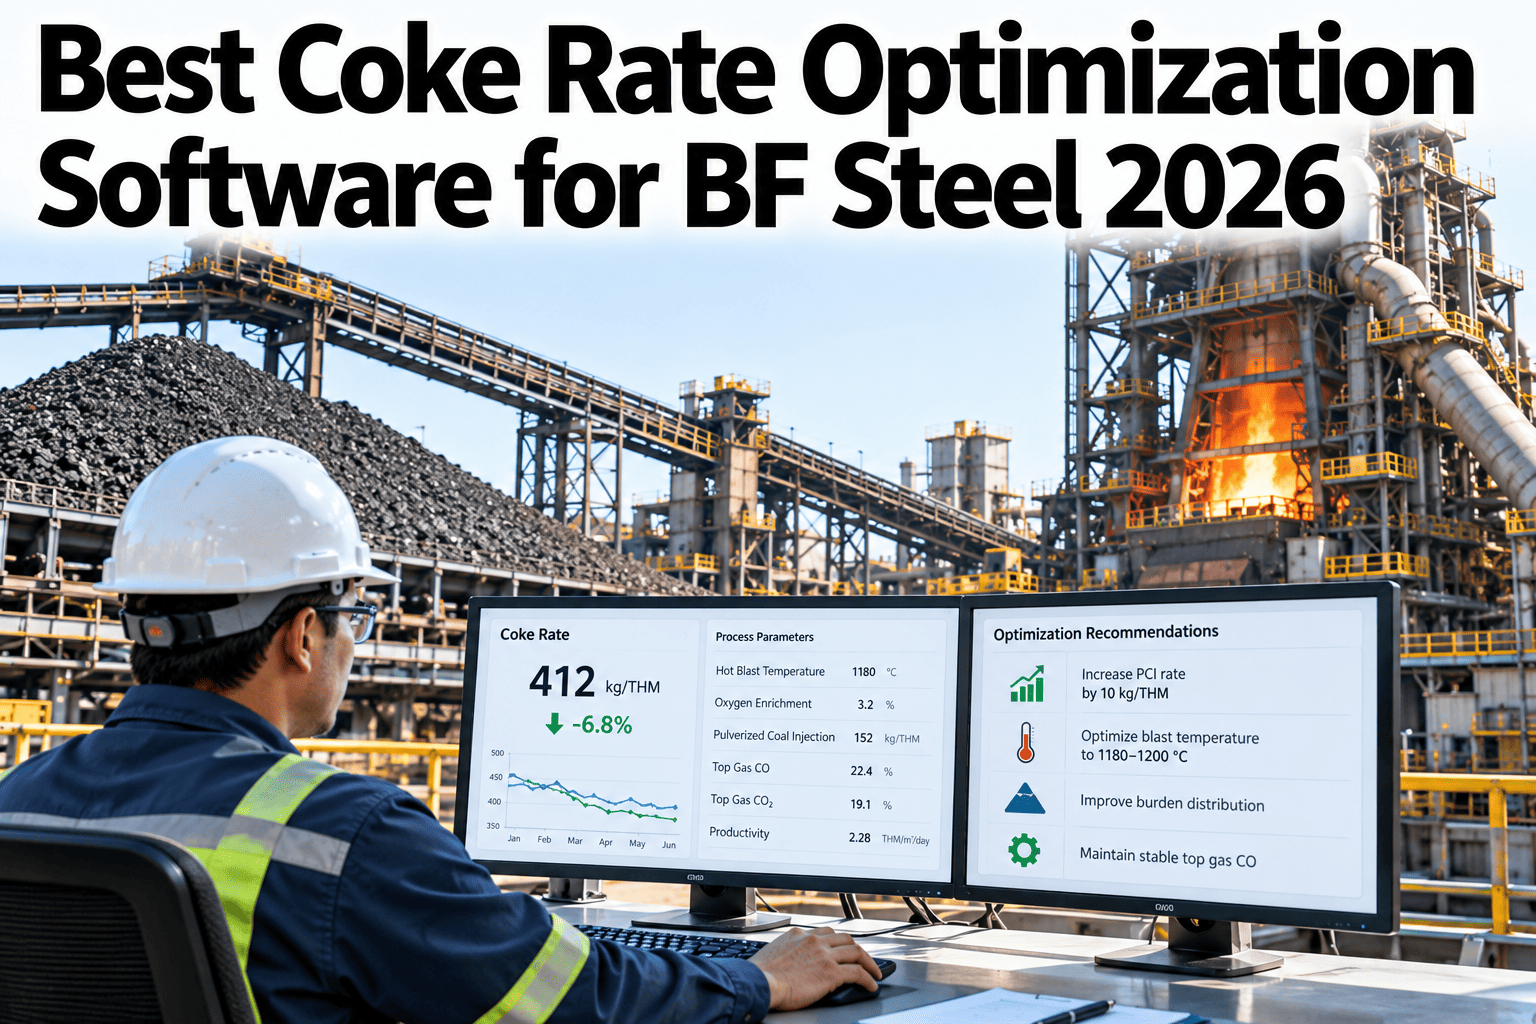
Coke is the largest single fuel cost in blast furnace ironmaking, so every kilogram saved per tonne of hot metal adds up quickly across a year. Some suppliers claim coke rate reductions of fifteen to forty kilograms per tonne, but the real figure depends on where your furnace starts, the quality of your raw materials and how stable your operation is. Real-time models that combine injected fuel, burden and process data help operators find safe savings. To see where your furnace could improve, you can review your fuel rate data with our team.
Coke and fuel rate optimisation
Trim Coke Rate Safely With Real-Time Models of Fuel, Burden and Process
iFactory AI combines injection, burden and process data so furnace teams can lower coke rate without risking stability.
Illustrative coke rate reduction in kg per tonne
Why coke rate mattersThe Largest Fuel Line in Ironmaking
Coke supplies heat, reduction and the structure that keeps the furnace permeable. Cutting it must not weaken those roles.
Cost
Coke is a major share of hot metal cost
Carbon
Less coke means lower emissions per tonne
Supply
Coke quality and availability can be constrained
Risk
Cutting too fast can destabilise the furnace
The prize is real, but so is the risk. Good optimisation balances both.
Fuel rate and replacementCoke and Injected Fuel Work Together
Fuel rate = coke rate + injected fuel rate
Injected fuels such as pulverised coal replace some coke, but not kilogram for kilogram. The replacement ratio is usually below one.
Net coke saving = injected fuel added x replacement ratio
Replacement ratios depend on fuel quality, blast conditions and furnace state. Measure yours instead of assuming.
A worked exampleWhat Twenty Kilograms per Tonne Is Worth
All numbers are illustrative. Replace them with your own.
3,000,000
Hot metal tonnes per year
20 kg
Coke reduction per tonne
60,000 t
Coke saved per year
18,000,000
Gross value at 300 per tonne of coke
The net saving is lower once any extra injected fuel and extra costs are included. Always show gross and net values separately.
See What Your Fuel Rate Could Be Worth
Share a few months of coke, injection and production data and see how iFactory AI would estimate safe savings for your furnace.
The leversSix Ways Operators Influence Coke Rate
Burden quality and distribution
Better raw materials and loading improve gas flow and efficiency.
Injection rate and coal quality
More injection can replace some coke.
Blast temperature and enrichment
Higher heat and oxygen change the heat balance.
Top gas utilisation
Better use of gas improves efficiency.
Thermal stability
Steadier hot metal temperature allows safer fuel cuts.
Permeability and slag
Good gas flow and slag practice protect stability.
Levers interact. A model that sees all of them together finds combinations a single rule of thumb misses.
Lever guideEffect on Coke and the Trade-Off to Watch
| Lever | Typical effect on coke | Trade-off or limit |
|---|
| More injected fuel | Can replace some coke | Limited by combustion and furnace stability |
| Higher blast temperature | Can reduce coke demand | Limited by equipment and gas flow |
| Better burden | Lower fuel demand and steadier operation | Raw material cost and availability |
| Higher top gas utilisation | Improves efficiency | Needs stable gas flow |
| Tighter thermal control | Allows less safety margin | Needs reliable forecasts |
How the optimisation worksFour Steps From Data to Advice
1
Measure
Collect burden, blast, injection, top gas and quality data.
2
Model
Estimate the furnace state and how fuel changes will affect it.
3
Optimise
Search for lower-fuel settings inside safe limits.
4
Advise or act
Show recommendations or apply approved changes.
Safe limits come first. The model should never suggest actions that push the furnace outside agreed operating windows.
Data sourcesBring Raw Material, Process and Lab Data Together
Burden and raw material dataBlast and injection dataTop gas and cooling data
Fuel optimisation model
Operator adviceSetpoint proposalsFuel rate reports
Coke quality, such as strength and reactivity, strongly affects results. Include it in the model.
Rules versus modelsWhat Changes With a Process Model
Rules of thumb
One-size-fits-all adjustments
Slow to reflect raw material changes
Single lever focus
Hard to test before use
Model-based advice
Reflects current furnace state
Adapts to raw material changes
Considers several levers together
Can be tested against history first
Autonomy levelsTake Control Step by Step
Advise
The model suggests and operators decide.
Approved setpoints
The model proposes setpoint changes inside limits.
Closed loop
Selected setpoints are adjusted automatically within strict bounds.
Many furnaces stay at the first two levels for a long time. To plan yours, ask our team about autonomy and safety limits.
Where savings come fromAn Illustrative Split by Lever
The mix differs by furnace. This split is illustrative.
35 percent: Burden and gas flow
Better loading, quality and permeability.
30 percent: Injection and blast
Adjusted fuel and heat settings.
20 percent: Thermal stability
Steadier operation allows lower margins.
15 percent: Other effects
Operating practice and timing.
Aggressive versus stableDo Not Trade Stability for a Lower Number
Pushing fuel rate down too fast can harm stability and productivity.
Fuel strategy
Stable furnace
Unstable furnace
Gradual cuts
Best path
Steady savings with low risk
Fix stability first
Instability makes any cut risky
Aggressive cuts
Higher risk
Savings may be lost to upsets
Avoid
High risk of serious upset
Treat claims of large reductions with care. Start from your own baseline and move in small, measured steps.
RolloutFive Steps to Safe Fuel Savings
1
Baseline
Record coke, injection, productivity and quality for several months.
2
Check raw materials
Review coke and burden quality and variation.
3
Back-test the model
Compare model advice with past operation.
4
Run in advisory mode
Show suggestions beside operator decisions.
5
Adopt step by step
Move to approved setpoints with strict limits.
Baseline of coke, injection and productivity recorded
Coke and burden quality data included
Replacement ratio measured for your fuels
Operating windows and safety limits agreed
Model back-tested on past operation
Advisory mode run with operator review
Savings measured as gross and net
Owner from furnace operations, raw materials and process
Expert reviewWhat an Ironmaking Process Manager Would Check First
Expert review
Coke saving is a stability story. The strongest programmes improve raw material quality, thermal stability and permeability first, then trim fuel inside those safer limits.
VerdictStrong when savings are measured net of injection and respect operating windows.
Watch forSavings claims that ignore raw material changes and stability.
Do nextRecord a baseline, check raw material variation and run a model in advisory mode.
Frequently asked questionsWhat Steelmakers Ask About Coke Rate Optimisation
Can software really cut coke rate by fifteen to forty kilograms per tonne?
Some suppliers claim reductions in that range, but results depend on your starting point, raw material quality, injection practice and stability. Treat such figures as a range to test with a back-test and an advisory trial on your own furnace.
Test claims on your data.
How do we measure net savings?
Compare coke saved with any extra injected fuel and other costs, using the replacement ratio measured on your furnace. Report gross and net separately, and compare against a documented baseline.
Ask about net savings methods.
Will lowering coke rate hurt stability?
It can, if done too fast. Good programmes work inside agreed operating windows, move in small steps and give priority to permeability and thermal stability.
Discuss safe limits.
What data does the model need?
Burden composition and quality, coke quality, blast and injection data, top gas and cooling data, plus hot metal results. Good time alignment between systems is essential.
Ask about data readiness.
How long before we see savings?
Advisory trials can show potential within weeks. Realised savings follow as operators adopt recommendations and raw materials and stability allow. Review results monthly.
Plan a pilot timeline.
Lower fuel rate, stable furnace
Find Safe Savings in Your Furnace's Fuel Rate
Book a session with iFactory AI to review your baseline, test a process model in advisory mode and plan fuel savings that protect furnace stability.