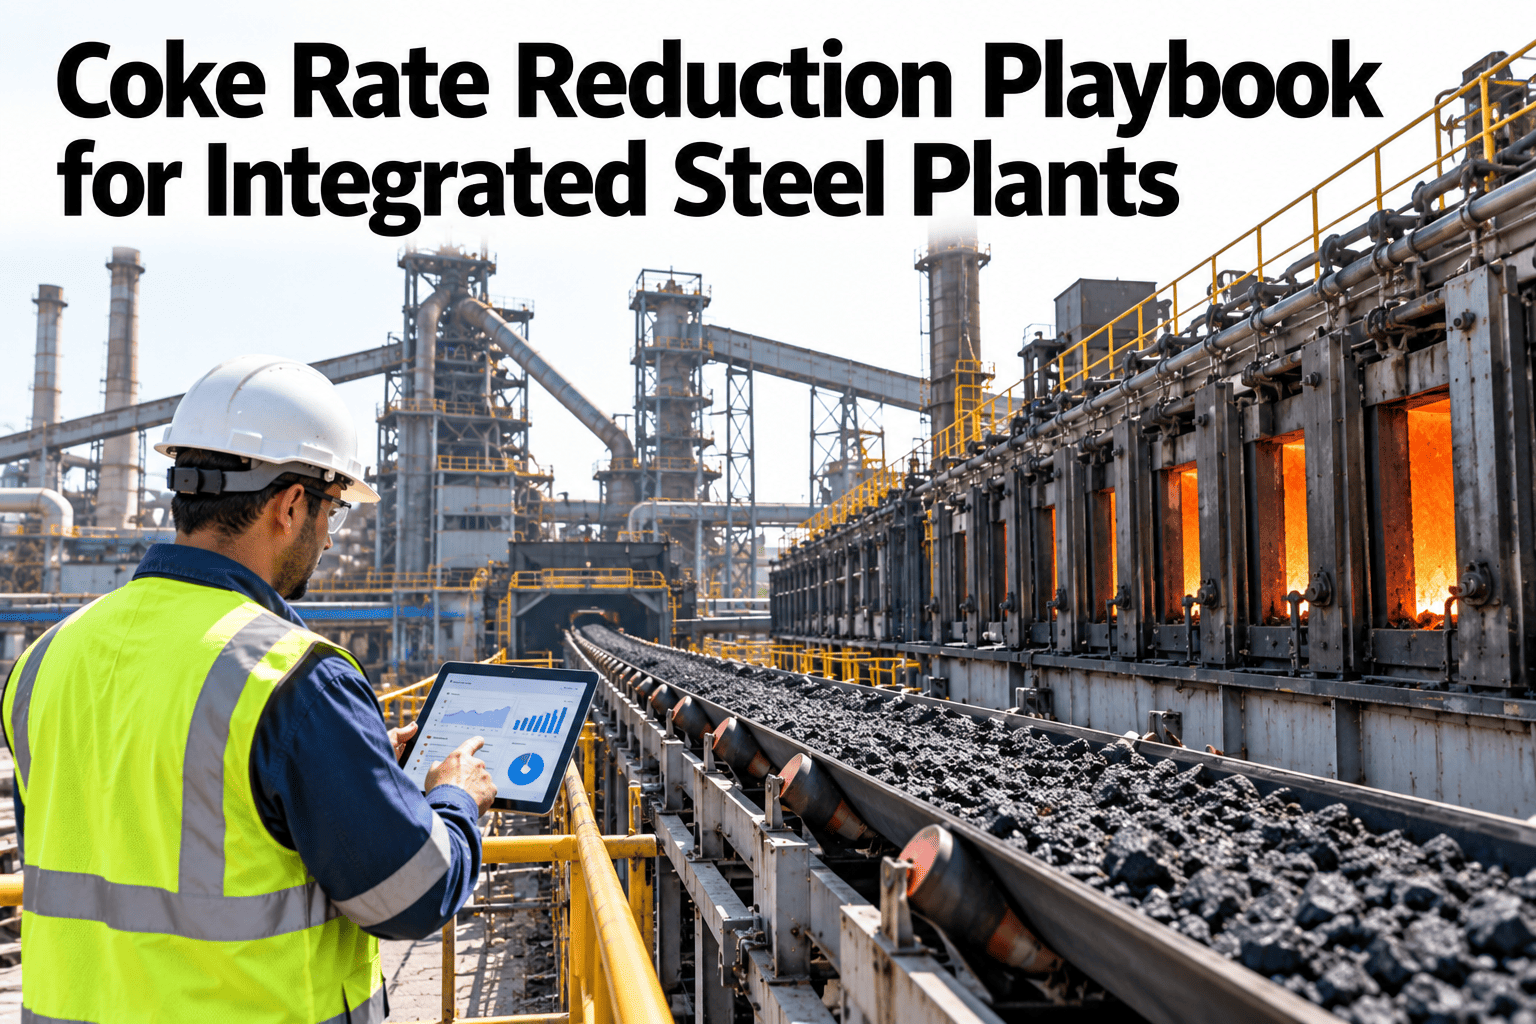
Reducing coke rate is rarely about one big change. It is the combined result of better burden preparation, stronger top gas efficiency, expanded pulverised coal injection and steady operation. Programmes that combine these steps are sometimes quoted as delivering thirty to sixty kilograms of coke per tonne of hot metal, but the real result depends on where a plant starts. This playbook sets out a practical order of work and how to measure the outcome honestly. To discuss your own starting point, you can review a coke reduction roadmap with our team.
Coke and fuel rate optimisation
A Practical Order of Work for Cutting Coke Rate in an Integrated Plant
iFactory AI helps integrated steel plants sequence burden, gas efficiency and injection improvements and track the savings against a baseline.
Illustrative staged reduction in coke rate
Where to startFour Workstreams That Build on Each Other
Each step makes the next one safer and more effective.
Burden preparation
Better raw materials and loading
Top gas efficiency
Better use of reducing gas
PCI expansion
More coal replacing coke
Stable operation
Steady running that protects the gains
Skipping the early steps usually means later steps cannot be pushed as far.
Know your baselineMeasure Before You Change Anything
Fuel rate = coke rate + injected fuel rate
Record several months of coke rate, injected fuel, productivity, hot metal quality and stability. Note raw material changes that explain movements.
Savings claims are only credible against a documented baseline that accounts for raw material and production changes.
Burden preparationSix Actions That Improve What Goes Into the Furnace
Screen fines
Remove undersize material that blocks gas flow.
Improve sinter quality
Stronger, more reducible sinter helps efficiency.
Raise pellet share where practical
Pellets can improve permeability and reducibility.
Control coke quality
Strength and reactivity affect how coke performs in the furnace.
Stabilise chemistry
Consistent composition keeps the furnace steady.
Improve charging distribution
Smart loading shapes gas flow.
These actions often have modest cost compared with their fuel effect. They also make later steps safer.
Find Your Quickest Route to a Lower Coke Rate
Share your burden, fuel and production data and see how iFactory AI would rank the workstreams for your furnace.
Top gas efficiencyUse the Reducing Gas Better on Its Way Up
Gas that leaves the furnace with unused reducing power wastes fuel. Better distribution of burden and gas improves use.
1
Measure
Track top gas composition and temperature.
2
Diagnose
Find uneven gas flow and wasted potential.
3
Adjust charging
Change distribution to shape the gas path.
4
Check results
Watch gas utilisation, stability and fuel rate.
Gas efficiency depends on permeability. Poor burden quality limits how much distribution changes can help.
PCI expansionAdd Coal Only When the Furnace Is Ready
Raising injection replaces coke but needs good grinding, even injection and a stable furnace.
| Prerequisite | Why it matters | How to check |
|---|
| Fine, consistent coal | Burns fully in the raceway | Fineness and moisture trends |
| Even injection across tuyeres | Avoids local upsets | Tuyere flow data |
| Stable thermal state | Allows safe margin changes | Hot metal temperature and silicon |
| Good permeability | Handles added load | Pressure drop and gas flow |
| Reliable coal supply | Supports steady blends | Supply and quality records |
Protecting the gainsStable Operation Is the Foundation
Raw material consistency
Steady quality supports steady running.
Thermal control
Hot metal temperature kept within a narrow band.
Permeability management
Gas flow monitored and protected.
Operator discipline
Clear rules for responding to changes.
A furnace that swings between hot and cold wastes the savings made elsewhere.
SequenceOrder the Work to Reduce Risk
Stage 1: BaselineMeasure and document the starting point
Stage 2: BurdenImprove raw materials and loading
Stage 3: Gas efficiencyImprove distribution and utilisation
Stage 4: PCIExpand injection with monitoring
Stages can overlap, but each should lead the next. To plan your sequence, ask our team for a coke reduction sequencing worksheet.
Where savings come fromAn Illustrative Split by Workstream
The mix differs by plant. This split is illustrative.
30 percent: Burden preparation
Quality and loading.
25 percent: Top gas efficiency
Better use of reducing gas.
30 percent: PCI expansion
More coal replacing coke.
15 percent: Stability
Fewer upsets and swings.
Honest expectationsQuoted Reductions Depend on the Starting Point
Plants starting from weaker conditions
More room to improve
Gains come from basics
Savings can be larger
Risks are higher if steps are rushed
Plants already well optimised
Less room to improve
Gains are small and hard won
Savings are smaller
Stability matters even more
Ranges of thirty to sixty kilograms per tonne are sometimes quoted for combined programmes. Treat them as upper cases and test against your own baseline.
A 90-day startThree Phases to Begin
Days 1 to 30
Record the baseline and review burden and coke quality.
Days 31 to 60
Fix the top burden and charging issues and review gas efficiency.
Days 61 to 90
Plan PCI expansion and agree stability limits and targets.
Baseline fuel rate, productivity and quality recorded
Raw material changes logged with dates
Screening, sinter and coke quality reviewed
Charging distribution and gas efficiency assessed
PCI prerequisites checked
Stability limits agreed with operations
Savings method agreed with finance
Owner from furnace, raw materials and energy
Expert reviewWhat an Integrated Plant Ironmaking Head Would Check First
Expert review
Big coke savings come from many small improvements done in the right order. The plants that succeed measure honestly and protect stability at every step.
VerdictStrong when work is sequenced, measured against a baseline and stability limits are respected.
Watch forProgrammes that chase a headline number and ignore furnace condition.
Do nextRecord a baseline and fix the single largest burden problem first.
Frequently asked questionsWhat Integrated Plants Ask About Coke Rate Reduction
Is a thirty to sixty kilogram reduction realistic?
Reductions in that range are sometimes quoted for programmes that combine several improvements from a weaker starting point. Your own result depends on your baseline, raw materials and stability, so test any figure on your own data.
Test a target on your baseline.
Which step should we do first?
Start with measurement, then burden preparation, since better raw materials and loading make every later step safer and more effective.
Ask about sequencing.
How do we separate real savings from raw material effects?
Record raw material changes, normalise results where possible and compare similar periods. Agree the method with finance before the programme starts.
Plan a baseline method.
What role does AI play in the programme?
AI can combine burden, process and fuel data to show headroom, flag instability and advise on adjustments. People remain responsible for decisions and safety limits.
Ask about AI roles.
How do we keep savings from fading?
Track fuel rate, stability and raw material quality continuously, review monthly and keep operating rules clear. Savings fade when quality or discipline slip.
Plan a review rhythm.
Many small steps, one lower coke rate
Build a Coke Reduction Programme That Delivers
Book a session with iFactory AI to record your baseline, rank your workstreams and plan a sequence that cuts coke rate without risking the furnace.