An integrated steel plant burns most of its energy in a handful of process steps, yet it usually reports one number: gigajoules per tonne of crude steel. That figure is useful only when it is measured on a clear boundary and compared with the right reference. Benchmarking against published industry bands, then breaking the gap into process steps, shows where energy is actually being lost and how much of it a plant can realistically recover. Finance and operations teams can see how iFactory AI builds a step-by-step GJ per tonne benchmark on live plant data before setting energy targets for the year.
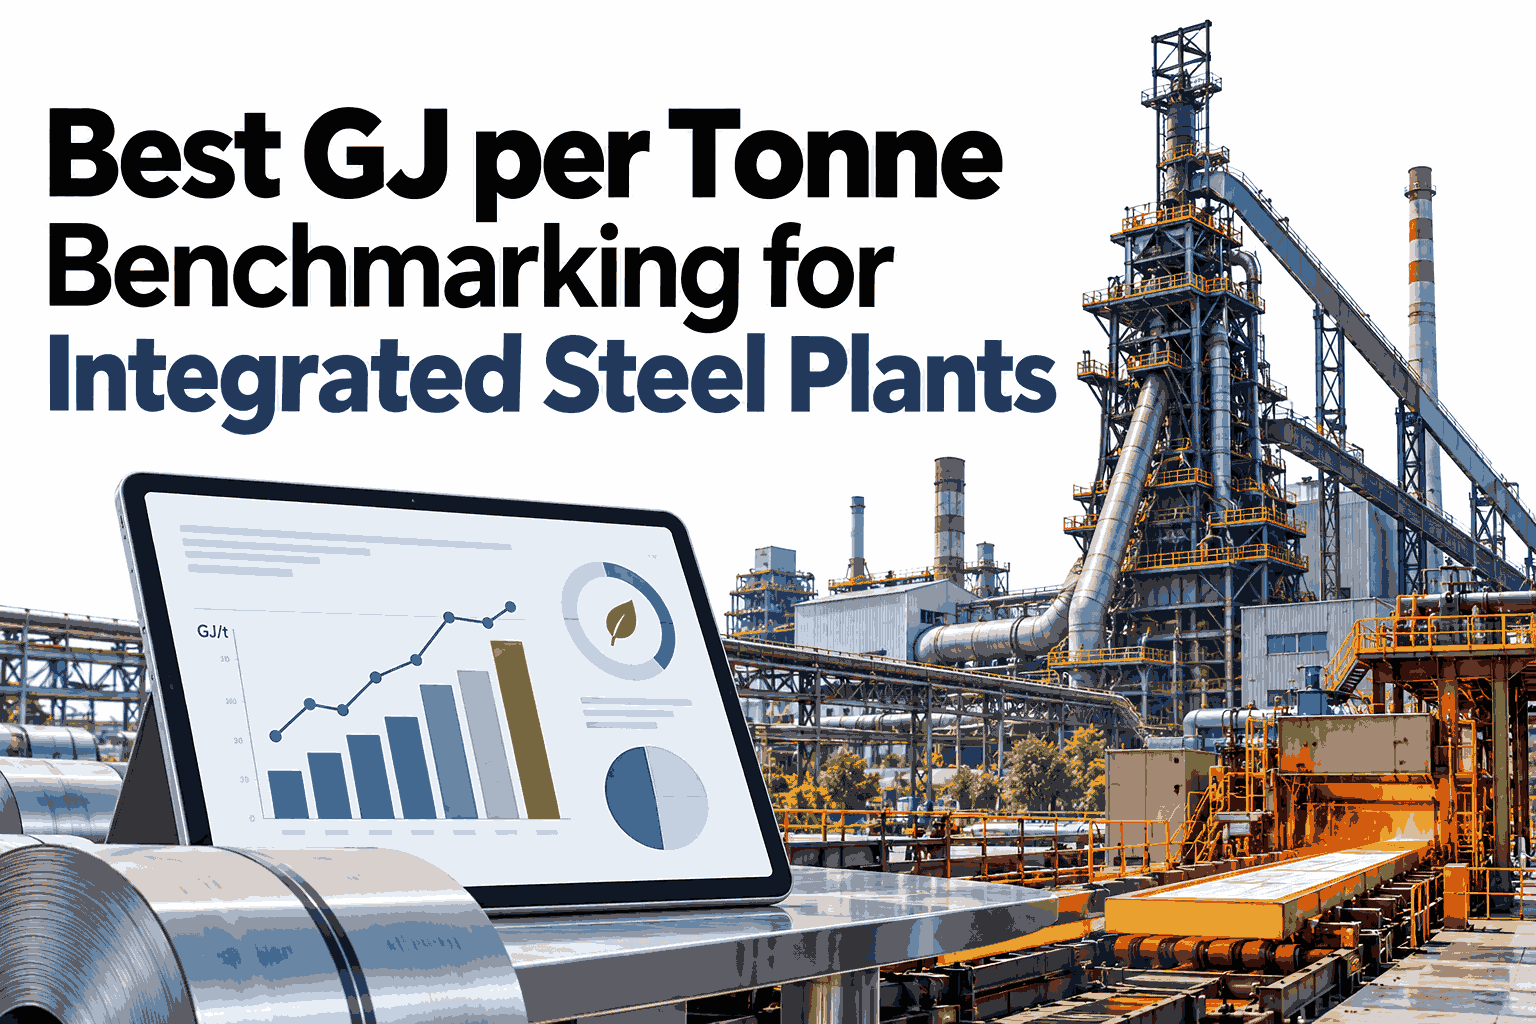
Best GJ per Tonne Benchmarking for Integrated Steel Plants
Place your plant against industry bands, split the gap by process step and turn it into a roadmap the CFO and plant head can both back.
Four Boundary Questions Before Any Comparison
Two plants can report very different GJ per tonne for reasons that have nothing to do with efficiency. Settle these four questions first.
Coke ovens, sinter or pellet plants and on-site power change the total a great deal.
Blast furnace and coke oven gas can be exported, reused or flared, and each choice moves the figure.
Crude steel, hot metal and finished product tonnes give different results for the same energy.
Purchased fuel, electricity and oxygen, and whether upstream energy is included, must be stated.
Reading Benchmark Bands
Industry bodies such as worldsteel publish energy intensity data that plants use as a reference. Confirm the current published figures and their boundaries before you rely on them, because both change over time. The band view below is illustrative and carries no plant numbers.
Position inside a band matters less than movement over time. A plant that moves from typical toward good, with the boundary unchanged, has made a real gain.
See Where Your Plant Sits in the Band
Book a 30-minute session and iFactory AI will show how your GJ per tonne is measured, put on a clear boundary and placed against published benchmark bands.
Which Process Steps Carry the Energy
Splitting the total by step shows where effort will pay. The donut below is an illustrative split for an integrated route, and your own shares will differ.
In this example the blast furnace and coke making together carry well over half the energy. A programme that starts with rolling would work on a small slice while the biggest one goes untouched.
Adjust Before You Call It a Gap
Some differences are structural. Remove them so the remaining gap is one the plant can act on.
Ore grade, coal quality and burden make a large difference to fuel demand.
Flat and long products need different rolling energy per tonne.
Running below capacity raises energy per tonne, particularly at large furnaces.
Older assets and long transfer routes lose more heat between steps.
A Gap-Closure Roadmap
Once the adjusted gap is known, rank the actions by value and effort. A guided roadmap session on your own data can size each action before budgets are set.
| Action Area | Typical Horizon | What It Targets |
|---|---|---|
| Fuel rate control | Quick | Reducing reducing-agent use at the blast furnace |
| Gas recovery and use | Quick to medium | Cutting flaring and putting process gas to work |
| Hot metal and BOF practice | Medium | Lowering heat losses and improving charge practice |
| Reheating and rolling | Medium | Shorter hold times and better scheduling |
| Waste heat and upgrades | Long | Capital projects with the largest structural gains |
One Benchmark, Two Readers
The same benchmark answers different questions for finance and the plant. Good software serves both from one dataset.
Where iFactory AI Fits
iFactory AI puts energy on one consistent boundary, converts every carrier to GJ and tracks the result against your chosen reference.
Step-level contribution
Total GJ per tonne is split by process step, showing which one drives the gap.
Clear boundary handling
Scope, gas credits and denominators are recorded with the model, so each result can be defended.
Adjusted comparison
Raw material, mix and utilisation effects are separated from the gap the plant can control.
Ask in plain language
Ask which step pushed GJ per tonne up this month and receive the ranked drivers.
iFactory AI arrives pre-configured on an NVIDIA server that ships racked and ready with software pre-loaded. Scope covers cabling, network, ERP and MES integration, team training and 24x7 remote monitoring.
Frequently Asked Questions
What is a good GJ per tonne for an integrated plant?
There is no single number, because the answer depends on boundary, raw materials, product mix and how gases are credited. Use current published industry data for reference, then adjust for your own conditions. A plant improving against its own adjusted baseline is a stronger signal than any headline value. You can walk through a like-for-like comparison in a live session.
How do we define the benchmark boundary?
List the steps included, the energy carriers counted, how gases and power are credited and which tonne the figure is divided by. Write it down once and apply it every period. Consistency matters more than the exact choice. To settle yours, request a boundary working session with the iFactory AI team, or ask support for the boundary checklist.
Which process step should we tackle first?
Start with the step that carries the biggest share of energy and shows the widest adjusted gap, which is often the blast furnace in an integrated plant. Quick wins in fuel rate and gas use usually come before capital projects. A short product tour of step-level ranking shows how the order is set.
How often should we benchmark?
Track GJ per tonne monthly at plant and step level, refresh external references when new data is published and revisit the boundary yearly. Continuous tracking is helpful because drift shows up early. See how continuous tracking works on live data in a guided walkthrough.
Can the benchmark support investment cases?
Yes. A step-level gap sized in GJ and converted to cost gives each project a clear value, and adjustments show which gains are structural. That makes the case easier to defend to the board. Schedule a walkthrough of investment case support to see how the numbers are built.
Turn a GJ per Tonne Gap Into a Plan
iFactory AI benchmarks energy per tonne by process step and ranks the actions that close the gap. Book a walkthrough to see it on your own plant.