Every Indian steel producer is asked the same question by its board: how does our cost per tonne compare with the others? The answer is rarely simple. Plants differ in route, captive mines, power sources, product mix and how their accounts are drawn up, so a raw comparison of published figures can mislead more than it informs. A sound benchmark first puts every plant on a common footing, then explains the gap driver by driver. Teams planning a 2026 benchmarking study can see how iFactory AI structures a like-for-like cost comparison before they pick a peer set.
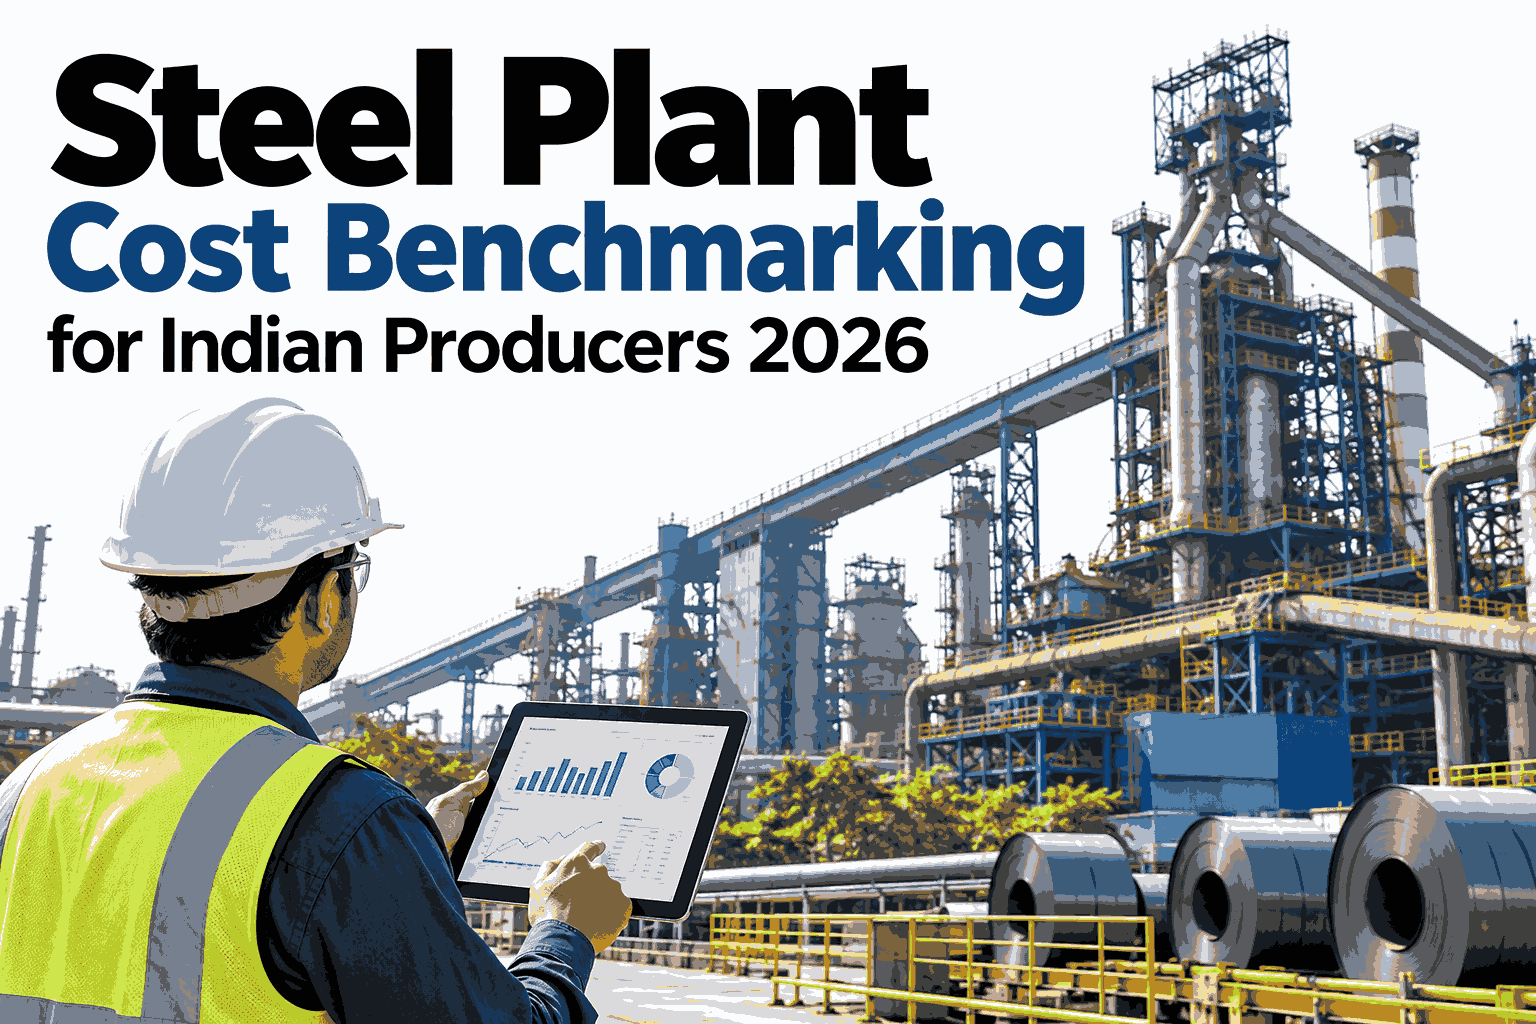
Steel Plant Cost Benchmarking for Indian Producers in 2026
A practical method for comparing cost per tonne against national peers, so the gap you find is real, explained and worth acting on.
Why Raw Comparisons Mislead
Large Indian producers such as SAIL, JSW, Tata Steel and JSPL publish annual reports, but the numbers reflect different structures. Four differences do most of the damage.
Blast furnace, DRI with electric furnace and scrap-based plants carry very different cost structures.
Captive mines, power plants and by-product sales change what sits inside the reported cost.
Flat, long and special products have different conversion cost and realisation.
Cost classification, depreciation policy and inventory valuation differ between reporters.
Because of these differences, a benchmark built on headline figures tends to reward whoever has the most favourable structure, not the best operating performance.
The Normalisation Funnel
Comparable numbers come from removing structural differences one layer at a time. What remains is the operating cost you can actually compare.
Run the Funnel on Your Own Plant Data
Book a 30-minute session and iFactory AI will show how your cost per tonne is normalised by scope, route, mix and price basis before any peer is compared.
Choosing the Right Peer Set
A good peer set is narrow enough to be fair. Compare like with like on route first, then widen only for context.
Which Driver Explains the Gap
Once numbers are comparable, split the difference into drivers. The chart below is an illustrative example of a gap of 100 units against a peer, not a measured result.
The lesson is in the ranking. Chasing the smallest bar first wastes effort, and a gap driven by raw material access may need a sourcing answer, not an operating one. A guided gap analysis on your own numbers shows which bars are actually yours to move.
Adjustments to Make Before You Compare
Use this table as a checklist for each peer. Skipping a row is the most common reason benchmark results are challenged later.
| Adjustment | What to Align | Risk If Skipped |
|---|---|---|
| Scope | Mining, power and by-product credits included or excluded | Integrated peers look cheaper or dearer without operating cause |
| Route | Blast furnace, DRI or scrap-based process | Structural gap mistaken for inefficiency |
| Product mix | Flat, long and special grades weighted by tonnes | Mix effect reported as cost performance |
| Price basis | Same period, currency and input price index | Input price swings drown out operating differences |
| Utilisation | Capacity utilisation for each plant in the period | Fixed cost spread hides real efficiency |
A Benchmarking Rhythm That Lasts
A one-off study fades. A light, repeating cycle keeps the benchmark alive and tied to decisions.
Track internal cost per tonne and driver movement so gaps are seen early.
Refresh peer data from filings and update normalisation adjustments.
Review the ranked gap drivers and pick projects with owners.
Rebuild the peer set and tie targets to the annual budget.
Where iFactory AI Fits
iFactory AI supplies the internal half of the benchmark, a clean and continuously updated cost per tonne by driver, so the comparison with peers starts from your own numbers, not estimates.
Driver-level internal baseline
Cost per tonne is split into raw material, energy, yield, labour and maintenance by unit, ready to line up against peer structures.
Normalisation support
Scope, route and mix adjustments are stored with the model, so the same logic is reused each cycle.
Gap ranking
Differences against a chosen peer are ranked by value, pointing teams at the drivers worth pursuing.
Continuous, not annual
The internal baseline refreshes as plant data arrives, so a benchmark never rests on stale figures.
iFactory AI arrives pre-configured on an NVIDIA server that ships racked and ready with software pre-loaded. Scope covers cabling, network, ERP and MES integration, team training and 24x7 remote monitoring.
Frequently Asked Questions
Can we compare our cost per tonne directly with published figures?
Not safely. Published numbers reflect different routes, captive assets, product mixes and accounting choices, so a raw comparison mostly measures structure. Normalising scope, route, mix and price basis first gives a fairer picture. You can walk through the normalisation steps on your own data in a live session.
Which peers should an Indian producer benchmark against?
Start with peers on the same route and a similar product mix, then widen for context. An integrated flat products plant learns more from other integrated producers than from a scrap-based mill. Keeping the peer set narrow keeps the gap credible with your board. To design yours, request a peer set working session with the iFactory AI team.
What data do we need from our own plant?
You need cost by line and unit, tonnes by product, consumption of ore, coal, scrap and power, and utilisation for each period. Most of it already sits in ERP and plant systems but is rarely joined. See which of your data sources can be connected first, or ask support for the data checklist.
How often should benchmarking be repeated?
Track internal cost monthly, refresh peer data quarterly and rebuild the peer set yearly. Peer filings arrive on a set schedule, but your own drivers can drift at any time, so continuous internal tracking matters most. A short product tour of the live baseline shows how that cadence works in practice.
What do we do once we find a gap?
Rank the gap by driver, separate structural causes from operating ones, and assign owners to the operating drivers worth pursuing. A gap driven by raw material access needs a sourcing plan, while one driven by yield or energy points at the plant. Schedule a walkthrough of gap ranking to see how the priorities are set.
Benchmark With Numbers You Can Defend
iFactory AI gives you a clean, driver-level cost per tonne to compare against peers. Book a walkthrough to see it built around your own plant and route.